|
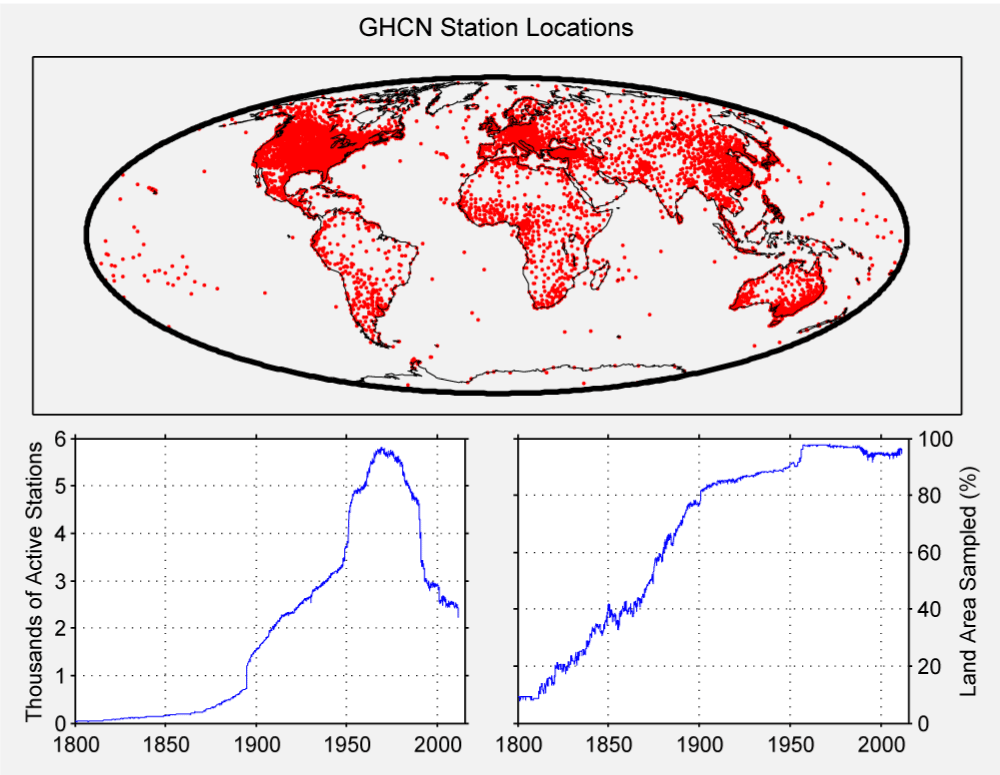
| Figure 2: (Upper) Station locations for the 7280 temperature stations in the Global Historical Climatology Network (GHCN) Monthly dataset. (Lower Left) Number of active stations over time. (Lower Right) Percentage of the Earth’s land area sampled by the available stations versus time, calculated as explained in the text. The sudden rise in land area sampled during the mid 1950s corresponds to the appearance of the first temperature records on Antarctica. |