|
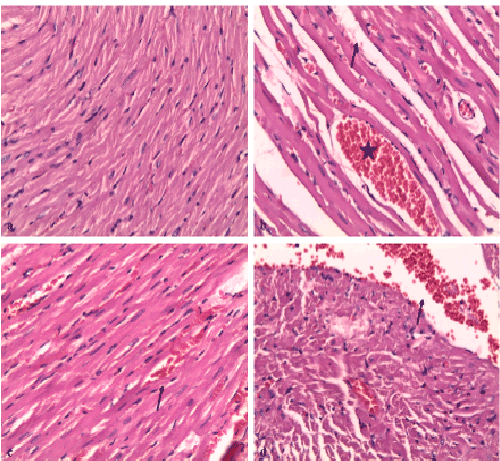
| Figure 2: a. heart of control group showed normal tissue; b. heart of group 2 showed sever congestion and hemorrhage (star) with myocardial edema (arrow);c. heart of group 3 showed hemorrhage (arrow); d. heart of group 4 showed sever hemorrhage (arrow), (H&E X200). |