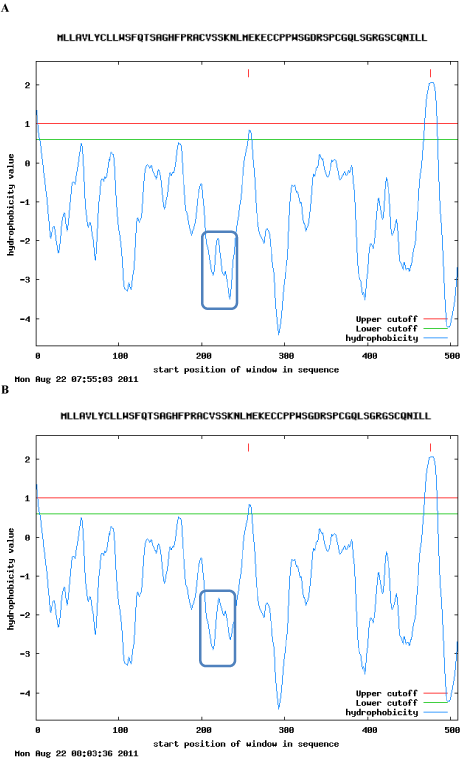
Comparison of Hydropathy plot between wild-type and mutated TYR gene. TopPred online software predict the effect of substitution of R239W on TYR protein hydrophobicity. The x-axis represents the position of amino acids. The y-axis represents the hydropathy value in a default core window size: (-n) 10; wedge window size: (-q) 5.
A: Hydrophobicity of wild type protein.
B: Hydrophilicity of mutant protein. The difference in the hydrophobicity at the point of mutation is highlighted with rectangle box.