Spanish
  Chinese
  Russian
  German
  French
  Japanese
  Portuguese
  Hindi
Hindi Research Article, J Phys Res Appl Vol: 4 Issue: 1
A Neutron Scattering Correction Method for the Quantitative Evaluation in Thermal Neutron Radiography
Osman H1*, Abd-El-slam T2, Hassan M1 and Abou Mandour1
1Nuclear and Radiation Engineering Department, Alexandria University, Alexandria 21544, Egypt
2Atomic Energy Authority (AEA), Egypt Second Research Reactor (ETRR-2), P. O. Box 13579, Abo Zabal, Egypt
*Corresponding Author : Osman H
Nuclear and Radiation Engineering Department, Alexandria University, Alexandria 21544, Egypt
Tel: 00201554493509
E-mail: eng-hassan.abdalhai@alexu.edu.eg
Received: December 02, 2019 Accepted: January 11, 2020 Published: January 20, 2020
Citation: Osman H, Abd-El-slam T, Hassan M and Abou Mandour M (2020) A Neutron Scattering Correction Method for the Quantitative Evaluation in Thermal Neutron Radiography. J Phys Res Appl 4:1.
Abstract
The precise quantitative evaluation of hydrogenous material; such as water and oil; is problematic because of their high scatter contribution which blurs neutron radiography images. This work aims to design an algorithm in MATLAB to eliminate the scattering components. The algorithm will evaluate the scattered neutrons’ components’ summation and subtract it from the original image to achieve an image free from scattered neutrons. The achieved scatter-free image is used in the quantitative evaluation. This research is significant due to its use of applied, real-case neutron -radiography digital images processed in MATLAB as opposed to using time-consumed simulations by MCNP to estimate scatter neutrons like most previous works on neutron scattering correction. Pottery samples will be filled with a known weight of oil and imaged in the neutron radiography facility at the Egyptian Second Research Reactor to perform neutron scatter-correction experiments. A calibration curve will be built from a histogram peak, which relates the number of pixels in an image at each of the different intensity values of that image as a function of the oil weight, to predict the unknown weight of oil in other samples. A good prediction of the oil quantities is achieved by the calibration curve.
Keywords: MATLAB; Neutron Radiography; Quantitative measurementcontrol; Arduino; Circular cylinder; Renewable energy
Introduction
Most of the previous scattering correction methods in neutron radiography (NR) depend on evaluating the scattered neutrons by the point scatter function (PScF) using Monte Carlo simulation. The point scatter function describes the probability density that a neutron scattered from a sample and hits the detector in a distance r from the projected point [1]. Examples of these studies discussed in References [2-6]. In this work, real case NR image is applied while benefiting from the digitization of neutron imaging system; which allows obtaining (NR) as a grayscale picture; to correct the scattering effects. The grayscale values of the digital image are related proportionally to the incident neutron flux [7]. The neutron flux beam passing through the sample is characterized by an exponential function. For high scattering cross-sections materials; like the Hydrogen; the beam attenuation is no longer exponential. A buildup factor (Bs) is usually added to the attenuation Equation (1) to compensate for this deviation caused by the scattered neutrons components [8].
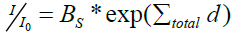
Where; Io and I are the intensities of the beam before and after the transmission. Ʃtotal and d are the macroscopic total cross-section and the thickness of the sample respectively. (B_s) is the scatter buildup factor. The change in the pure transmission value by scattering is corrected by calculating the scatter contribution and subtracts it from the radiograph to achieve scatter-free image. The scatter contribution which is defined by buildup factor (Bs); cannot be directly obtained. A proposed algorithm is developed in MATLAB to estimate the scattering components (Bs) as follows.
Free scatter image=Radiograph image–scatter components (BS).
Based on the proportionality relation of the neutron flux with the grayscale values of a digital image, the scattered neutrons are described as a blur in the digital image. We developed a mathematical model in MATLAB to restore the scatter-free image. MATLAB is an excellent environment in which to develop and analyze filtering methods for image deblurring with a comprehensive set of reference-standard algorithms for image processing [9].
Neutron Radiography Facility (NRF) at the ETRR-2
All experiments implemented within the frame of this work have been performed at the neutron radiography facility (NRF) in the Egyptian second research reactor (ETRR-2). An overview of the main characteristics of the facility is given in Table 1 [10]. Digitization of the NRF has the potential to improve the performance of the neutron radiographic investigations. The neutrons are attenuated, and a sufficient amount of light is produced by a scintillation screen that detected with a high-resolution, 14-bit charged-coupled device (CCD) camera. The detection process employs the nuclear reaction 6Li (n, α) 3H in which the resulting alpha particle and triton produce scintillations upon interacting with the ZnS(Ag) [10]. The scintillator is specially developed for detection of the thermal neutrons and provides excellent discrimination against gamma background [11].
| Parameter | Characterization |
|---|---|
| Inlet aperture (D) of the collimator | 3 cm |
| Outlet aperture of the collimator | 22 cm |
| Source to object distance (L) | 351.8 cm |
| L/D ratio (resolution parameter) | 117.3 |
| Neutron flux density at the sample position | ~ 1.5 × 10⁷[n.cm-2s-1] |
| Cadmium (Cd) ratio | 10.26 |
| (nth/γ) Ratio | 105 n cm-2 mR-1 |
Table 1: The main characteristics of the NRF at the ETRR-2 [10].
Methodology
Image deblur by filters in MATLAB
The neutrons scatter from the sample cause imaging blur which is modeled by Poisson distribution [12]. The iterative Richardson- Lucy (RL) deconvolution algorithm is induced in MATLAB to restore this blur by convolving NR image with a point-spread function (PSF) assuming Poisson statistics [9]. Equation 2 represents the iterative Richardson-Lucy algorithm formula [13].
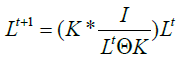
Where; Lt and Lt+1 are the current and next iteration deblurred image K is the Point Scatter Function (PSF), I is the blurred image, is the convolution operator, and t is the iteration. The fundamental task of deblurring quality is mainly determined by increasing the number of image iterations with fixed PSF in the filter until an image free from sample scatter called process image (PI) is obtained. Despite the clear image obtained by this filter, a smooth blur still appears in the image due to the scattered neutron coming from various other distortions; such as the camera; with the surrounding materials. This blur is modeled as Gaussian distribution, the shape of the Gauss function was chosen due to the good agreement at large collision angles [12]. A Gaussian filter is used to clear this blur. The 2D Gaussian function G (i, j) is defined as Equation 3 [13]:
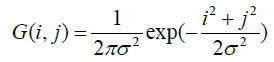
Where; σ is the standard deviation which gives the width of the Gaussian-shape curve. The i and j are the Cartesian coordinates. The MATLAB supports the generation of Gaussian filter with tunable σ.
The proposed algorithm for neutrons’ scattering correction
As mentioned before, the algorithm is developed by the image processing tools package in MATLAB. Figure 1 displays the flow chart of the algorithm. To remove the sample scattering component, the deconvolution iterative Richardson–Lucy filter is applied to the unprocessed NR image (UI). These results in creating an image clear from sample scattering called processed image (PI). On the other hand, A Gaussian blur image (GBI); created by applying the Gaussian filter to the (UI); compensates for the camera and surrounding scatter component. The (GBI) denotes adjusting the blurring by the simultaneous iterative tuning of (σ) until the appearance of oil concentration inside the wall of the pottery sample was obtained. The resulting images (GBI & PI) were subtracted from the original unprocessed image to calculate the scatter image (SI1, SI2). Where, the Scattered Image (SI1) is the difference in pixels intensity between the original unprocessed image and the sample scatter-free image (PI) process with R-L filter. The Scattered Image (SI2) is the difference in pixel intensity between the original unprocessed image and camera scatter-free image (GBI) processed by Gaussian filter. The summation of the SI1 & SI2 images results in total blur image (TBI), which combines the components of the blur caused by the two scattered neutrons components. Finally, the resultant (TBI) is subtracted from the unprocessed neutron radiography Image (UI) to obtain scatterfree Image (FI).

Figure 1: Flow chart of the three stages to achieve the scatter-free image.
Sample preparation and production of scatter-free images
Five pottery samples were prepared to perform the neutron scattering correction and quantitative measurement. The samples were filled with measured values of oil increasingly from 200 to 600 mg. To confirm likeness in the experiment setup parameters all samples were fixed in a holder and radiograph in one exposure. The proposed method perfectly eliminates the blur and degradation of the NR image and achieves a neutron scattering correction for a real image. Figure 2 (a) shows the actual photograph image of the pottery sample in the presence of oil. Figure 2 (b) is the pottery NR unprocessed image shaded by scattered neutrons. Figure 2 (c) shows the scattered-free high-quality image obtained by applying the proposed method.

Figure 2: (a) Actual photograph of the oil pottery (b) The NR unprocessed image shaded by scatter neutron (c) The obtained scatter-free image with clear appearance of oil.
Figure 3 shows the code result output images of the mathematical operations in the algorithm represent the calculation of the scatter components (SI1 &SI2) and sum them in TBI to subtract from the original image (UI) to reach a scatter-free image. The optimum number of RL-filter iterations applied in the code to eliminate the scattering from the sample is 200 iteration. The tuned best sigma value for the Gaussian filter is 0.18.

Figure 3: Results of code implementation to achieve scatter-free image.
Image calibration and quantitative evaluation of oil quantities
Calibration procedures were developed to assess the quantitative measurements of oil inside the pottery samples. This technique is suitable for the quantitative measurement of hydrogenous materials retained inside the pottery samples. The calibration procedure is performed for the five-pottery scatter-free images containing 200, 300, 400, 500 and 600 mg of oil. Figure 4 shows scattered-free samples’ images after applying the algorithm. The neutron scattering is affected by the shape and weight of the sample. We assume the shape parameter is constant, as all sample had the same shape, while the weight change is taken into consideration when estimating the scattering build-up factor.

Figure 4: The scatter-free image with 200, 300, …, 600 mg oil (displayed from left to right).
Quantitative measurements require to relate the scatter-free image intensities; i.e., gray values; to the actual oil values. High frequencies indicate high specific gray level values. Increasing the amount of oil (from 200 to 600 mg) will be reflected by increasing of a highfrequency pixel due to the proportionality between the gray values and the neutron flux. To get the highest frequency values in each class occurs in the data set, a histogram was plotted for all resultant scatter-free images to represent the frequency corresponding to the oil quantity. Figure 5 shows an example of such histogram of the scattered-free image of pottery with 200 mg oil. It clear from the histogram, the intensity of the pixels with the gray level value 34 represents the highest intensity frequency (i.e., 3325), thus, the calibration factor is (200/3325) mg oil/intensity frequency.

Figure 5: (a) Scatter-free image of the 200 mg oil in a pottery sample (b) Its corresponding histogram the highest histogram value corresponds to a frequency of 3325.
Table 2 shows the measured oil values with corresponding histogram peaks for the five scatter-free images of the test samples. Based on this table, a reference calibration curve is developed to relate the oil values vs. the peak frequency. The best-fitting curve was fitted to a binominal equation (4) with an error of less than 5% as shown in Figure 6.

Figure 6: Calibration curve for the premeasured oil weight values vs. the corresponding frequencies.
| Oil measured value | Freq. from the histogram |
|---|---|
| 200 | 3325 |
| 300 | 3461 |
| 400 | 3837 |
| 500 | 5446 |
| 600 | 7500 |
Table 2: Exact measured oil values and the corresponding histogram frequency.

To test the calibration curve, two assumed unknown values; i.e. 300 & 500 mg; were evaluated by the algorithm to get the histogram, then projected the corresponding frequencies in the calibration curve to get the assumed unknown weight. The corresponding histogram peak value of the scatter-free image for the first sample was a frequency of 3520, and for the second sample was a frequency of 4815 respectively. When these frequencies were substituted in the fitting curve equation, they gave a weight of 344 mg and 468 mg oil as shown by the red lines in the curve (Figure 7). The error of the weight’s estimation is 12.7% and 6.3% respectively.

Figure 7: Projected frequencies with red lines to predict the unknown oil values.
This quantitative measurement method is verified by examining three different wood sample filled with water. The wood samples calibration curve gives a good evaluation of the water with a maximum error of 15.1%.
Results
A new technique based on neutron scattering correction conducted by MATLAB perfectly eliminates the blur in the NR image. The methods of iterative RL-filter and continuous tuning of the arbitrary standard deviation (σ) factor in the syntheses Gaussian filter gives a good estimation of the scattering build-up factor to correct for the scattered neutrons and achieve quality NR image. Quantitative measurements were performed by developing calibration curves, which were examined for different values and give good results for oil weight measurement with maximum error 12.1%. Most of the previous works on neutron scattering correction has been done based on Monte Carlo simulation. One such study showed that at higher fluid values, the error in calibration due to scattering is noticed [14]. In comparison to this work, where the calibration curve was extracted from the histogram of real NR image, the result is consistent at high fluid (oil) value.
Conclusion
When neutron radiography is used, high-scattering hydrogenous materials distort quantitative measurements and causes blurred images of the samples. In this work, samples of pottery jars filled with measured values of oil were radiographed under the same conditions in the ETRR-2 Neutron radiography facility. Then, an algorithm using Image Processing Toolbox (IPT) package in MATLAB to estimate the blur of the image due to neutron scattering was developed using an iterative Richardson–Lucy algorithm as well as a Gaussian filter. The developed algorithm was used to obtain blur-free images. These images were used to assess the quantitative measurements of oil inside the pottery jars. A calibration curve was developed from the intensity histogram of a real NR image and was successfully used to predict the weight of oil in the samples. This work was verified by test different wood samples filled with water. The quantitative value of water was successfully evaluated with an error less than 15.1%. This measurement validates the method to be successfully applied for quantitative measurement.
Acknowledgements
The authors would like to thank the ETRR-2 operation staff for their cooperation in this work.
References
- Hassan MH (2009) Point scatered fuction (PsFC) fo fast neutron radiography. Nuclear Instruments and Methods in Physics Research B267: 2545-2549.
- Kardjilov N, Beer FD, Hassanein R, Vontobel ELP (2005) Scattering correction in neutron raddiography using point scattered function. Nuclear Instruments and Methods in Physics Research 542: 336-341.
- Park J (2000) Neutron scattering correction functions for neutron radiographic images. Thesis (PhD). University of Michigan, USA.
- Raine DA, Brenizer JS (1997) The analysis and correction of neutron scattering effects in neutron imaging. Material Evaluation pp: 1174-1178.
- Cao L, Wang M, Wu H, liu Z, Cheng Y, et al. (2013) Scattering correction for image reconstruction in flash radiography. Nuclear Engineering and Technology 45: 529-538.
- Hassanein R, Lehmann E, Vontobel P (2005) Methods of scattering correction for quantitative neutron radiography. Neuclear Instruments and Methods in Physics Research 542: 353-360.
- Hassanein R, Beer FD, Kardjiloy N, Lehmann E (2006) Scattering correction algorithm for neutron radiography and tomography tested at facilities with different beam charactristics. Physica B: Condensed Matter 385-386: 1194-1196.
- Chabot G (2003) Shielding Equations and Buildup factors Explained. Bethesda, MD, USA.
- MathWorks. 2020.
- Mongy T (2013) Application of neutron tomography in cluture heritage reaseach. Applied Radiation and Isotopes 85: 54-59.
- Stedman R (2004 ) Scintillator for Thermal Neutrons Using Li6F and ZnS(Ag). Review of Scientific Instruments 31: 1156.
- Hansen PC, Nagy JG, O'Lery DP (2006) Deblurring images, matrices,spectra, and filtering. Society for Industrial and Applied Mathematics.
- Mongy T (2017) A new method for detectiong trace oil concentration by neutron radiography. International Conferance on Applications of Radiation Science and Technology Vienna.
- Nemec T, Jeraj R (1997) Calibration of quantitative neutron radiography method for moisture measurement. iInternational Conference Nuclear Energy in Central Euroe99, Portoroz,Slovenia.