Spanish
  Chinese
  Russian
  German
  French
  Japanese
  Portuguese
  Hindi
Hindi Review Article, Res J Opt Photonics Vol: 2 Issue: 2
A Novel Library for the Correction of a GalvoScanner’s Non-Linearity at High Frequencies
Ali Hariri1, Afreen Fatima2 and Mohammad RN Avanaki1,2,3*
1Department of Bioengineering, Wayne State University, Hancock St, Detroit, MI, USA
2Department of Neurology Medicine, Wayne State University, Detroit, MI, USA
3Barbara Ann Karmanos Cancer Institute, Detroit, MI, USA
*Corresponding Author : Mohammad RN Avanaki
Department of Biomedical Engineering, Assistant Professor, Wayne State University, Detroit, Michigan, United States
Tel: +1 313 577-0703
E-mail: ft5257@wayne.edu
Received: July 2, 2018 Accepted: July 17, 2018 Published: July 24, 2018
Citation: Hariri A, Fatima A, Avanaki MRN (2018) A Novel Library for the Correction of a Galvo-Scanner’s Non-Linearity at High Frequencies. Res J Opt Photonics 2:2.
Abstract
Galvo-scanner is a two dimensional beam steering system essentially employed in microscopic imaging modalities. The advent of microscopy in tumor diagnosis and functional imaging of the organs and cells is apparently promising as it can unravel the intricate dynamics of the biological processes at microscopic level in real time. For instantaneous measurement of pigment (melanin) concentration and monitoring the fractional changes in oxygen hemoglobin saturation, the microscopic imaging system must be very rapid in terms of scanning and data acquisition. However the images obtained from such systems were found to be distorted. In an attempt to make the high speed imaging system efficient, we conducted an in-depth study on the problem, its causes and formulated an optimal solution. We studied and analyzed the behavior of a Galvo Scanner (GS) at different scan frequencies. A triangular signal is usually employed to drive the GS. Conventionally, the GS’s mirrors move in accordance with the input control signal at low scan frequencies (less than 100 Hz) but as we advance to higher scan frequencies (more than 700 Hz), GS fails to obey the input due to the inherent mechanical inertia of the mirrors. This scrambles the distance between the microstructures being imaged, thus leading to distortions in the images obtained. Therefore we propose a novel library of (purposely) distorted ramp signal to deal with this problem. The rationale behind this idea is to provide the GS enough voltage to overcome the inertia so that the resultant movement is a linear ramp. The results obtained showed a significant improvement in the behavior of the scanners in the terms of spectral width of the FWHM of the output signal.
Keywords: Galvo-scanner; Frequency; Laser scanning and Microscopy
Introduction
Galvo Scanner (GS) is widely used for lateral laser scanning in various imaging modalities such as photoacoustic microscopy [1-3], confocal microscopy [4-8], and optical coherent tomography [9,10]. GSs are employed in microscopic imaging modalities to steer the focused beam in a two dimensional space. This mechanism is used instead of mechanical scanning using a manual or a motorized XY scanner. The two dimensional scanning using an XY scanner is illustrated in a cartoon in Figure 1. Usually, photoacoustic microscopy requires a scan rate of 1 KHz [1] and most OCT systems operate at 2-200 Hz frame rate and scan frequencies of around 4 MHz have also been reported. Functional imaging microscopy modalities require a higher scanning rate, e.g., 200 KHz for recording real-time, in-vivo, data of dynamic processes [11] . Unfortunately, this leads to degradation of the image resolution due to the nonlinear behavior of the GS mirrors. The nonlinear behavior of GS is more pronounced at higher scan rates, i.e., above 1 KHz which corresponds with high acquisition rates, thereby causing a tradeoff between speed and image quality [9]. In this study, we introduce a solution for this problem that can potentially generate images with less artifact in high speed galvoscanner based microscopic imaging systems.

Figure 1: Dual axis Galvo-scanner with galvanometers and mirrors.
Typically, a GS includes a motor assembly, mirrors, mirror mounts, driver electronics and a heat sink. The angular displacement of the mirrors is directly proportional to the voltage applied to the high speed, current sensitive electrical motors. Open and closed loop are two major types of this device. An open-loop scanner does not have a position detector device while a closed-loop scanner has one. Closedloop GS is equipped with a position detector, a position correction and feedback signals. These signals are sent to linearize angular deviation [12]. The popularity of the closed-loop GS stems from its unique combination of positioning accuracy, speed, control flexibility, ease of integration and cost for optical scanning applications [13].
Different waveforms can be given as an input to the GS driver circuit. However triangular waveform is usually preferred as it generates images with fewer artifacts compared to a sinusoidal waveform. Using saw-tooth waveform for scanning also generates less distortions, however it has the fly back portion that needs to be discarded [14]. The key performance criteria of a GS actuator are its torque/inertia ratio, its maximum peak and Root Mean Square (RMS) torque capability, mechanical resonant frequency, positioning repeatability characteristics and bearing technology lifetime. The response time of a GS is defined by the torque, constant peak current capability, its inertia and mechanical resonant frequency. The GS’s maximum repetitive frequency depends on its maximum power capability and the ability to dissipate the heat during the operation. The positioning precision of the actuator is determined by its bearing suspension, design sensitivity to manufacturing tolerances and method of integrating a position detector technology into its design [13].
At high input frequency, GS cannot exactly follow the shape of the control signal because of a considerable mechanical inertia in the mirrors [15]. At high scan frequencies, the nonlinear portions of the scanning waveform are the main cause of producing artifacts in the image, which consequently results in the loss of data and clinical misinterpretations. The algorithm implemented in the driver circuit of GSs compares the actual position of the mirror with the expected position at a given voltage. It then generates a correction signal, which is combined with the input signal to be sent to the GS. Despite such correction, at large rates, when the angular deviation nonlinearity becomes stronger, the correct is not as efficient any longer and further correction is required.
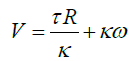
The non-linear behavior of the GS occurs due to the inertia when insufficient voltage is applied to stop and turn the mirrors instantaneously [16,17], which eventually causes artifacts and distortions in micro-scale resolution imaging modalities [1-3]. There are various methods to correct the nonlinear effects. It can be observed from equation (1) that the output torque (τ) is proportional to the input voltage (V).
 (1)
(1)
 (2)
(2)
 (3)
(3)
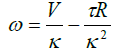
Where ω, is the angular velocity, k is the torque electrical constant of the motor and R is the coil resistance. Therefore the angular displacement θ, of the mirrors is a function of the voltage applied (equations 2 and 3). This explains the principle of working of a GS.
L = Iω (4)
τ =ω × L (5)
τ = Iα (6)
Where α is the angular acceleration and I is the moment of inertia. The angular velocity, ω, of the mirror is directly related to the control (input) signal frequency. Increase in the input frequency causes the mirrors to move faster, this leads to an increase in the angular momentum, L (equation 4). According to the classical physics, the angular momentum of a system remains constant unless an external torque acts on it. Therefore, at input frequencies when there is rapid change in the position of the mirrors, sufficient voltage has to be applied in order to generate enough torque to overcome the inertia and attain the momentum (equations 5 and 6).
In this study, we intend to investigate the behavior of the GS at different scanning speeds and propose a novel dictionary to generate a purposely distorted triangular signal in order to eliminate the nonlinear behavior at high frequencies.
Methods
Experimental section
He-Ne laser with the central wavelength of 632.8 nm is spatially filtered by means of an iris and then illuminates on the mirrors of the GS. The Galvo scanner was GVS012, a galvo scanning system with silver-coated mirrors from Thorlabs Inc., USA. One dimensional scanning is done by keeping one mirror stationary while the other one undergoing angular displacement proportional to the input voltage. Initially, we study the effect of frequency of the scanning signal on the GS’s behavior. Triangular waveform of 5 V peak-to-peak amplitude is generated by high speed analog output card (PXI-6711, National Instrument, USA) and applied to the GS driver. A commercial linescan camera (Linea GigE CMOS Vision Camera, USA) is utilized to record the laser scanning. Sapera LT 8.0 software is used as the image acquisition software.
Line scan camera saturation is reduced by using Beam splitter (70:30) and neutral density filter which is placed before the line-scan camera. Line acquisition rate is proportional to the frequency of GS. Different frequencies from low to high (10 to 3 KHz) are applied to GS and the line scanner captures the frames with the corresponding line rates (1000 to 80k lines/sec). Figures 2a and 2b shows the schematic and photograph of our setup. To overcome the inertia when the mirrors are made to suddenly start, stop or turn, we generate various templates of distorted ramp signal with the help of a high speed analog output card (PXI-6711, National Instrument, USA). The template signals have voltage values that counteract the nonlinear tendency and force the GS to follow the linear ramp movement. High voltage is applied to the GS at start, turn and stop points. Different templates are generated based on different initial voltage values and the pattern of variation of the voltage values. These distorted ramp signals are sent to the GS driver and frames are captured for frequencies (500 Hz-3000 Hz). The acquired frames are saved in bmp format and then sent to the processing section.

Figure 2: (a) Schematic and (b) Photograph of the experimental section of our study.
Processing section
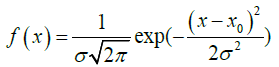
MATLAB R2015a is used to process the raw data acquired from the experimental setup. In order to find the position of the maximum intensity value in each intensity profile, which represents the position of the GS’s mirror at a specific time, each line of the frame is scanned (Figure 3). The spectrum analysis is performed by calculating the Fourier transform of the signal. Fourier transform spectrums are fit on the desired Gaussian model using Curve Fitting toolbox in MATLAB. Full Width at Half Maximum (FWHM) expression is used as criterion for measuring the spectral width of the frequency profile after performing Gaussian fitting. Equation 7 is used for Gaussian fitting:

Figure 3: Block diagram of the processing section.
 (7)
(7)
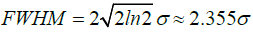
Where, σ is the standard deviation and x0 is the expected value. The FWHM is calculated as follow.
 (8)
(8)
We calculated FWHM of the output signal for various templates at different frequencies.
Results
Triangular waveforms of eight different frequencies with 5 volt peak-to-peak are generated by a high speed analog output card and applied to the GS’s driver circuit. Line acquisition rates are set proportional to the Galvo mirror’s movement frequency. We examine the movements at 10 Hz, 50 Hz, and 500 Hz, 750 Hz 1000 Hz, 1500 Hz, 2000 Hz and 3000 Hz with line rates set to 1000 lines/s, 2000 lines/s, 10k lines/s, 50k lines/s, 75k lines/s and 80k lines/s respectively. For each frequency, a frame was acquired and each line in it contained the position of GS at a particular instance of time. The position of the Galvo mirrors with respect to time is observed, recorded, calculated and plotted. Laser position is detected in each line and then we calculate the absolute value of Fourier transform for each scan at various frequencies and line rates. We fit the Spectrum signal on the Gaussian distribution and measure the FWHM of the output signal at each frequency. The amplitude of the Fourier transform in Figure 4 represents the laser position at eight different scan frequencies.

Figure 4: Fourier transform amplitude of laser position at different frequencies (a) 10 Hz, (b) 50 Hz, (c) 500 Hz, (d) 750 Hz, (e) 1000 Hz, (f) 1500 Hz, (g) 2000 Hz and (h) 3000 Hz.
After fitting the spectrum signals on the Gaussian distribution, we calculate the FWHM at each frequency. Table 1 and Figure 5 show the variation in FWHM with the frequency change.
| Frequency (Hz) | FWHM |
|---|---|
| 10 | 0.82 |
| 50 | 3.56 |
| 500 | 70 |
| 750 | 100.4 |
| 1000 | 150 |
| 1500 | 226 |
| 2000 | 244 |
| 3000 | 270 |
Table 1: Eight different frequencies and correspond FWHM.

Figure 5: Eight different frequencies and the correspond FWHM.
According to Figure 5, the Spectral width of the output signal (that represents the current angular position of the galvo-mirror) is associated with the scan frequency. At high frequencies, the increase in the spectral width is due to the addition of harmonics. Figures 4d-4h shows the effect of frequency on the FFT spectrum of the output signal. In these figures FFT spectrum width becomes wider with increasing scan frequency and the increase in the width becomes significant from 1 KHz scan frequency. As discussed earlier, the reason for this behavior is inertia. Initially mirrors in the GS are stationary so in order to move these mirrors at high frequency, enough voltage is required to overcome the inertia. Similarly in order to stop or turn the mirrors we need to supply sufficient voltage. The distorted ramp signals have non uniform change in the amplitudes with respect to time unlike the triangular signals in which the voltages change is uniform with respect to time. The distorted ramp signals were generated by high speed analog output card and applied to GS’s driver. Figure 6 shows ten different distorted ramp signals which were applied to GS.

Figure 6: Distorted ramp waveforms for Galvo scanner’s nonlinearity correction.
We generated template signals for scan frequencies 500 Hz, 750 Hz, 1000 Hz, 1500 Hz, 2000 Hz and 3000 Hz as the nonlinear behavior becomes more apparent at high frequencies and we applied them to the GS driver. We repeated the experiment and performed processing with the distorted ramp signals and calculated the FWHM for each template. In Table 2 the FWHM of the output signal with distorted ramp as input signal templates is compared to the FWHM of the output signal with a perfect ramp input signal.
| Input Signal/Frequency(Hz) | Ramp Signal | Template 1 | Template 2 | Template 3 | Template 4 | Template 5 | Template 6 | Template 7 | Template 8 | Template 9 | Template 10 |
|---|---|---|---|---|---|---|---|---|---|---|---|
| 500 | 70 | 41.2 | 50 | 55 | 60 | 56 | 64 | 58 | 65 | 45 | 40 |
| 750 | 100.4 | 96 | 96 | 90 | 88 | 84 | 96 | 68 | 86 | 70 | 86 |
| 1000 | 150 | 84 | 86 | 48 | 120 | 114 | 105 | 92 | 101 | 90 | 100 |
| 1500 | 226 | 184 | 182 | 180 | 158 | 130 | 168 | 176 | 120 | 146 | 180 |
| 2000 | 244 | 136 | 218 | 202 | 236 | 156 | 180 | 118 | 185 | 232 | 203 |
| 3000 | 270 | 150 | 150 | 250 | 248 | 170 | 118 | 214 | 196 | 218 | 172 |
Table 2: Six different high frequencies distorted ramp signal and correspond spectral width in terms of FWHM.
From the data in Table 2 we observed that FWHM of the obtained output signal when distorted ramp signal is fed as an input is lesser when compared to the FWHM obtained when the input was a perfect ramp signal. It is clear that applying enough force to turn or stop the mirrors has significant effect on FWHM. When we are talking about the decrement in FWHM it means that at high frequencies with distorted ramp signal as an input we will have less harmonics added than perfect triangular signal. In addition, from Table 2, it can be observed that each template has a minimum FWHM at a particular scan frequency. For example we can use Template 10 to get a narrow spectrum at 500 Hz. Template 7 has narrower spectral width than other templates for both 750 Hz and 2000 Hz. In order to get a narrow spectrum at 1000 Hz, our results recommend using Template 3. While Template 8 is suitable for 1500 Hz, we can use either template 1 or 2 for 3000 Hz.
Discussion
GS does not precisely follow the input triangular signal at high frequencies (>750 Hz) due to the mechanical inertia inherently exist in the configuration of the scanner. Such artifact can be observed through Fourier transform of the signal recorded in a high speed line camera that measures the laser light reflected from it. The non-linear behavior of the GS occurs due to the inertia when insufficient voltage is applied to stop and turn it instantaneously. The problem can be overcome if the sudden movements can be replaced with gradual ones. Therefore, we provide a library of signals that nearly resemble a triangular signal and have voltage values that can potentially counteract or overcome the inertia at specific frequencies. Hence based on the nature of application and the operating frequency one can choose a suitable signal from the library. For instance, if a GS based microscopic imaging system requires an operating frequency of 200 Hz, we choose template #10 with a minimum FWHM at this frequency. Similarly for (a scanning rate of 3 KHz), templates #1 and #2 give efficient results. Template #7 is appropriate for confocal and fluorescence microscopy.
By convention, at higher frequencies, when the inertia effect becomes dominant, high voltages are required to compensate for nonlinearity in the GSs. Voltage values applied to overcome the inertia depends on the scan frequency. The templates were designed in a way that it cancels out the non-linear tendency of the Galvoscanner thus forcing it to behave linear by making it to follow a ramp. Finally, the non-linearity effect can be further reduced to obtain the optimal set of voltage values in order to make the Galvo-scanner behave perfectly linear.
Summary and Conclusion
In order to study the real-time, in-vivo intricate dynamics of cellular structures and other biological processes, microscopic imaging systems must be equipped with fast pace laser scanning systems. For instance in wide-field functional microscopy systems a scanning rate of 200 KHz is required. The solution that we introduced in this article is by manipulation the triangular signal that is commonly given to the Galvo scanners. The behavior of the GS at different scanning rates, i.e., 10 Hz, 50 Hz, 500 Hz, 750 Hz, 1000 Hz, 1500 Hz, 2000 Hz and 3000 Hz, have been explored. We observed that the GS was incapable of following the input signal at high frequencies. With an aim to make the galvo-scanner behave linear, we designed a library containing a set of template waveforms that have voltage values which can nullify the nonlinear tendency of the galvo-scanner. These waveforms are generated by a high speed analog output card and sent to the GS driver. The displacement of the glavo mirror was traced by a high speed line-scan camera that receives the laser light reflected back from it. Each frame of the line scanner camera was processed to obtain its FFT and the FWHM of it; determine the distortion. The wide (undesired) FWHM associated with high frequency (>750 Hz) scanning rates was then compensated (eliminate the artificial harmonics in the waveform than the principle harmonic) using the proposed waveform templates; it was significantly decreased. A large library of the templates has generated. These templates are available for research use upon request.
References
- Nasiriavanaki M, Xing W, Xia J, Wang V (2014) Functional connectivity in the mouse brain imaged by B-mode photoacoustic microscopy. SPIE BiOS 8943 894364-5
- Lee SY, Lai YH, Huang KC, Cheng YH, Tseng TF, et al. (2015) In vivo sub-femtoliter resolution photoacoustic microscopy with higher frame rates. Sci Rep 5: 1-13
- Hu S (2015) Multi-parametric photoacoustic microscopy of pathological remodeling in vascular anatomy and function. IEEEPhotonics Conference(IPC), 18-19.
- Rajadhyaksha M, Grossman M, Esterowitz D, Webb RH, Anderson RR, et al. (1995) In vivo confocal scanning laser microscopy of human skin: melanin provides strong contrast. J Invest Dermatol 104: 946-952.
- Minsky M (1961) Microscopy apparatus 3013467, FPO, US.
- Rietdorf J, Stelzer EH (2006) Special optical elements, Handbook of biological confocal microscopy. 3rd edtn, James B Pawley, New York.
- Bae YS, Moon S, Kim DY (2008) High-speed image acquisition synchronized with the motion of galvanometer scanner for confocal microscopy. J Biomed Opt 6861: 1-8.
- Larson J, Schwartz S, Davidson M (2000) Resonant scanning in laser confocal microscopy.
- Drexler W, Liu M, Kumar A, Kamali T, Unterhuber A, et al. (2014) Optical coherence tomography today: speed, contrast, and multimodality. J Biomed Opt 19: 071412-071434.
- Wojtkowski M (2010) High-speed optical coherence tomography: basics and applications. Appl Opt 49 D30-D61.
- Zhang HF, Maslov K, Stoica G, Wang LV (2006) Functional photoacoustic microscopy for high-resolution and noninvasive in vivo imaging. Nature Biotechnol 24: 848-851.
- Shanmugasundaram A, Palani R (1989) Electrical machine design data book 2nd Edtn, New Age International, Coimbatore.
- Aylward RP (1999) Advances and technologies of galvanometer-based optical scanners. SPIE's International Symposium on Optical Science, Engineering, and Instrumentation 3787: 158-164.
- Duma VF, Lee KS, Meemon P, Rolland JP (2011) Experimental investigations of the scanning functions of galvanometer-based scanners with applications in OCT. Appl Opt 50: 5735-5749.
- Sanderson MJ (2004) Acquisition of multiple real-time images for laser scanning microscopy. Microsc Anal 17-24.
- Marshall GF, Stutz GE (2011) Handbook of optical and laser scanning. 2nd Edtn , CRC Press.
- Wieser W, Biedermann BR, Klein T, Eigenwillig CM, Huber R, et al. (2010) Multi-Megahertz OCT: High quality 3D imaging at 20 million A-scans and 4.5 GVoxels per second. 18: 14685-14704.