Spanish
  Chinese
  Russian
  German
  French
  Japanese
  Portuguese
  Hindi
Hindi Research Article, J Biodivers Manage Forestry Vol: 8 Issue: 1
Analysing Trade-offs between Recreational Uses and Conservation Issues in the Bãngr-weoogo Urban Park in Ouagadougou (Burkina Faso)
Sidnoma Traoré* and Jean-Michel Salles
Montpellier SupAgro, CEE-M and LAMETA, Univ. Montpellier, CNRS, INRA, SupAgro, 2 Place Viala - 34060 Montpellier, France
*Corresponding Author : Sidnoma Traoré
Montpellier SupAgro, CEE-M and LAMETA, Univ. Montpellier, CNRS, INRA, SupAgro, 2 Place Viala - 34060 Montpellier, France
Tel: 33-0-499612668
E-mail: traoresi@supagro.fr
Received: December 16, 2018 Accepted: February 13, 2019 Published: February 18, 2019
Citation: Traoré S, Salles J (2019) Analysing Trade-offs between Recreational Uses and Conservation Issues in the Bãngr-weoogo Urban Park in Ouagadougou (Burkina Faso). J Biodivers Manage Forestry 8:1. doi: 10.37532/jbmf.2019.8(1).206
Abstract
We investigate whether visitors’ preferences for recreation and conservation could be reconciled by identifying management tradeoffs. We use a choice experiment based on a random sampling, and conducted face-to-face interviews on site with 475 respondents. Improving biodiversity emerged as the action with most likely effect of increasing the welfare of visitors. The reduction in recreational areas, the removal of restrictions on recreational activities and, more surprisingly, the reduction in the expected number of visits appear to be the factors reducing the most of the visitors’ welfare. Although the park in its current state is fairly appreciated, the welfare of visitors can be significantly improved by appropriately combining the biodiversity conservation with an increase in the number of recreational areas, as well applying restrictions on certain activities with a significant but not excessive attendance.
Keywords: Biodiversity management; Choice modelling; Recreational restrictions; Urban forest; Developing countries
Highlights
o The article provides elements for enlightening trade-offs between conservation and recreation
o A choice modelling method for analyzing the tradeoffs between different attributes of a protected area
o We study the preferences of visitors for an urban forest on the outskirts of a large African city
o The welfare of visitors appears particularly sensitive to the conservation of biodiversity.
Introduction
The support for public decision-making is among the first motivations for performing economic evaluations. However, the valuation of ecosystem services appears to be of limited use for guiding the public policies [1]. The analysis of trade-offs between ecosystem services bundles appears to be a more relevant way to derive recommendations for ecosystem management [2]. In this perspective, we used a choice modelling which, to some extent, allows combining the benefits of evaluation with a more comprehensive approach of the diversity of services provided by ecosystems.
The presence of natural assets (parks and forests) and their components (water, trees, more or less diverse ecosystems) in an urban environment has been recognized as a contribution to the improvement of the quality of life with an influence on residential choices [3-5]. The management of urban parks has been shown to be of real importance for the sustainability of large cities [6-8]. It is widely recognized that urban parks and green spaces have strategic importance in the life of the inhabitants of large cities [8]. The issue is crucial for expanding cities whose population increases at a high rate as it is the case in developing countries.
Among the many services that people derive from ecosystems, outdoor recreation is certainly one of the most studied aspects. This can be explained by the fact that recreation is a service clearly identified by users for which they can easily be surveyed and express meaningful preferences. Urban and suburban forests are increasingly involved in recreational activities and the type of layouts probably affects the visitors’ preferences for these recreation areas [9-12]. The management plans may result in an intensive use of forests and may generate unfavorable habitats for certain species. However, there is a strong demand for preserved areas for conservation purpose [12,13]. A better knowledge of users’ preferences appears to be really useful for designing and providing adequate management solutions [4,14,15].
Outdoor recreation is considered the main pressure on biodiversity in many protected areas and the main factor threatening species [16-18]. Outdoor recreation and biodiversity conservation thus appear as competing goals, often pursued by distinct actors [19]. The question addressed here relates to the integration of these two objectives with the priorities and pattern in the management of an urban park. It consists of integrating the socio-economic goals of nature-based tourism with the ecological goals of conservation for sustainable development [16,20].
In this paper, we analyze several tradeoffs related to a park in the urban area of Ouagadougou, the capital of Burkina Faso: the urban Park Bãngr-weoogo. The old protected forest from the former “Mossi” kingdom (the largest ethnic group in the country), confirmed by the colonial administration, was recently reassigned to the city government that transformed it into an urban park, opened to the public for recreation purposes. The park is facing a rapidly growing frequentation: the number of visits rose from some 30,000 in 2002 to more than 300,000 in 2013. A stronger protection of existing ecosystems and species, and an improvement of recreational facilities are among possible options. But it is unclear to precise which one will have the most beneficial impact on the visitors’ welfare and what the preferred management pattern for the park is.
We address these tradeoffs by evaluating the changes in the visitors’ well-being, using a choice experiment method. We test for a series of improvements in the park’s recreational facilities and for operational management attributes, in the line of [21], and for recreational restrictions as in Juutinen et al. [22]. In a more original perspective, these options are analyzed in a developing country where environmental issues are often considered to be a low priority [23], and they concern an urban park, with a strong historical background on conservation (the first occurrence in the literature to our knowledge).
The choice experiment approach allows the users of the park to express their preferences related to various attributes. While the travel costs method is generally considered more robust to evaluate recreation than those based on stated preferences [24-26], the choice experiment techniques allow studying management with more precise options and, to some extent, to compare them. Sometimes described as the “holy grail” of valuation methods [27,28], choice experiment allows to highlight the trade-offs between many attributes, especially when it comes to management policy including heterogeneous aspects of spatial organization.
In this perspective, we carried out a choice modeling by asking the visitors of the peri-urban forest of Bãngr-weoogo to prioritize situations reflecting different trade-offs between the main attributes of conservation objectives and forms of recreational use (areas set up for recreation and recreational restrictions). We considered that, with subjects to presenting realistic alternatives to the current situation of the park, the visitors had the capacity to represent the changes implied by the variations of the attributes and to express meaningful preferences between them. Thus, we aimed at identifying practical trade-offs between recreational facilities development, biodiversity protection and interaction effects between these attributes. Economic valuation can help enlightening these tradeoffs and their implementation. Since the matter is to discriminate among management options, the choice experiment technique seems to be appropriate and was therefore implemented.
The paper is organized as follows. In section 2 we present the materials and methods by describing the choice experiment design, the survey carried out in Bãngr-weoogo and data. In section 3, we present the results, which are discussed in section 4. The conclusion summarizes the main findings and provides some comments and perspectives in section 5.
Materials and Methods
Study area
Ouagadougou, the capital city and main economic center of Burkina Faso, is the largest city in the country. With a population of over 2.2 million (as of 2015), the city is rapidly growing. The Bãngrweoogo urban park is a natural forest dedicated to recreational and educational uses. A former sacred forest belonging, before the colonization, to the Mosse chiefs, it was classified in 1936 by the colonial forest administration (Decree No. 2376/SE), regardless of its local significance and history. Formerly located on the outskirts of the city, it is now coined in the urban area. In January 2001, as part of the decentralization process, this classified forest was reassigned to the city of Ouagadougou, with an impossibility of alternative use of the site, by the Ministry of Environment and Water, which renamed it “Bãngr-weoogo” (“forest of knowledge” in Mossi language).
The overall objectives were, on the one hand, to minimize the consequences of a possible problem on the Ouagadougou dams upstream the park and, on the other hand, to create a “green lung” in the growing city of Ouagadougou. A walkway path and relaxation areas were developed, but the site is also open to environmental education for schools, universities, researchers and visitors. It is also a place where management experiments are conducted on restoration and protection of biodiversity, including the fight against desertification. The park covers a total area of two hundred and sixty-five (265) hectares from which two hundred and forty (240) are equipped, and it plays an increasingly important role for several purposes such as environmental education, research, medicinal plants and ecological services such as carbon dioxide storage [29].
Concerning the preservation of biodiversity and specific plant species, the park has 11 plant groups, and 7 of them are woody species (Acacia macrostahya, Balanites aegyptiaca, Albizia chevalieri, Terminalia avicennioides, Holarrhena floribunda, Mimosa pigra, Mitragyna inermis) with an abundance varying according to the groups. Mimosa pigrapar, for example, contains only 3 plant species per survey.
The park hosts several ecological formations where trees, woodland and bushland dominate, and also forest galleries along the river and some wetland [30]. It is like an oasis in a desert due to the loss of vegetation cover around housing and the importance of its biodiversity: it is home to more than 1000 plant species. It also shelters 60 animal families and 225 species of birds some of which such as hyenas, antelopes, hartebeest, waterbuck, and vultures are protected. The use of this area, organized in educational units (zoo, nurseries, botanical gardens, museums), relaxation, leisure and business units are now well-known from the local population. However, this area in an urban district is subject to many different land use pressures due to the increase of urbanization and to mismanagement related to the importance of its frequentation. Indeed, the fauna and flora are the victim of numerous attacks such as logging, bush fires, the presence of plastic waste on the ground and the current flow of motorized vehicles endangering not only animals but also users’ lives.
Survey design and data
We conducted interviews with the stakeholders (the urban park manager, five members of organizations that are working with the park and three visitors of the park chosen randomly) to identify the park characteristics and develop the questionnaire. These people were identified for a focus group.
The focus group took place in March 2013 within the park with the stakeholders mentioned above. We had a preliminary idea on our research question but we had to make sure not only that the biodiversity assessment was relevant, but also that we had an idea of the interesting aspects of recreation to take into account.
The group has good knowledge about the park (either by working there or simply through an interest). Also, general questions such as the importance of the park and its location in the middle of the city were raised.
We succeeded in identifying our attributes, defining them and breaking them down into levels in order to complete the questionnaire.
The resulting questionnaire consisted of four sections (the questionnaire is available on request from the authors). The first part contained questions related to the environmental attitudes of the respondents (through 7 questions). The second and most important part presents the “choice experiment” method. This section provides information about the Bãngr-weoogo Park, and the choice sets related to alternative management solutions. It describes the five attributes of the choice experiment (biodiversity level, expected number of visits, number of relaxing areas, recreational restrictions, and entrance fees). The number of attributes included in a choice experiment has to be limited in order to minimize cognitive demands made on respondents, as well as for statistical reasons [28]. Indeed, according to Louviere et al. [31], when the number of attributes included in the choice experiment increases, the choices of the respondents are less consistent. The third part addresses some questions related to the motivations for visiting the park and activities; and the last section collects respondents’ socio-demographic characteristics (through 13 questions).
Bãngr-weoogo Park hosts biodiversity exceptionally rich for an urban park, and recreational activities can obviously impact it negatively. The numerous existing definitions for biodiversity make its assessment much more complex [32,33]. Therefore, the definition should be done in an intelligible manner for respondents, through the focus groups, we retained four (4) attributes for the description of biological diversity: the known species, the rare or endangered species not yet known, the protection of habitats and species, and ecosystems process [33]. Pearce showed that only a minority of people gives a particular value to biological resources like species, habitat or ecosystem services. In order to better define and present the biodiversity attribute, we examined studies that used biodiversity attribute [34]. Horne et al. and Birol et al. defined it as the numbers of species and populations within those species [15,35]. Carlsson et al. defined it as the number of rare or endangered species [36,37,22]. For Hanley et al. the type of plants is of particular importance [26].
Given the finding of Christie et al. with an additional literature review of options the question concern the attribute that should be retained to represent biological diversity.
We could have defined the concept of biodiversity through rare or iconic species such as Christie et al. [33]. But the most important species for conservation are not always known to the citizens, or they can on the contrary be so present in their lives that it is difficult for them to appraise their dependence. These two reasons tend to make it difficult to evaluate by questionnaire, and these effects inevitably influence the results. In addition, we were unable to identify iconic species (through the focus group) that could motivate the ecosystem protection. The most intelligible indicator of a loss of biological diversity due to outdoor recreation and tourism is the reduction of the number of species and/or of populations within those species [38-39]. Thus, we have chosen, as an attribute for biodiversity, the expected number of species of plants and animals, and populations in these species over the next 5 years.
The number of visits to Bãngr-weoogo is currently estimated by the managers of the park around 300,000 per year. It is important to notice that this number on certain periods of the year depending on the number of visits (between February and June). The increasing visits number can make the park crowded, with more disturbances and other negative impact (more garbage and erosion of nature, the decreasing of wilderness feeling). On the other hand, it can be pleasant to meet other people in the park, and this has the advantage of strengthening the feeling of safety. Relaxing area is one of the most important recreation facilities of urban parks. The increase in the number of visits creates crowding which could be reduced by developing more of such areas. The threats related to the increase of these spaces are the loss of species and the fear of the wilderness decrease. As noted above, recreational activities may represent a threat to biodiversity. One way to limit their negative impact is to implement adequate restrictions. Currently, in Bãngr-weoogo, cycling and levies are allowed. Obviously, management and development of the park entail costs, and visitors are currently paying an entrance fee of 100 Fcfa1/visit.
The discussions within the focus group resulted in a definition of the meaningful variations of the attributes shown in Table 1.

Stable*


Increase at 10%
 2. Expected number of visitsDecrease 250,000
Stable* 300,000
Increase 350,0003. Relaxing areas0
1*
24. Recreational restrictionsWithout restriction (cycling, motorized vehicles, levies, bird hunting and no forbidden zone access)


Current situation* (cycling and levies)
Total restriction (no cycling, no motorized vehicles, no levies, no bird hunting)5. Entrance fees (Fcfa)0; 100*; 200; 300; 400; 500
Table 1: Attributes and attribute levels.
According to the number of attributes and the levels they can take, 486 profiles (3 * 3 * 3 * 3 * 6=486) were possible. To present profiles to the respondents in the questionnaire, we applied an efficient design protocol, using Ngene 1.1.2. Ngene has a great flexibility and allows generating designs with any amount of choice situations, alternatives, attributes and attributes’ levels, and blocks while maintaining attributes level balance. The problem with this design is that it requires beforehand parameters and the purpose of the assessment is the estimation of these parameters [40]. Thus, we started a pilot survey with orthogonal design (which is without beforehand parameters) that allowed us to get first estimates of the parameters in order to create an efficient design. This first procedure resulted in 18 choice sets that we considered too large for respondents. Thus we set up the final 3 blocks of 6 choice sets (see an example of choice set in Table 2). Each respondent is faced with one of these three blocks, and has finally six choice sets; each choice containing two alternative parks and the current situation (status quo).
Expected number of visits250,000350,000300,000Relaxing areas201Recreational restrictions Entrance fee500200100I prefer…(Please select one only)ooo
Table 2: Example of choice set.
We conducted a questionnaire survey on visitors in order to obtain operational results for park management. The survey was conducted on-site, in different places of the Bãngr-weoogo Park, for three weeks in June 2013 with a random sampling so that all individuals (over 15 years) who come past the survey point were asked for their willingness to take part in the survey as they arrive. We used face-to-face interviews, during weekdays as well as weekends at different opening hours. The total number of respondents was 500. This number appears comparable to what is generally found in similar studies. The park is still visited by students and the characteristic that may change is the number of visits. Given these informations, we do not think that our data are out of date.
Models
Morey and Hanley et al. showed that the value of leisure depends not only on its price (i.e. the consumer income), but also on its quality [41,42]. The theory of the characteristic value of Lancaster states that the value provided by a product can be decomposed into the sum of the value of its features taken separately Adamowicz et al. [43,44].
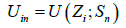
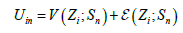
Ui is the utility provided by alternative i to individual n, i ϵ C the set of alternatives, Zi, the attributes of i and Sn socio-demographic characteristics of n.
This theory was combined with the theory of random utility of Thurstone that states that it is not possible to identify all factors influencing preferences [45,46]. The utility can thus be separated into a deterministic term (Vin) which depends on the preferences, and the described effect on the alternative level, and a stochastic term (εin)that takes into account the unobserved determinants [47].
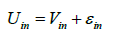
The utility provided by i can thus be written:
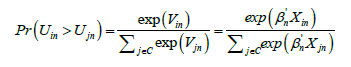
The probability that an individual chooses the option i instead of j other options is given by:

Data from the survey were analyzed using conditional logit (CL) and mixed logit (ML) also called Random Parameter Logit (RPL). The CL is the model used for the analysis of data from the choice experiment [35]. It considers that all preferences are homogenous and assumes that the error term follows a Gumbel distribution and is independently and identically distributed (IID). This law respects the assumption of independence of irrelevant alternatives (IIA) which is compulsory in the random utility theory [26].
The probability that the individual chooses option i instead of j others is given by:
The latent class model is an alternative to CL that takes into account respondents’ preferences heterogeneity. According to some authors, latent class logit underestimates the degree of heterogeneity and the mixed logit (ML) model developed by McFadden and Train is increasingly used to take into account preferences’ heterogeneity in discrete choice models. It solves the problem of IIA [48,49]. In the RPL model, utility is given by the formula:
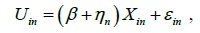
with ηn the standard deviation of the nth person compared to the average.
The probability that an individual chooses the option i rather than the option j is given by:
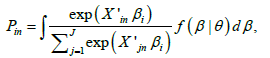
with f (β |θ ) the distribution function of β.
The evaluation of visitors’ preferences for different levels of attributes through the marginal WTP is defined by:
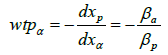
with βα the parameter on the attribute α and βp the parameter on entrance fees
With the effect coding data, the marginal WTP for the attributes level of the basic alternative option can be calculated from the two WTP of the attribute in question as a negative sum of these two values (see Juutinen et al.) [22]:
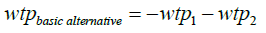
With wtp1, the WTP related to the reduction of the current level of the attribute, and wtp2, the WTP related to the increase of the current level of the attribute.
Results
In this section, we present successively the profile of the respondents, the results of the economic estimates and analyze the preferences of the visitors.
Respondents’ characteristics
We surveyed 500 visitors and among them, 174 respondents consistently chose to maintain the current situation. 25 respondents were removed from treatment. This choice was made according to the follow-up question that asked respondents to give the reasons of this choice. We selected the 149 questionnaires from the visitors who explained their choice by the fact that the current situation is really suitable for them, or that alternatives do not suit them. As for the 25 questionnaires that were removed, the reasons cited by respondents were that it was not their responsibility to pay for the park, or it was not their concern to decide how the park should be managed. These were considered protest responses.
The data base finally includes 475 respondents. Among them, there are almost as many men as women, most of whom were nationals. 56% of respondents had a high education level and 40% a secondary level of education. Only 0.2% of them were illiterate. This distribution is quite different of that of the general population of Burkina Faso, but the park is located in the heart of the capital, not far from universities. Regarding employment status, 78% of respondents were students or new graduated, followed by professionals (nurses, teachers…) who represented 8% of the sample, and 2% were unemployed. The average age was 24 years, with a maximum of 60. In order not to compel the respondents to directly reveal their income, which can be difficult, they were proposed to place themselves in class.
Regarding the main activity in the park, 37% of respondents have come to picnic, 29% to study, 27% scenery and relaxation. Sporting activities include 4.84% of respondents and come last. The sample can be considered representative of the general park attendance: the questionnaire was addressed randomly across the park and at different opening hours, in working days and weekends. The high number of students reflects the fact that the park is situated not far from the university in the Zogona Distict mentioned on the map (Figure 1).

Figure 1: Bãngr-weoogo urban park location in Ouagadougou.
Estimation
In this section, we discuss the direction of change without addressing the magnitude of the coefficients. The following section addresses the central point of the paper: the assessment of preferences through the marginal willingness to pay (WTP).
It should be kept in mind that the conditional logit described above considers visitors’ preferences as homogeneous and thus gives estimates on average. All parameters from this model are significant at 1% risk level, except the variable “total restriction” which is significant at 5% risk level. We used effect-coding data so that the alternative specific constant (ASC) which is significant and negative, reflects the utility associated to the basic choice option per se, i.e. the factor not described by our attributes (see Bech and Gyrd-Hansen) [50]. This shows that the status quo for all other attributes (attributes that are not considered in this study) is preferred on average.
Still considering the CL model, decreasing the biodiversity level, the number of relaxing areas and the number of visits reduce the probability of choosing an option and vice versa due to the negative sign associated to their estimator. Suppression of recreational restrictions reduces this probability too. As expected, the higher the entrance fee, the less respondents choose an alternative option.
Note that mixed logit analyses visitors’ preferences on average and also allows capturing preferences’ heterogeneity. All parameters from this model are significant at 1% risk level, except the variable “total restriction” that is not significant. We also used effect-coding data so that the alternative specific constant (ASC) which is also significant and negative, reflects the utility associated to the basic choice option per se, i.e. the factor not described by our attributes [50]. This shows that the status quo for all other attributes (attributes that are not considered in this study) is preferred on average. Estimates from this model are close to those of the conditional logit; they have the same signs. It also confirms that visitors’ preferences are heterogeneous. In this model, a variable is treated “random” if its standard deviation coefficient is significant at 10% risk level and the variables Biodiv+, Numvisitor— and Numvisitor+ are not randomly distributed, as shown in the Table 3. On average, visitors expressed a positive appreciation for the other attributes of the current park regardless of the studied attributes. This is not the case for 19%2 of them according to the ASC. Table 4 allows to calculate the WTP for all attribute levels and to analyze variations in visitors’ welfare.
Non-literate
Literate people
Islamic school
Primary school
Secondary school
University 0.21
2.53
0.42
0.21
40.63
56 Occupation
Unemployed
Student and students
Liberal professions
Intermediate professions
Executives
2.32
78.74
6.10
8.21
4.21 Main reason for visit
Sport
Landscape/relaxation
Education/study outing
Picnic lunch
Others 4.84
26.95
28.84
37.26
2.10
Table 3: Respondents’ characteristics.
LL : -2177,15Random parameter logit model
LL : -2011,05 Coeff.p-valueCoeff.p-valueCoeff. Std.p-valueASC-0.42250.000-0.53770.000 0.66560.000Biodiv--0.44760.000-0.63050.000-0.35330.000Biodiv+0.34550.000 0.49400.000-0.07940.679Numvisitor--0.14710.010-0.19440.010-0.20920.128Numvisitor+0.16040.004 0.22060.002 0.75450.634Area--0.39480.000-0.51120.000 0.32130.007Area + 0.17250.000 0.26030.000-0.34400.005Restriction--0.49630.000-0.85180.000 0.78070.000Restriction + 0.09110.089 0.12650.147 0.78870.000Payment-0.000560.010-0.000680.009--
Table 4: Results of the conditional logit and random parameter logit models.
Welfare analysis
Table 4 allows the assessment of visitors’ preferences for different levels of attributes through the marginal WTP reported in the Table 5. The attribute for which the welfare improves significantly, is the increase of the biodiversity level. In addition, the increase of the number of visits has a significant and positive effect on welfare compared to its current level. Moreover, the attribute which significantly reduces the welfare is the removal of recreational restrictions followed by the decrease in the level of biodiversity. In order to analyze the visitors’ welfare, we calculated their WTP for each attributes level and proposed three management scenarios (the basic, the best and the worst) given our results. Therefore, according to the basic scenario, the WTP for the current park is 2,020 Fcfa (about 3 Euros). Note that this value is not the total value of the park. It has to be interpreted as an entrance fee. Some components of the total value, such as option value or non-use values, are ignored in calculation [21]. The aim of this study is not to assess the total value of this park but capture and analyze the trade-offs between certain characteristics of the park for management purpose.
CL RPLBasic alternativeBest scenarioWorst scenarioASC-749.96-790.16749.96749.96749.96Biodiv--794.46-926.45 -794.46Biodiv181.26200.57181.26 Biodiv+613.20725.88 613.20 Numvisitor--261.12-285.69 -261.12Numvisitor-23.61-38.50-23.61 Numvisitor+284.73324.19 284.73 Area--700.76-751.20 -700.76Area394.56368.69394.56394.56 Area +306.20382.51 Restriction--880.75-1251.67 -880.75Current restriction718.991065.75718.99718.99 Restriction +161.76185.92 Total welfare 2021.162761.48-1887.13
Table 5: Willingness to pay (WTP) estimates and the welfare of selected scenarios of park management from CL.
Although the current park is evaluated positively, visitors are willing to pay more for several improvements such as improving the level of biodiversity or increasing the expected number of visits. In quantitative terms, they are willing to pay about 2,760 Fcfa (4.2 Euros) that is 740 Fcfa more (about 1.2 Euros) than for the current level. Reciprocally, actions that tend to reduce the level of biodiversity and/or to remove recreational restrictions are not encouraged.
Focusing on the group-specific results of respondents through conditional logit (Table 6), we calculated the average WTP for each group based on respondent’s characteristics and their reported number of visits per year and their main activities in the park. The results indicate that there are no significant differences between the groups since all the WTP have the same sign. According to the ASC, women value the other characteristics of the park more than men. Also, they are indifferent to the increase in the number of resting places and number of visits. There is also no significant difference between the group of individuals who have more than the group average (age>24) and the others. The only notable difference is that the younger ones prefer an increase in the number of visits while the older ones are indifferent. While the visitors with a larger number of visits (number>16 visits/ year) do not care about the increase of the number of visits, those with smaller number of visits are willing to pay for it.
Of resp.ASCBio+Bio-Aire+Aire-Visit+Visit-Rest+Rest—GenderMen247-760.10686.75-913.27418.66-818.87374.56-279.81 -721.64Women228-723.94534.62-678.76 -568.77 -239.28407.12-1019.4Age>24154-443.88828.22-1203.47338.94-490.93 -322.24 -1077.41≤24327-913.30501.34-559.02297.46-816.97343.83-225.46 -766.28Number of visitsVisit≥16/year152-345.66512.86-633.36255.06-624.21 -249.29246.12-954.39Visits<16/year323-1037.99631.34-868.51306.37-713.17438.43 -794.25Recreation activityWalking and landscape 153-564.36745.18-1080.96414.65-503.97 -913.45Picnic168-2204.86788.24-941.34492.88-2016.73984.34 -1243.17studies178-397.04452.41-532.99 -432.39 -328.98229.68-789.76
Table 6: Number of respondents, average WTP by respondents’ characteristics and activity.
Finally, considering the main activities in the park (Table 6), visitors who come for studying purposes, do not state preferences for an increase in the number of resting place and visits. Those who come for picnics are not sensitive to the price. Otherwise, all parameters have the same sign with the other groups (those who come for studying, or walking and scenery).
Discussion
In its present state, Bãngr-weoogo is valued positively by the visitors and the park is considered to be currently well managed. This result was rather expected since the survey was targeted at visitors and, for 89% of them, the park is considered either important or very important. Although visitors appreciate the park as it is, this does not exclude positive WTP for certain improvements. However, we note a low heterogeneity of preferences between the visitors of the park according to the mixed logit model.
The most notable result is that visitors are willing to pay for an increase in the level of biodiversity compared to the current situation. Indeed, visitors are sensitive to the level of biodiversity which appears to be the most likely attribute to improve their well-being if it increases by 10% over the next 5 years. The presence of animals in the wild such as hartebeest, waterbuck, and antelope may explain the preferences of visitors to biodiversity. 31% and 15% of visitors come respectively to the zoological park and the botanical garden, and 27% declare being attracted by the scenery. This suggests a tangible recognition of the importance of biodiversity. This result is consistent with previous studies Grünewald et al., Juutinen et al., Horne et al., Deng et al. [51,52,22,15]. Carlsson et al. in a study focusing on wetland management [36], Le et al. in a study focusing on a national park showed that local population welfare is greatly impacted by the biodiversity level [53]. How can the park manager do to increase or at least maintain the biodiversity level? With the agreement of a scientific board, the park manager could increase the share of trees and shrubs that contribute to human nutrition or are used in the traditional pharmacopoeia; as well as by introducing endangered species of the area. A few threatened animal species, or those with high attractiveness, but not dangerous for the human, could also be introduced.
Visitors’ preferences are almost homogenous for this characteristic. In fact, the degree of heterogeneity is null and 4% respectively for an increase and a decrease of the biodiversity level. This situation can be explained by the education level of the respondents (university for 56% and high school for 41%) and their attitude towards the environment. Indeed, 83% consider nature to be very important, while 40% think that its rate of degradation is very high. Furthermore, 67% of visitors regard the park as very important.
We must point out the lack of correlation between recreational restrictions and the level of biodiversity. Hunting affects only birds. Thus, choosing to remove restrictions on hunting is not directly inconsistent with an increase in the level of biodiversity that is primarily related to vegetation. Generally, visitors appear opposed to the removal of recreational restrictions. As stated by their WTP, they appear satisfied with the current level of restriction regardless of the model used. It is important to note here that the attribute that can significantly decrease the level of welfare is the removal of recreational restrictions. This suggests that the security and conservation concerns exceed the recreational needs, hence the need for a minimum of recreational restrictions. This remains consistent with what can be found in the literature Cetin and Sevik, Adamowicz et al. [54,44]. Since recreation and tourism are the main threats to species and exert pressure on biodiversity management of recreation (number of visits and restriction of activities) can be considered as a key to nature conservation in protected areas [38,18]. Regarding heterogeneity, 14% of visitors are in favor of the removal of recreational restrictions and this could be explained by the fact that some young people, who only focus on the recreational aspect of the park, have not integrated the interest of conservation.
An important feature is the expected number of visits in the park. A massive increase in the number of visits would create congestion and pressure on resources [55]. Visitors’ preference for this attribute is rather unexpected. Visitors’ welfare increases with the number of visits and decreases when it declines. This result appears divergent with the study of Juutinen et al. and that of Jin et al. [22,56]. This could be explained by the fact that congestion is part of a psychological sensation and visitors do not feel it currently. The pressure is also mitigated by the construction by the current manager of secondary tracks parallel to the old roads. It is equally important to note the interest in security, contact and pro-social behaviours expressed by some visitors (for most of them, it is important to visit the park with friends or relatives, and to meet people there). This result is consistent with the finding of Shoji and Yamaki concerning the reduction in the number of visitors by 50% [57]. The attractiveness of the park can be increased and visitors are in favor of an increase in the biodiversity level. Improving the biodiversity in the Park thus appears as the best way to increase visitors’ welfare since it is both a good strategy for conservation but also for the well-being of visitors.
Moreover, even if visitors prefer an increase in the number of areas of relaxation, when considering the mixed logit, the difference of WTP with the current level is insignificant. Thus, considering the conditional logit, they prefer on average the current level. In fact, they do not all pass through the recreation areas. The preference for the current situation can be explained by the fact that only 37% of visitors say they are there for a picnic and the availability of many other landscape units in the park. If needs increase, recreation areas can be created in less biodiversity areas and close to existing facilities, so as to stem nuisances and limit the negative impact of recreational activities Kangas et al. [58].
We also found that visitors’ preferences are not very heterogeneous according to group-specific WTP analysis (Table 6). Men and women have almost the same preferences; those with more than the average number of visits and those with fewer visits also. Note that there is no significant difference between those who are older than the mean of the visitors and other. The little difference that we can point out here, beyond the amplitude of the values, is the insensitivity to the price of visitors who come for a picnic. In fact, those who come for this activity generally go to the resting place and use electrical outlets and other facilities. For this, they pay in addition to the entrance fee a flat fee depending on the number of people in the group. This may explain their low sensitivity to entry fees.
Conclusion
Choice modelling can, to some extent, combine the benefits of evaluation with a more comprehensive approach of the diversity of services provided by ecosystems. Many studies have focused on natural protected areas in developed countries, and biodiversity has often been the main focus of many studies [59,60,22,35,21,15]. Through the use of choice modeling, we study the preferences of the visitors of Bãngr-weoogo for management options that involve several services related to this park. This study allowed us to identify the trade-offs between the park characteristics and different effects which can exist between several of them. Visitors’ WTP estimated by conditional logit and mixed logit has the same signs. The other characteristics of the park (according to ASC) are preferred at their current situation.
The most notable result is that visitors are willing to pay for an increase in the level of biodiversity, while the less expected results is the fact that visitors are valuing positively an increase in the number of visitors of the park and negatively the removal of current recreational restrictions. It is therefore possible to better understand the tradeoffs between improvements in biodiversity or recreation. While improving biodiversity receives a WTP of 613 Fcfa (0.93 Euros) with the CL model, 725 Fcfa (1.1 Euros) with the ML model, increasing relaxing area receives 382 (0.58 Euros) Fcfa (that is not really different from the WTP for the current level of relaxation areas), and visitors are opposed to the removal of recreational restrictions. Visitors’ preferences seem divided between ecological and recreational oriented management. These two options, a priori divergent, thus appear to be reconciled in our case study that concerns a city park in the context of a developing country.
This study shows that the improvement of the welfare of visitors requires an increase in the level of biodiversity which could at the same time increase the attractiveness and therefore the number of visits. The level of recreational restrictions could be maintained or increased but the development of any new resting area should be done in areas less rich in biodiversity potential and close to existing areas in order to preserve the conservation aspect that seems important for visitors. However, the concentration can create congestion and the solution may lie in a spatially differentiated management of the park that is large enough to make this approach credible. Finally, more communications on the importance and missions of the park would be necessary for the environmental awareness of visitors and citizens.
In order to compare these results with studies held in developed countries, we compared the part of the WTP in the GDP per capita. The WTP for increasing biodiversity level was worth 1.5‰ of the GDP per capita of Burkina Faso for 2013 (about 711 US$). Juutinen et al. in a similar study found a WTP of around 6 Euros for increasing the level of biodiversity in the Oulanka National Park in Finland [22]. It is consistent with what can be found in most studies and corresponds to 0.18‰ of the country GDP per capita in PPP in the same period. The finding that visitors to the Bãngr-weoogo urban park would be willing to pay a larger share of GDP/Capita than those in rich countries is rather unexpected, but should be subdued by the fact that household income in the urban area of Ouagadougou is significantly higher than the country average.
In short, we can summarize our recommendations and remarks with regard to the park manager:
• The park can be managed in the same way;
• The manager could increase the level of biodiversity with species that offer beautiful landscapes for example, which would attract many visitors and satisfy the preference for an increase in the number of visits;
• The same level of restriction can be maintained;
• The manager could create an additional relaxation area in less sensitive areas;
• He could improve its communication to attract more visitors by ensuring that the rules of biodiversity conservation are respected.
Furthermore, it is important to remember the hypothetical nature of this study, which focused on five (5) characteristics of the urban park; the others remaining fixed. It is also clear that individuals take into account other characteristics of Bãngr-weoogo such as information boards or distance to their residential location. Limiting the sample to visitors is certainly debatable but they know more about the park and they are more concerned with its possible development.
1Fcfa: currency of francophone community of Africa (1 euro=655.957 Fcfa)
2The value of 19% is calculated as φ [- (mean parameter estimate/the random parameter standard deviation)] where φ[χ] is the cumulative standard normal distribution.
References
- Laurans Y, Rankovic A, Billé R, Pirard R, Mermet L (2013) Use of ecosystem services economic valuation for decision making: Questioning a literature blindspot. J Environ Manage 119 : 208-219.
- Raudsepp-Hearne C, Peterson GD, Bennett EM (2010) Ecosystem service bundles for analyzing tradeoffs in diverse landscapes. Proc Natl Acad Sci 107 : 5242-5247.
- Traoré S (2019) Residential location choice in a developing country: what matters? A choice experiment application in Burkina Faso. For policy Econ Nd.
- Tu G, Abildtrup J, Garcia S (2016) Preferences for urban green spaces and peri-urban forests: An analysis of stated residential choices. Landsc Urban Plan 148 : 120-131.
- Bolund P, Hunhammar S (1999) Ecosystem services in urban areas. Ecol Econ 29 : 293-301.
- Elmqvist T, Setälä H, Handel SN, Van Der Ploeg S, Aronson J, et al. (2015) Benefits of restoring ecosystem services in urban areas. Curr Opin Environ Sustain 14 : 101-108.
- Brander LM, Koetse MJ (2011) The value of urban open space: Meta-analyses of contingent valuation and hedonic pricing results. J Environ Manage 92 : 2763-2773.
- Chiesura A (2004) The role of urban parks for the sustainable city. Landsc Urban Plan 68 : 129-138.
- Lupp G, Förster B, Kantelberg V, Markmann T, Naumann J, et al. (2016) Assessing the recreation value of urban woodland using the ecosystem service approach in two forests in the Munich Metropolitan Region. Sustainability 8 : 1156.
- Cole DN (1996) Wilderness recreation in the United States-trends in use, users, and impacts. Int J Wilderness 2 : 14-18.
- Endreny T, Santagata R, Perna A, De Stefano C, Rallo RF, et al. (2017) Implementing and managing urban forests: A much needed conservation strategy to increase ecosystem services and urban wellbeing. Ecol Model 360 : 328-335.
- Tyrväinen L, Silvennoinen H, Kolehmainen O (2003) Ecological and aesthetic values in urban forest management. Urban For Urbain Green 1: 135-149.
- Sanesi G, Colangelo G, Lafortezza R, Calvo E, Davies C (2017) Urban green infrastructure and urban forests: a case study of the Metropolitan Area of Milan. Landsc Res 42 : 164-175.
- Aasetre J, Gundersen V, Vistad OI, Holtrop EJ (2016) Recreational preferences along a naturalness-development continuum: Results from surveys in two unequal urban forests in Europe. J Outdoor Recreat Tour 16 : 58-68.
- Horne P, Boxall PC, Adamowicz WL (2005) Multiple-use management of forest recreation sites: a spatially explicit choice experiment. For Ecol Manage 207 : 189-199.
- Pouwels R, Sierdsema H, Henkens RJHG, van Eupen M (2017) Harmonizing outdoor recreation and bird conservation targets in protected areas: Applying available monitoring data to facilitate collaborative management at the regional scale. J Environ Manage 198 : 248-255.
- Balfors B, Mörtberg U, Gontier M, Brokking P (2005) Impacts of region-wide urban development on biodiversity in strategic environmental assessment. J Environ Assess Policy Manag 7 : 229–246.
- Cole DN, Landres PB (1996) Threats to wilderness ecosystems: impacts and research needs. Ecol Appl 6 : 168-184.
- Sikorska D, Sikorski P, Hopkins RJ (2017) High biodiversity of green infrastructure does not contribute to recreational ecosystem services. Sustainability 9 : 334.
- Puhakka R (2008) Increasing role of tourism in Finnish national parks. Fenn J Geogr 186 : 47-58.
- Christie M, Hanley N, Hynes S (2007) Valuing enhancements to forest recreation using choice experiment and contingent behaviour methods. J For Econ 13 : 75-102.
- Juutinen A, Mitani Y, Mäntymaa E, Shoji Y, Siikamäki P, et al. (2011) Combining ecological and recreational aspects in national park management: A choice experiment application. Ecol Econ 70 : 1231-1239.
- Martinez-Alier J (2003) The environmentalism of the poor: A study of ecological conflicts and valuation. Edward Elgar Publishing, UK.
- Parsons GR (2003) The travel cost model In: A primer on nonmarket valuation. Springer 269-329.
- Shrestha RK, Seidl AF, Moraes, AS (2002) Value of recreational fishing in the Brazilian Pantanal: a travel cost analysis using count data models. Ecol Econ 42 : 289-299.
- Hanley N, Wright RE, Adamowicz V (1998) Using choice experiments to value the environment. Environ Resour Econ 11 : 413-428.
- Carson RT, Czajkowski M (2012) The discrete choice experiment approach to environmental contingent valuation, Handbook of choice modelling, Edward Elgar Publishing, USA.
- Bennett J, Blamey R (2001) The choice modelling approach to environmental valuation. Edward Elgar Publishing, USA.
- Gnoumou A, Thiomboano A, Hahn-Hadjali K, Abadouabou B, Sarr M, et al. (2008) Le Parc Urbain Bangr-Wéoogo : une aire de conservation de la diversité floristique au coeur de la ville de Ouagadougou, Burkina Faso. Flora Veg Sudano-Sambesica 11 : 35-48.
- Dana D (1990) Contribution à l’étude des Combretaceae de la forêt classée du barrage. Mémoire DEA. Univ Ouagadougou, Burkina Faso.
- Louviere JJ, Street D, Burgess L, Wasi N, Islam T, et al. (2008) Modeling the choices of individual decision-makers by combining efficient choice experiment designs with extra preference information. J Choice Model 1 : 128-164.
- Bartkowski B, Lienhoop N, Hansjürgens B (2015) Capturing the complexity of biodiversity: A critical review of economic valuation studies of biological diversity. Ecol Econ 113 : 1-14.
- Christie M, Hanley N, Warren J, Murphy K, Wright R, et al. (2006) Valuing the diversity of biodiversity. Ecol Econ 58 : 304-317.
- Pearce DW (2001) The economic value of forest ecosystems. Ecosyst Heal 7 : 284-296.
- Birol E, Hanley N, Koundouri P, Kountouris Y (2009) Optimal management of wetlands: Quantifying trade-offs between flood risks, recreation, and biodiversity conservation. Water Resour Res 45 : 1-11.
- Carlsson F, Frykblom P, Liljenstolpe C (2003) Valuing wetland attributes: an application of choice experiments. Ecol Econ 47 : 95-103.
- Jacobsen JB, Boiesen JH, Thorsen BJ, Strange N (2008) What’s in a name? The use of quantitative measures versus ‘Iconised’ species when valuing biodiversity. Environ Resour Econ 39 : 247-263.
- Chape S, Spalding M, Jenkins M (2008) The world’s protected areas: status, values and prospects in the 21st century. Univ de Castilla La Mancha, Spain.
- Pickering CM, Hill W (2007) Impacts of recreation and tourism on plant biodiversity and vegetation in protected areas in Australia. J Environ Manage 85 : 791-800.
- Choice Metrics, 2012. Reference guide: The Cutting Edge in Experimental Design 255 p.
- Morey ER (1981) The demand for site-specific recreational activities: a characteristics approach. J Environ Econ Manage 8 : 345-371.
- Hanley N, Alvarez-Farizo B, Shaw WD (2003) Using economic instruments to manage access to rock-climbing sites in the Scottish Highlands. New Econ Outdoor Recreat, Edward Elgar Publishing, UK.
- Lancaster KJ (1966) A new approach to consumer theory. J Polit Econ 74 :132-157.
- Adamowicz W, Boxall P, Williams M, Louviere J (1998) Stated preference approaches for measuring passive use values: Choice experiments and contingent valuation. Am J Agric Econ 80 : 64-75.
- Thurstone LL (1927) A law of comparative judgment. Psychol Rev 34: 273-286.
- Baltas G, Doyle P (2001) Random utility models in marketing research : a survey. J Bus Res 51 : 115–125.
- Bonnieux F, Carpentier A (2007) Préférence pour le statu quo dans la méthode des programmes : illustration à partir d ’ un problème de gestion forestière. Rev Econ Polit 117 : 699-717.
- Allenby GM, Rossi PE (1998) Marketing models of consumer heterogeneity. J Econom 89 : 57-78.
- McFadden D, Train K (2000) Mixed MNL models for discrete response. J Appl Econom 15 : 447-470.
- Bech M, Gyrd-Hansen D (2005) Effects coding in discrete choice experiments. Health Econ 14 : 1079-1083.
- Grünewald C, Schleuning M, Böhning-Gaese K (2016) Biodiversity, scenery and infrastructure: Factors driving wildlife tourism in an African savannah national park. Biol Conserv 201 : 60-68.
- Deng J, King B, Bauer T (2002) Evaluating natural attractions for tourism. Ann Tour Res 29 : 422-438.
- Le THT, Lee DK, Kim YS, Lee Y (2016) Public preferences for biodiversity conservation in Vietnam’s Tam Dao National Park. Forest Sci Technol 12 : 144-152.
- Cetin M, Sevik H (2016) Evaluating the recreation potential of Ilgaz Mountain National Park in Turkey. Environ Monit Assess 188: 52.
- Clawson M, Knetsch JL(1969) Economics of outdoor recreation, In : Resources for the Future (edtn 2). Johns Hopkins Press, Baltimore, London, UK.
- Jin Q, Hu H, Kavan P (2016) Factors influencing perceived crowding of tourists and sustainable tourism destination management. Sustainability 8 : 976.
- Shoji Y, Yamaki K (2004) Visitor perceptions of the inscription on the world heritage list: the use of stated choice methods. Finnish Forest Research Institute, Finland.
- Kangas K, Sulkava P, Koivuniemi P, Tolvanen A, Siikamäki P (2007) What determines the area of impact around campsites? A case study in a Finnish national park. For Snow Landsc Res 81 : 139-150.
- Lanz B, Dietz S, Swanson T (2018) The expansion of modern agriculture and global biodiversity decline: An integrated assessment. Ecol Econ 144 : 260-277.
- Alvey AA (2006) Promoting and preserving biodiversity in the urban forest. Urban For Urban Green 5 : 195-201.