Spanish
  Chinese
  Russian
  German
  French
  Japanese
  Portuguese
  Hindi
Hindi Research Article, J Mar Biol Oceanogr Vol: 9 Issue: 2
Anchoveta (Engraulis ringens) Biomass in the Peruvian Marine Ecosystem Estimated by Various Hydroacoustic Methodologies during spring of 2019
Ramiro Castillo1*, Luis La Cruz Aparco1, Daniel Grados1, Rodolfo Cornejo1, Renato Guevara1 and Jorge Csirke2
1Instituto del Mar del Perú (IMARPE). Esq. Gamarra and General Valle s/n, Chucuito, Callao, Peru
2Independent Consultant, Fish Stock Assessment and Fisheries Management, Peru
*Corresponding Author : Ramiro Castillo
Instituto del Mar del Perú (IMARPE). Esq. Gamarra and General Valle s/n, Chucuito, Callao, Peru
E-mail: ramirocasti@gmail.com
Received: May 21, 2020 Accepted: June 03, 2020 Published: June 09, 2020
Citation: Castillo R, Aparco LLC, Grados D, Cornejo R, Guevara R, et al. (2020) Anchoveta (Engraulis ringens) Biomass in the Peruvian Marine Ecosystem Estimated by Various Hydroacoustic Methodologies during Spring of 2019. J Mar Biol Oceanogr 9:2.
Abstract
The Hydroacoustic Pelagic Resources Assessment survey (Cruise 1909-11) was conducted along the Peruvian coast (03°23'S-18°21'S) between 29 September and 15 November 2019 with the participation of three scientific research vessels from the Peruvian Marine Research Institute (Instituto del Mar del Peru, IMARPE), the R/V José Olaya Balandra, the R/V Flores Portugal and the R/V Humboldt. Using the acoustic data collected by the three scientific vessels we estimated the anchoveta biomass using seven hydroacoustic methodologies by applying the following three types of techniques in the processing and subsequent analysis of the eco-acoustic records for the frequencies of 120 and 38 kHz: stratification by isoparalitoral areas; stratification by transects; and by geostatistics. The three best anchoveta biomass estimates were 8.37 million tons obtained with the method of stratification by isoparalitoral areas using the 120 kHz acoustic frequency data; 8.47 million tons obtained with the transect stratification method using data from the 38 kHz frequency; and 8.22 million tons obtained with the geostatistical delta method using the 120 kHz frequency data with coefficients of variation of 5.44%, 13.71%, and 33.21%, respectively. Special attention was paid in the analyzes of the size distribution, in the length-weight relationship of the anchovy obtained in the survey 1909-11 and the use of the Target Strength (TS) equations, taking into account the great influence these may have on the population biomass estimates irrespective of the hydroacoustic technique being used. Based on the results obtained, we conclude that the anchoveta population in the Peruvian marine ecosystem is in an abundant and healthy state, although its abundance and in particular its distribution pattern may be affected by anomalous climatic events.
Keywords: Anchoveta NASC value; Anchoveta biomass; Stratification method; Geostatistical method; Total fish abundance
Introduction
The northern part of the Peru Current System (also known as Humboldt Current System) [1], produces more fish per unit area than any other region of the world's oceans, is influenced by an intense regional climatic variability at different spatio-temporal scales, and while representing only 0.1% of the global ocean’s surface, it contributes more than 15% of the global catches [2-6]. The Peruvian fishery is based mainly on the capture of anchoveta (Engraulis ringens). Furthermore, the anchoveta is one of the most important elements in the food chain and plays a key role in the Peruvian marine ecosystem. And, therefore, it is of great importance to guarantee the sustainability of its fishery through the application of fisheries management measures based on the best scientific information available, including those referring to its biomass and state of exploitation.
The management of the Peruvian fishery is conducted with norms and decrees issued by the Ministry of Production (Ministerio de la Producción, PRODUCE) according to the recommendations produced by the Peruvian Marine Research Institute (Instituto del Mar del Peru, IMARPE) [7]. To provide catch quota recommendations, IMARPE estimates the biomass of anchoveta (Engraulis ringens) for the north-central (03°23'-15°59'S) and southern (16°00'-18°02'S) regions following an internal protocol [8].
For the advice on the annual or seasonal total catch quota for the anchoveta fishery, IMARPE prepares possible exploitation scenarios defined by an acceptable range of fishing mortality rates and their corresponding exploitation rates that, when applied to the updated estimates of total biomass and abundance by size groups in the stock, give a range of possible catch quotas in the form of a Decision Table [8].
Biomass estimates for anchoveta are made by at least two different, complementary methods. One is the hydroacoustic method, which is a direct estimation method that tends to give better results during the summer when the resource is concentrated closer to the coast; and the other is an indirect analytical method of short-term population state projections, or Population Balance model [9-11]. This method can be applied at any time of the year but it is particularly useful when updating the biomass estimates during the spring season when the anchoveta tends to be more dispersed, and/or when there are major fluctuations in the environmental conditions and dynamics due to oceanographic anomalies. This, by causing changes in the behavior and a more extensive dispersion of anchoveta schools [8,12], may lead to increased variability in the biomass estimates with the hydroacoustic methods. This total catch quota is then assigned by individual quotas to the fishing vessels by PRODUCE, by the "Law on Maximum Catch Limits per Vessel" [13-15].
The marine environmental conditions off Peru between August and November 2019 were characterized by more or less noticeable variability and oceanographic anomalies. These anomalies were observed both during the 1908-09 Anchoveta Spawning Biomass Assessment survey (the code 1908-09 means that the survey was carried out in the year 2019 between August and September), as well as during the 1909-11 Hydroacoustic Assessment of Pelagic Resources survey. During this last survey, it was observed that the expanded amplitude of the cold coastal waters had caused a wide dispersion of the anchoveta schools, which due to their wide horizontal distribution were found reaching distances of well over 100 nm from the coast in some areas. Furthermore, various areas of high abundance of anchoveta pre-recruits were detected during this 1909-11 survey [16,17].
During the second part of the year in 2019, occurs several anomalies in the Peruvian ecosystem, arrival hot first, and cold kelvin waves [18,19], these Kelvin waves affected the behavior of anchoveta schools [20]. All these anomalies redistributed the anchoveta with abundant juveniles near the surface [21]. There is evidence that similar situations have occurred in the recent past when there have been noticeable increases in SST due to warm el Niño events or the arrival of warm Kelvin waves [22].
These changes in the environmental dynamics and in the distribution of the anchoveta that hindered the normal development of the second 2019 anchoveta fishing season caused some relevant actors in the Peruvian fishery sector to raise doubts about the anchoveta biomass estimates and the process for determining the catch quota made by IMARPE, which were mainly based on the results of the Population Balance method. It was therefore decided to expand this assessment through a detailed reanalysis of the eco-acoustic records collected during the spring season 1909-11 pelagic resources assessment survey applying a variety of hydroacoustic methodologies used in other parts of the world. The results of these new analyses to estimate the anchoveta biomass in the Peruvian marine ecosystem will strengthen the recent anchoveta biomass estimates and will reinforce the marine research carried out by IMARPE on this and other fishery resources within the framework of securing the sustainability of Peruvian fisheries with an ecosystem and food security approach.
Materials and Methods
Study area
Acoustic data of the anchoveta as target species were collected by the following three IMARPE research vessels participating in the 1909- 11 Hydroacoustic Assessment of Pelagic Resources survey along the Peruvian coast within latitudes 03°23'S and 18°21'S: R/V José Olaya Balandra, R/V Flores Portugal and R/V Humboldt. The Elemental Sampling Distance Unit (ESDU) was 1 nautical mile (nm). The data was collected by applying a systematic sampling strategy [23,24] where the three research vessels alternately completed a total of 113 parallel transects perpendicular to the coastline and with a separation of 10 nm between transects. They covered the coastal area of the Peruvian sea up to 80 nm from the coast with some transects that extended further out to a maximum distance of 116 nm from the coast (Figure 1 and Table 1).

Figure 1: Transects and fishing hauls made by each IMARPE research vessel during the 1909-11 survey
| Research Vessel | Transducer model | RMS (dB) | Gain (dB) | SA corrected (dB) | Transects made | Trawling hauls | Fishing hauls with anchovy presence | Number ESDU | ||||
| 120 kHz | 38 kHz | 120 kHz | 38 kHz | 120 kHz | 38 kHz | 120 kHz | 38 kHz | |||||
| Jose Olaya Balandra | ES120-7C | ES38-7 | 0.09 | 0.06 | 26.89 | 26.9 | 0.11 | -0.7 | 58 | 135 | 70 | 5875 |
| Flores Portugal | ES120-7C | ES38-10 | 0.16 | 0.14 | 27.5 | 26.73 | 0.18 | 0.1 | 28 | 62 | 34 | 2999 |
| Humboldt | ES120-7C | ES38B | 0.21 | 0.13 | 26.58 | 26.65 | -0.52 | -0.89 | 27 | 52 | 29 | 2568 |
| TOTAL | 113 | 249 | 133 | 11442 | ||||||||
Table 1: Values obtained in the acoustic calibrations of scientific echo sounders and acoustic samples carried out by IMARPE research vessels.
Pre-treatment of the acoustic data
The acoustic data were collected using the scientific echo sounders installed onboard the research vessels. The R/V José Olaya Balandra and the R/V Flores Portugal are equipped with echo sounders Simrad EK80, which operate with the frequencies of 18, 38, 70, 120 and 200 kHz; however, the R/V Humboldt is equipped with an echo sounder Simrad EK60 which operates at frequencies of 38, 120 and 200 kHz. The results of the acoustic calibrations performed according to the standard methodology [23,25] and other information from the samples taken are presented in Table 1.
The acoustic biomass assessment is based on the integration of the energy in the echoes (eco-integration) of the acoustic signal that is returned from the organisms found in the water column that is being sampled by the research vessel. Through echo sounders, sounds are transmitted at different wave frequencies in the water column (up to 500 m depth) and, simultaneously, the echo signals received from the organisms found in the water column are recorded to then proceed to quantify and interpret the reflectivity of the acoustic energy of the detected organisms. The relationship between transmitted energy and reflected energy is the Nautical Area-Scattering Coefficient (NASC), expressed in m2.nm-2 [23]. In total there was 11,442 nm sampled.
Identification of anchoveta eco-traces
The software EchoView was used to identify and discriminate by species the eco-traces of the detected organisms recorded during the survey. This was based on information on the composition by species, size, etc., of the catches made during verification fishing hauls; the type of eco-traces registered, and the results of the multifrequency analysis (fish school’s frequency response graphs) [21]. In areas with the presence of anchoveta, the value of the total integrated NASC in each ESDU is given by the sum of the NASC of each anchoveta school (NASC anch). The values for each ESDU were then used in the analyses presented in this paper.
The three research vessels made a total of 249 verification fishing hauls using pelagic trawls, which were distributed along the studied area (Figure 1 and Table 1). A total of 133 of these 249 fishing hauls were positive for anchoveta.
When processing the acoustic signals from the R/V José Olaya Balandra, the threshold to export the fish school signals in the frequency of 120 kHz was increased from -68 to -72 decibels (dB) to compensate for electrical noise and loss of energy (reduced acoustic sampling volume) that was observed in the multi-frequency analyzes of the graphs of the relative frequency response at 120 kHz, which was found to be caused by an intermittent ground drop of 196 volts AC (alternate current) by a faulty resistance in a water heater located in the pump room close to the location of the 120 kHz echo sounder transducer. The 38 kHz frequency transducer is more towards the bow and no signal alteration was detected in the 38 kHz frequency data echo sounder. The increase in the threshold for the export of the school signals in the 120 kHz frequency was made with the EchoView program, which made it possible to compensate for the noise generated at this frequency by the loss of the sampling volume. In this regard, consider that noise should be insignificant at all frequencies, measurements should not be biased by noise, and noise should not reduce the sampling volume.
Biological data
Information on the species composition of the catch was taken after each of the 249 verification trawls hauls made, and when there was the presence of anchoveta, which occurred in 133 of the 249 hauls, data on its size-frequency distribution and the length-weight relationship was collected in addition to taking biological samples for further analyses. The length-frequency distribution of the anchoveta, measured at half centimeter intervals, was obtained for each anchoveta positive haul, while three NASC anch integration values were estimated before and after each verification trawl haul.
Methods used for the Acoustic Estimation of the Anchoveta Biomass
The seven methods described below were applied to estimate the anchoveta biomass for this 1909-11 survey and the values of reflective characteristics (b20) for given fish lengths (L) and wavelength frequency used in the Target Strength (TS) equations used are described in Table 2.
| Specie | Size range (cm) | Average (cm) | Frecuency (kHz) | b20 | Reference |
|---|---|---|---|---|---|
| Anchoveta (Engraulis ringens) | 6.0-8.5 | 7.0 | 120 | -81.8 | [38] Gutierréz |
| 10.0-13.0 | 11.3 | -76.25 | [39] Gutiérrez and MacLennan | ||
| 12.0-17.0 (>13.0) | 15.1 | -77.5 | [40] MacLennan et al. | ||
| 5.5-10.5 | 6.5 | 38 | -81.2 | [41] Gutiérrez | |
| 10.0-16.0 | 12.8 | -78.9 | [39] Gutiérrez and MacLennan | ||
| 12.5-18.0 | 15.5 | -70.9 | [40] MacLennan et al. |
Table 2: Values used in the measurements of the Target Strength (TS) obtained in the acoustic calibrations of the scientific echo sounders and acoustic samples made by the IMARPE research vessels. The functional relationship of the TS to the fish length (L) is represented by the equation TS=20 log L+b20.
Method of stratification by isoparalitoral areas for the frequency of 120 kHz
This is the method that is regularly used at IMARPE. For its application, the study area, and the whole the Peruvian sea, is divided into what IMARPE calls "isoparalitoral areas", which are fixed parallelograms delimited vertically by the 30’ latitude lines (=30 mn intervals) and horizontally by isolines at 10 nm interval that is parallel to the coastline. Each parallelogram or isoparalitoral area is considered as a stratum, that is 10 nm wide and 30 nm high, which can contain parts of several transects with their respective samples or ESDU. This methodology is derived from the stratification by rectangles and assumes that the samples in each stratum come from a homogeneous distribution [24,26,27].
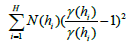
The mathematical formulation for each stratum is
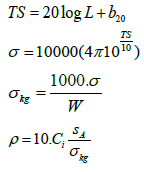
The total biomass is

And the Coefficient of Variation (CV) used in all methodologies is

Where
TS=Target Strength of the species for the frequency of 120 kHz
L=Length of the fish in centimeters
b20=Factor dependent on the reflective characteristics of the target expressed in decibels
σ=Acoustic backscatter cross-section
W=Weight of the species expressed in grams
σkg= Acoustic backscatter cross-section referred to kilogram
sA=NASC average value of the anchoveta for the frequency of 120 kHz
Ci=Instrumentation constant (in current echo sounders is automatically made equal to one)
Bi=biomass in the isoparalitoral stratum i, in tons
ρi=density in the isoparalitoral area i
Ai=Area of the isoparalitoral stratum i, in nm
B=Total biomass in tons
∂=Standard deviation of the sample; and
û=The sample mean
Delta-geostatistical method for the frequency of 120 kHz
This methodology has been used in the latest Hydroacoustic Pelagic Resources Assessment surveys conducted by IMARPE. This is an analytical technique that covers the mapping, interpolation, and estimation of the variance of a population-based on a set of observations of density at points within the studied area [23].
Due to the high proportion of zeros observed during the sampling, it is difficult to directly apply a geostatistical model, and that’s why a delta model is proposed for the spatial acoustic estimation. This is a two stepwise process with two models: first, a presence/absence model is estimated using a GAM model (Generalized Additive Model); and a geostatistical model with the positive anchoveta NASC data is then estimated. The final result is the product of these two models. For the geostatistical estimation, an empirical variogram is estimated, and then the theoretical variogram model is chosen [23,28]. The weighing by kriging of the sampled values is determined according to the spatial structure and the sampling configuration [29]. The mathematical formulation is
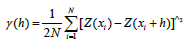
Where
γ (h)=Experimental semivariogram; and
N=Number of pairs of points separated by a distance h
The following two models, a spherical and an exponential model [29], are considered for the densities:
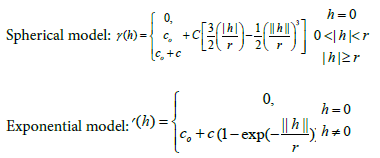
Where
co=Nugget effect that characterizes the microscale variability
c=Asymptotic value or sill of the variogram minus the nugget; and
r=Variogram range beyond which the data no longer correlate
The models were fitted to the experimental variogram data minimizing the summation according to the weighted least squares procedure [30], and a model is chosen to characterize the spatial structure of the anchoveta densities (theoretical variogram), where
A cross-validation of the parameters of the adjusted theoretical variogram and of the parameters to be used in the kriging interpolation [31] was performed, which were used to calculate the optimal weightings to be assigned to each sampling point and to estimate the density using
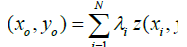
Where
N=Number of samples
λi=Weight attributed to sample xi
and

The N weights λi are calculated to ensure that the estimator is unbiased and that the estimation variance is minimal. Then
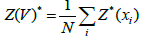
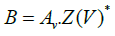
Where
Z(V)*=Mean anchoveta density obtained by kriging inside the polygon
Av=Area of the polygon in nm2; and
B=Anchoveta biomass in tons
Due consideration was given in the various models of the distribution families to the isotropic behavior of the anchoveta towards the coast due to the presence of cold coastal waters.
Method of stratification by isoparalitoral areas for the frequency of 38 kHz
This method is similar to the first one described in (1) above. The formulation is the same and the only changes are the NASC anch values and the parameters of the TS equation which instead use those that correspond to the frequency of 38 kHz.
Delta-geostatistical method for the frequency of 38 kHz
This method is similar to the second one, described in (2) above. The formulation is the same and the only changes are the NASC anch values and the parameters of the TS equation, by using those that correspond to the frequency of 38 kHz.
Geostatistical method using various distribution models for the frequency of 38 kHz
This is a method that explicitly includes spatial autocorrelation between ESDU or acoustic samples in the analysis, and is not affected by the amplitude statistics of the distribution of the NASC values [27].
The procedure is similar to that described in (2) above, except it does not consider presence/absence and that it incorporates four families of model distributions to adjust with the experimental variograms which allow the observed structure to be related to the supposed generating process. This variogram is performed in various directions to investigate the existence of directional differences in the structure of the process (i.e. anisotropy). These families of model distributions are matern [32], spherical, exponential, and the Gaussian model [30]. The spherical and exponential models were described with the method in (2) above, and the formulation of the other two models are described below. The best model is fitted with the experimental variogram.
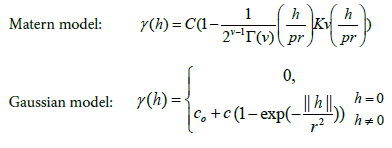
Where
Kv=Bessel function (for matern model); and
r=Variogram range beyond which the data no longer correlates
Method of stratification by transects for the frequency of 38 kHz
This is also referred to as the Jolly and Hampton method [33]. It only considers NASC data for transects and uses the full length-frequency distribution of the anchoveta in each verification fishing haul.
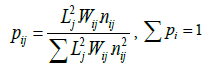
This anchoveta size structure is incorporated by calculating the proportions (p) per fishing haul (i) and size class (j) of fish length (L) obtained from the verification hauls made during the acoustic survey. The fish lengths (L), the number n of individuals per length, and the individual fish weights (W) are used as weighting factors in the following formula, where the length (L) is squared since the magnitude of the echoes is approximately related to the square of the length of the fish [23]
A Conversion Factor (CF) expressed in t.nm-2 is then calculated, which is defined as the quotient between the weight of the fish (W) and its corresponding backscatter cross-sectional area (σ) in m2, as:

Where
Wij=Weight as a function of length that can be obtained from the length (L)/weight (W) ratio or by direct measurement of the average weight by size class;
TS=Target strength of the anchoveta expressed in decibels; and
b20=Reflectivity of the anchoveta for the frequency of 38 kHz.
The density ρ expressed in t.nm-2 in transect k, acoustic sample ESDU l, fishing haul i and size class j(pkl) is calculated after obtaining a correction factor K expressed in t.m-2 for each fishing haul i and size class j, by
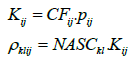
Where
NASCkl=Acoustic dispersion value of the anchoveta expressed in m2.nm-2 for transect k and ESDU l, measured by the echo sounder and discriminated by species
The biomass can be estimated for each ESDU. The biomass B in transect k and ESDU l is the sum of the densities ρ by size class j multiplied by the separation E between transects expressed in nm2, where
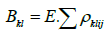
And the biomass in transect k is:

Method of stratification by transects using all the data for the frequency of 38 kHz
This is the same as the Jolly-Hampton method described by (6) above, except that the data from the inter-transects are also used. This includes the acoustic data and the anchoveta size-frequency distribution data from the short 10 nm parallel-to-the-coast tracks connecting each main transect, and when there was no verification fishing hauls along one of these short tracks, the size-frequency distributions of the verification fishing hauls carried close to the coast in the nearby transects were used for the coastal inter-transects.
Software
The analyzes were performed using the R version 3.5.1 program (R Project for Statistical Computing). The packages used were: EchoviewR, version 1.1.15; RGeostats, version 11.2.12, and jhF (Jolly- Hampton method). Besides, other programs such as Surfer and Excel were used.
Results
Exploratory analysis of the acoustic data
The anchoveta NASC values obtained from the 120 kHz and 38 kHz frequencies have almost the same pattern (shape and trend). The highest anchoveta NASC values of each ESDU distributed latitudinally were found at latitude 08°S for both frequencies, which indicates that the greatest abundance or biomass of anchoveta was in this latitude. This occurs because when anchoveta presented the same size structure, the NASC values are directly proportional to the biomass. However, when the size structure changes and various areas with varying concentrations of pre-recruits, recruits, juveniles and/ or adult anchoveta occur, as observed during the 1909-11 survey, different values need to be used in the Target Strength (TS) equation and the resulting biomass estimates may also be different. Other areas with relatively high anchoveta NASC values were found at latitudes 13°, 16°, 10°, and 09°S.
The plotting of the spatial distribution of these NASC values for the two acoustic frequencies (Figure 2) shows that the anchoveta had a wide spatial distribution between Punta La Negra and Huacho in the northern-central region, where it was found as far offshore as 115 nm from the coast, and between Chala and Quilca in the southern region, where it was found as far as 78 nm from the coast. The highest NASC values were observed with the 120 kHz frequency between Salaverry and Chimbote, but with the 38 kHz frequency, the highest NASC values were observed between Chicama and Chimbote with a predominance of intermediate values. In the other areas, there were no significant differences between both frequencies.

Figure 2: Spatial distribution of the anchoveta NASC values (expressed in m2.nm-2) observed for the frequencies of 38 kHz and 120 kHz during the 1909-11 survey.
Anchoveta biomass estimates
A total of seven (7) anchoveta biomass estimates were made with the hydroacoustic data collected during this 1909-11 survey, one with each of the methods described above. The results of these assessments by the degree of latitude are presented in Table 3 and are briefly described below.
| Degree of latitude (°S) | Hydroacoustic evaluation methods | ||||||
|---|---|---|---|---|---|---|---|
| 1. Stratification method in isoparalitoral areas. 120 kHz | 2. Geostatistics method. 120 kHz |
3. Stratification method in isoparalitoral areas. 38 kHz | 4. Geostatistics method. 38 kHz |
5. Geostatistical method with various models. 38 kHz |
6. Transect stratification method (J and H). 38 kHz |
7. Transect stratification method (J and H). 38 kHz with inter-trans |
|
| 03 | 0 | 0 | 0 | 0 | 0 | 0 | 0 |
| 04 | 3438 | 101 | 6652 | 0 | 29601 | 441 | 5112 |
| 05 | 329682 | 129607 | 113273 | 0 | 310414 | 62348 | 99995 |
| 06 | 813552 | 786311 | 1 133447 | 1 005918 | 905107 | 641897 | 830623 |
| 07 | 766997 | 795797 | 1 133312 | 1 369957 | 1 003629 | 673386 | 903443 |
| 08 | 2 036373 | 3 132264 | 2 341530 | 4 691041 | 1 057631 | 1 739966 | 1 133881 |
| 09 | 1 207965 | 61499 | 322327 | 37930 | 647134 | 603992 | 410171 |
| 10 | 554819 | 10191 | 533455 | 8724 | 664799 | 268473 | 334176 |
| 11 | 45386 | 0 | 69695 | 284 | 332512 | 34447 | 93575 |
| 12 | 403241 | 426481 | 628023 | 630332 | 501402 | 351962 | 589051 |
| 13 | 810399 | 1 326488 | 1 420876 | 2 226585 | 554101 | 1 374108 | 1 463241 |
| 14 | 88174 | 342434 | 424091 | 434106 | 389648 | 409759 | 499688 |
| 15 | 169148 | 193682 | 627695 | 279529 | 487016 | 1 151846 | 1 153158 |
| 16 | 559517 | 631009 | 391433 | 343043 | 834880 | 307621 | 473429 |
| 17 | 439887 | 347330 | 185826 | 20307 | 276585 | 272664 | 399894 |
| 18 | 148350 | 42479 | 656108 | 121998 | 118772 | 27333 | 76862 |
| North-Center | 7 229173 | 7 204855 | 8 754377 | 10 684406 | 6 882993 | 7 312626 | 7 516113 |
| South | 1 147754 | 1 020819 | 1 233367 | 485348 | 1 230237 | 607618 | 950185 |
| TOTAL | 8 376927 | 8 225673 | 9 987744 | 11 169754 | 8 113229 | 7 920244 | 8 466298 |
Table 3: Anchoveta biomass estimates in tons by degrees of latitude as obtained with the seven methods used for the processing and analysis of the hydroacoustic data from the 1909-11 survey. Estimated values and a vertical bar graph for each method are included. The first method in blue was the one set as the main one and is also the method most frequently used by IMARPE, the others in green were alternative methods.
First estimate, by stratification by isoparalitoral areas (120 kHz): Using the 120 kHz frequency, the total anchoveta biomass in the whole area was 8.38 million tons. The highest biomasses were found between Punta La Negra and Supe and between Pucusana and Pisco, specifically in the latitudes: 08°, 09°, 06°, and 13°S, where respectively 2.04, 1.21, 0.81 and 0.81 million tons were estimated.
The total estimated anchoveta biomass in the north-central region was 7.23 million tons and in the southern region was 1.15 million tons (Table 3).
Second estimate, by delta-geostatistics (120 kHz): The total anchoveta biomass estimated by this method for the 120 kHz frequency was 8.22 million tons. This method considers strata according to the size structure of the studied population, so each stratum can cover one or more degrees of latitude. And in this case, the latitude that contains the highest anchoveta NASC values will be having much more of the estimated biomass even if the delimitation of the stratum or polygon of distribution extends well into adjacent latitudes. This has been observed between latitudes 08° and 09°S, where for latitude 08°S the estimated anchoveta biomass is 3.13 million tons, while for latitude 09°S the estimated biomass is only 0.06 million tons. Something similar is observed between latitudes 11° and 12°S, where no biomass is estimated for latitude 11°S even though it had some, although low, anchoveta NASC values, but due to the type of stratification method used, these NASC values were assumed to belong to the 12°S stratum. Another important area in terms of estimated biomass was located between Cerro Azul and Pisco, corresponding to latitude 13°S, with estimated anchoveta biomass of 1.33 million tons. To the north of 08°S (between Chicama and Punta La Negra), specifically at latitudes of 07° and 06°S, the estimated anchoveta biomasses were respectively, 0.79 and 0.78 million tons.
The total estimated anchoveta biomass in the north-central region was 7.20 million tons and in the southern region was 1.02 million tons (Table 3).
Third estimate, stratification by isoparalitoral areas (38 kHz): The total anchoveta biomass estimated by this method from the NASC values of the 38 kHz frequency was 9.99 million tons, which was distributed with the highest concentration within latitude 08°S with 2.34 million tons. Other latitudes with lower abundances were latitudes 13°, 06°, and 07°S with 1.42, 1.13, and 1.13 million tons, respectively.
The total estimated anchoveta biomass in the north-central region was 8.75 million tons and in the southern region was 1.23 million tons (Table 3).
Fourth estimate, by geostatistics (38 kHz): The total anchoveta biomass estimated by this method with the values of the frequency of 38 kHz was 11.17 million tons. This was the highest estimate of the seven evaluation methods used. Due to the diversity in the anchoveta sizefrequency distributions found during this survey, the latitude with the highest estimated biomass was 08°S, having biomass of 4.69 million tons. That was due to how the method is applied, which considered as part of the stratum in latitude 08°S most of the abundance indexes of latitudes 09°, 10°, and 11°S. This is why the estimated biomass for these other latitudes was very low. Another area with high biomass estimates was in latitude 13°S, which corresponds to Cerro Azul-Pisco with 2.23 million tons. Adult anchoveta predominated in the strata north of Chicama that correspond to latitudes 07° and 06°S, where the estimated biomasses were 1.36 and 1.00 million tons, respectively.
The total estimated anchoveta biomass in the north-central region was 10.68 million tons and in the southern region was 0.48 million tons (Table 3).
Fifth estimate, by geostatistics using various distribution models (38 kHz): The total anchoveta biomass estimated by this method for the 38 kHz frequency was 8.11 million tons. The biomass distributions by latitude show greater uniformity concerning the other methods, and three areas with higher biomasses were observed between Punta La Negra and Supe, Punta Caballas and Quilca and Supe and Chimbote, which correspond to the latitudes 08°, 07°, 06°, 16°, 10° and 09°S with 1.06, 1.00, 0.90, 0.83, 0.66 and 0.65 million tons, respectively.
The total estimated anchoveta biomass in the north-central region was 6.88 million tons and in the southern region was 1.23 million tons (Table 3).
Sixth estimate, stratification by transects (38 kHz): The total anchoveta biomass estimated for the 38 kHz frequency with this Jolly- Hampton method was 7.92 million tons. The highest abundances were located off Salaverry and between Cerro Azul and Pisco and San Juan de Marcona and Chala, which correspond to latitudes 08°, 13°, and 15°S, with biomasses of 1.74, 1.37 and 1.15 million tons respectively.
The total estimated anchoveta biomass in the north-central region was 7.31 million tons and in the southern region was 0.61 million tons (Tables 3 and 4).
| Techniques | Hydroacoustic methodologies | Biomass north-center (tons) | Total biomass (tons) | Coefficient of variation (%) | NASC average (m2.nm-2) |
|---|---|---|---|---|---|
| Stratification method by isoparalitoral area of 10 × 30 nm | 1. Stratification method in isoparalitoral areas. 120 kHz | 7 229173 | 8 376927 | 5.44 | 204.87 |
| 3. Stratification method in isoparalitoral areas. 38 kHz | 8 754377 | 9 987744 | 5.52 | 341.18 | |
| Stratification method transect (Jolly and Hampton) | 6. Transect Stratification Method (J&H). 38 kHz | 7 312626 | 7 920244 | 21.65 | 278.92 |
| 7. Transect Stratification Method (J&H). 38 kHz with inter-transects | 7 516113 | 8 466298 | 13.71 | 341.18 | |
| Geostatistical method | 2. Geostatistical delta method. 120 kHz | 7 204855 | 8 225673 | 33.21 | 1383.03 |
| 4. Geostatistical delta method method. 38 kHz | 10 684406 | 11 169754 | 38.08 | 980.40 | |
| 5. Geostatistics method with various distribution families. 38 kHz | 6 692332 | 7 846511 | 5.10 | 732.37 |
Table 4: Coefficient of variation of the seven methodologies used in the processing and analysis of the 1909-11 survey data.
Seventh estimation, stratification by transects considering all the data (38 kHz): The total anchoveta biomass estimated with this last method that considers all the data for the 38 kHz frequency obtained during the survey (inter-transects) was 8.47 million tons. The highest biomasses were estimated between Cerro Azul and Pisco, San Juan de Marcona, and Chala and off Salaverry, which correspond to latitudes 13°, 15°, and 08°S with biomasses at 1.46, 1.15 and 1.13 million tons respectively. Other areas with relatively high abundances were located north of Chicama, especially near the coast (with the presence of adult anchoveta), corresponding to latitudes 07° and 06°S with 0.90 and 0.83 million tons respectively.
The total estimated anchoveta biomass in the north-central region was 7.52 million tons and in the southern region was 0.95 million tons.
Comparison of the anchoveta biomass estimates with the various methods
Three types of stratification (by isoparalitoral areas, by transects and by geostatistics) were applied to the data from the 120 kHz and 38 kHz frequencies with the seven methods used for this paper. The results of the seven methods showed the same general trend in the latitudinal distribution of the biomass estimates and had similar abundance magnitudes (Figure 3), although there were some differences both between stratification techniques and between wave frequencies of the data used.

Figure 3: Anchoveta biomass estimates by latitude from the 1909-11 survey according to the seven hydroacoustic methodologies used.
(a): The methods of stratification by isoparalitoral areas estimated total anchoveta biomass of 9.99 million tons with the 38 kHz frequency data (first method), which was 1.61 million tons higher than the total biomass (8.38 million tons) estimated with the 120 kHz frequency data (third method). The average NASC value for the 38 kHz frequency was also higher, with 341.8 m2.nm-2 and a CV of 5.52% than the average NASC value for the 120 kHz frequency, which was 204.87 m2.nm-2 (includes all zeros) and has a CV of 5.44%
(b): The methods of stratification by transects (rectangles) with the 38 kHz frequency estimated total anchoveta biomass of 7.92 with its traditional form (sixth method) of using only data from the transects, while when using data from the transects and the inter-transects (seventh method) the estimated total biomass was 8.47 million tons, with a difference of only 0.55 million tons. The traditional method (the sixth method, using only transect data) had an average anchoveta NASC of 278.92 m2.nm-2 and a CV of 21.65%, while the seventh method (using all data, of transects and inter-transects) had an average NASC of 341.18 m2.nm-2 and a CV of 13.71%. With the traditional method (sixth method) the estimated biomass of anchoveta smaller than 12 cm was 3.47 million tons and was 4.45 million tons for anchoveta larger than 12 cm; while with all the data (seventh method) the estimated biomass of anchoveta smaller than 12 cm was 4.18 million tons and was 4.28 million tons for anchoveta larger than 12 cm (Figure 4).

Figure 4: Anchoveta biomass estimates for each 0.5 cm length-interval obtained with the two transect stratification methods (Jolly and Hampton methods) using data from the 1909-11 survey (the anchoveta minimum commercial size is 12 cm).
(c): The geostatistical methods were applied in three variants: with data from the frequency of 120 kHz (second method), with data from the frequency of 38 kHz (fourth method), and with the same data from the frequency of 38 kHz but using various distribution families (fifth method). And they estimated total anchoveta biomasses of 8.22, 11.7, and 8.11 million tons respectively, with a difference of up to 3.06 million tons between the fourth and fifth methods. Differences are observed in the average anchoveta NASC values with this group of methods because they do not consider the external zero values of the distribution. The average anchoveta NASC values and the coefficients of variation (CV) that were obtained were 1383.03 m2.nm-2 and 33.21% for the frequency of 120 kHz, 980.40 m2.nm-2 and 38.08% for the frequency 38 kHz, and 732.37 m2.nm-2 5.10% for the frequency of 38 kHz with four distribution families. The semivariograms of this group of three methods show a high spatial correlation within the range of 10 nm to 6 nm distance between strata, yet the anchoveta NASC values from the 38 kHz frequency show greater variability with plateaus between 9-10 of semi-variance in comparison with the NASC values from the 120 kHz frequency, with plateaus between 8-9 of semi-variance, and have lower variance (Figure 5).

Figure 5: Best distribution models that fit the empirical semivariogram of each frequency (38 and 120 kHz) of the three geostatistical methodologies. The 38 kHz model-2 corresponds to the model using 4 distribution families.
The average of the anchoveta biomass estimates of the above seven methodologies gives estimated average biomass of 8.89 million tons for the whole of Peru and 7.94 million tons for the north-central region.
Discussion
At IMARPE, the techniques for using acoustic data of the 120 kHz frequency to estimate the biomass of neritic and oceanic pelagic resources by the hydroacoustic method began to be applied in 1970 with the technical assistance of FAO [34], and this has been the main frequency used in the hydroacoustic stock assessment surveys of the Peruvian fishery resources of anchoveta (Engraulis ringens) and others. The 120 kHz was the frequency of choice especially due to the sensitivity of this frequency in the surface layer up to 150 m depth where these pelagic species are found. Now, both the 120 kHz as well as the 38 kHz frequencies are used as an international standard for acoustic fish stock assessments.
Starting in 1983, IMARPE began to continuously use the hydroacoustic assessment method as a direct method to estimate the biomass of the various pelagic fish populations in Peruvian waters. The “stratification by isoparalitoral area method” was used from 1995, and it is used with parallelograms that are 10 nm wide × 30 nm high.
It is noted that there are no large differences between the anchoveta biomass estimates obtained with the seven methods described above. Each method has its characteristics and differences in the stratification technique and data treatment (i.e., stratification by isoparalitoral area, by transects and by geostatistics). Among these, [27] consider that the “method of stratification by isoparalitoral areas” is satisfactorily independent of the strata when these are properly dimensioned, and it is easy to use in ecological models such as those of fish populations.
The anchoveta size-frequency distributions obtained from the fishing hauls can be incorporated into the stratum, allowing for a reasonable cartographic representation of the spatial distribution of fish concentrations. It also allows for the inclusion of additional sampling in some strata, such as inter-transects and possible irregular sampling tracks. The inclusion of the coastal inter-transects is another favorable aspect due to the presence of an important fraction of the anchoveta population in the coastal areas. Among the disadvantages of this technique, some are that it does not consider the spatial autocorrelation of the ESDU and the limited autocorrelation between strata, provides poor geographic information and is a simple and tolerant processing method for non-stationary distributions. The results of this methodology for the 120 kHz frequency with a lower CV are acceptable due to the lower dispersion.
Generally, biomass estimates with the 38 kHz frequency data are higher than those using 120 kHz frequency data. Therefore, if we take the estimated biomass from the frequency of 38 kHz as a baseline, we found that in this 1909-11 survey, the estimated biomass with the frequency of 120 kHz was 16.13% lower, and the biomass estimated in the 1902-03 survey in the summer of 2019 was 10.36% lower.
The “method of stratification by transects”, or Jolly-Hampton method, has the virtue that biomass is estimated for each ESDU (1 nm) with its corresponding biomass structure by fish size-groups, and the biomass is presented for each transect, which means that the transects are independent and that there is no autocorrelation between two successive transects. Among the disadvantages of this method, one that stands out is that it supposes that the stratum or transect is homogeneous when usually there is heterogeneity along the transect, and this method does not consider the autocorrelation between ESDUs. The application of this methodology is appropriate when considering all the data, including those of the inter-transects, since an important fraction of the anchoveta population can be found in the coastal areas where they are detected by the inter-transects. In addition to that, the CV is lower.
Regarding the geostatistical method, [23,27] mention that this method has the advantages of using spatial auto-correlation between the NASC values, takes all the density values by the interpolation method, has no independent samples, and allows delimiting strata if necessary (i.e. one portion of the anchoveta population made up of juveniles or pre-recruits, and another made up of adults). The main disadvantage of this methodology is that the results will have a greater bias when short-time changes in the fish spatial distribution occur, and the precision calculation will depend directly on the choice of the distribution family described by the variogram. Within geostatistical methods, the spherical model is the most suitable, because it has a plateau consistent with the data, and secondly, the exponential model is more suitable than the Gaussian model because, although the latter reflects spatial continuity very well, the interpolation of points based on this model is very demanding for the input values, frequently producing graphic representations far from reality.
In recent years, this delta-geostatistical methodology has been included in the analyses and estimations going into the final reports of the Pelagic Resources Hydroacoustic Assessment surveys. Since in this cruise survey there were various areas with the presence of anchoveta pre-recruits, recruits, juveniles and adults which causes the variogram models not to have a precise fit, the NASC data from the frequency of 120 kHz were preferred because they had a lower CV than those from the 38 kHz frequency. In the case of a geostatistical application with the four distribution families, the average NASC value and the CV were lower than those from the two other geostatistical methods because it considers more zero values which are generated in the construction of the polygon.
Concerning the error in the biomass estimates, [23] considers that it results from the sum of two components. The first one is the sampling error (precision) caused by the way or the moment in which the measurements are taken, which can affect the observations of the stochastic samples of the true average density. The second is the systematic error (bias) that affects all observations equally. One example is the type of systematic error caused by the electrical noise observed on board the BIC José Olaya that affected the observations at the 120 kHz frequency.
Another possible source of error that was observed during this survey was associated with the high dispersion of the anchoveta between September and November 2019 during the 1909-11 survey in which the anchoveta was widely distributed both horizontally and vertically, including areas somewhat distant from the coast, and some were found in the surface layers, within the first 4-7 meters from the surface, where the scientific echo sounders in use have difficulties to detect and record the presence of anchoveta because this surface layer combines two zones that fall outside the observation field of the echo sounders and transducers being used. A first “blind zone” in the space between the surface and the location of the transducer in the ship's hull and a second is just below the transducer where there is an “acoustic blind zone” that corresponds to the necessary space for the acoustic wave-train to be formed [35-37]. It was not possible to quantify or correct the possible bias caused by the very superficial distribution of the anchoveta when analyzing the acoustic data, but it is estimated that the amount of anchoveta in these blind zones would not have been very large because what was observed in these surface layers were low quantities of dispersed small schools or isolated fishes.
With regards to the possible bias caused by the wider distribution of the anchoveta with respect to the coast, it is noted that the sampling design of this survey included much longer transects to cover areas with anchoveta at greater distances from the coast. However, this extends the duration of the transects, which can impair sampling, especially under a condition of rapid changes in the marine environment since the dynamics of the marine environment can cause short but sudden movements and migrations of the anchoveta, which can affect the sampling of the anchoveta schools (i.e., sampling error). In these cases, the acoustic sampling of scientific platforms in parallel is recommended, which is the type of transects used in this and the other acoustic assessment surveys carried out regularly by IMARPE. Also, with the use of three ships, it was possible to shorten the duration of the survey while maintaining a wide spatial coverage without reducing the sampling density, and also the route of the ships was planned so that at all times two ships were operating close by, making parallel and interleaved transects (Figure 1), with which it was possible to reduce the elapsed sampling time between neighboring transects.
Estimating the anchoveta total population biomass from these samples necessarily implies accepting a certain degree of uncertainty, although efforts are continually made to try to reduce this uncertainty. One frequent alternative is to increase sampling. However, the proportion sampled is not the only or main factor that determines the precision of the sampling since this is determined by a combination of factors, such as the survey design, the size structure, and spatial distribution of the anchoveta and the variability inherent to the fish densities found.
Conclusion
All the methods showed similar results but the best estimates of the anchoveta biomass were the method of stratification by isoparalitoral areas (120 kHz frequency), which estimated total anchoveta biomass of 8.38 million tons; the method of stratification by transects with all the data (from transects and inter-transects) from the frequency of 38 kHz, which estimated total anchoveta biomass of 8.47 million tons; and the geostatistical delta method with data from the frequency of 120 kHz, which estimated total anchoveta biomass of 8.22 million tons in the entire surveyed area.
During the processing of the estimates, special attention needed to be and was paid to the measurement and correct use of the fish sizes in the TS equations and the length-weight relationship of the anchoveta. It is necessary since the diversity in the size structures of the anchoveta could influence the final biomass estimates with the technics for analysis of hydroacoustic signals being used.
When the environmental conditions are cold, the anchovy distribution is generally wide, for which it is required that acoustic sampling must be rapid to counteract the possible effect of horizontal migration.
The anchoveta biomass estimates made during this 1909-11 survey allow us to conclude that we are dealing with an abundant and healthy anchoveta population in the Peruvian marine ecosystem, and it is expected that with adequate monitoring and management of fisheries it will be maintained as such in a sustained manner, even though its distribution and local abundance may be temporarily affected by anomalous climatic events.
Acknowledgments
The authors thank the IMARPE staff for their support and collaboration, and especially Messrs. Miguel Ñíquen and Erich Díaz from the General Directorate of Investigations of Pelagic Resources for providing the biological data for the anchoveta, and Messrs. Carlos Valdez, Gustavo Cuadros, German Chacón, Han Xu, Walter Castañeda, Luis Escudero, Naldi Herrera, Wuilliam Calderón and Néstor Saavedra from the Hydroacoustic Functional Area of the General Directorate for Hydroacoustic Research, Remote Sensing and Fishing Arts for their effort and effective participation in 1909-11 survey.
References
- Csirke J, Arguelles J, Alegre A, Ayón P, Bouchon M, et al. (2018) Biology, population structure and fishery of jumbo flying squid (Dosidicus gigas) in Peru. Bol Inst Mar Perú 33: 302-364.
- Chavez F, Bertrand A, Guevara-Carrasco R, Soler P, Csirke J (2008) The northern Humboldt Current System: brief history, present status and a view towards the future. Prog Oceanogr 79: 95-105.
- Bertrand A, Gerlotto F, Bertrand S, Gutiérrez M, Alza L, Chipollini A, et al. (2008) Schooling behaviour and environmental forcing in relation to anchoveta distribution: An analysis across multiple spatial scales. Prog Oceanogr 79: 264-277.
- Fréon P, Barange M, Arístegui J (2009) Eastern boundary upwelling ecosystems: integrative and comparative approaches. Prog Oceanogr 83: 1-14.
- Bakun A, Weeks SJ (2008) The marine ecosystem off Peru: What are the secrets of its fishery productivity and what might its future hold? Prog Oceanogr 79: 290-299
- Nixon S, Thomas A (2001) On the size of the Peru upwelling ecosystem. Deep Sea Research I 48: 2521-2528
- Heck C (2015) Hacia un manejo ecosistémico de la pesquería peruana de anchoveta. Sociedad Peruana de Derecho Ambiental (SPDA). Perú, p: 45. ISBN: 978-9972-792-99-1.
- IMARPE (2019) Protocolo “Elaboración de la Tabla de Decisión para la determinación del Límite Máximo de Captura Total Permisible para la pesquería del Stock Norte-Centro de la anchoveta peruana”. IMP-DGIRP/AFDPERP. Edición 04, p: 39.
- Jordan R, Ch. de Vildoso A, Valdivia, Tsukayama Y (1980) Informe de balance poblacional de los recursos pelágicos a fines de 1980. Informe interno IMARPE, Callao, Perú, p: 14
- Jordan R, Ch. de Vildoso A, Valdivia J, Zuzunaga J, Tsukayama Y (1981) Informe sobre la situación de los recursos pelagicos a principios de 1981 y las proyecciones de pesca. Informe interno IMARPE, Callao, Perú, p: 30
- Guevara R, Yamashiro C, Blaskovic V (2018) Protocolo elaboración de la tabla de sensibilidad para la estimación del límite máximo de captura total permisible para el recurso merluza Merluccius gayi peruanus. Informe interno IMP-DGIRDL/AFIPDBL IMARPE, Callao, Perú, p: 16
- IMARPE (2019) Informe “Situación del stock norte-centro de la anchoveta peruana al 05 de noviembre del 2019 y perspectivas de explotación para la segunda temporada de pesca 2019”. IMARPE, p: 25
- Decreto Legislativo Nro 1084 (2008) Ley sobre Límites Máximos de Captura por Embarcación. DECRETO SUPREMO N° 021-2008-PRODUCE. 12 de diciembre 2008, Perú
- Decreto Supremo Nro 009-2015 PRODUCE (2015) Modifican el Reglamento del Decreto Legislativo Nº 1084 Ley sobre Límites Máximos de Captura por Embarcación, a fin de facilitar el inicio de las temporadas de pesca del recurso anchoveta con destino al consumo humano indirecto. 25 de marzo 2015
- SPDA (2019) Reglas de Juego en el Sector Pesca. Sociedad Peruana de Derecho Ambiental (SPDA), Perú
- IMARPE (2019a) Informe Ejecutivo del Crucero de Evaluación de Biomasa Desovante de la Anchoveta por el Método de Producción de Huevos y Larvas 1908-09. MPH 2019. Inf Inst Mar Perú Informe interno.
- IMARPE (2019b) Tercer informe de campo del Crucero de Evaluación Hidroacústica de Recursos Pelágicos 1909-11. Inf Inst Mar Perú Informe interno.
- ENFEN 15 (2019) Comunicado Oficial ENFEN Nro. 15-2019. Comisión Multisectorial encargada del Estudio Nacional del Fenómeno El Niño. Callao, 12 de diciembre de 2019, p: 5.
- ENFEN 03 (2020) Comunicado Oficial ENFEN Nro. 03-2020. Comisión Multisectorial encargada del Estudio Nacional del Fenómeno El Niño. Callao, 13 de febrero de 2020, p: 4.
- Bertrand S, Dewitte B, Tam J, Díaz E, Bertrand A (2008) Impacts of Kelvin wave forcing in the Peru Humboldt Current system: Scenarios of spatial reorganizations from physics to fishers. Prog Oceanogr 79: 278-289
- IMARPE (2020) Informe de la Prospección Biológica-Pesquera de la Anchoveta realizado entre el 4 al 12 de enero del 2020. Inf. Inst. Mar Perú. Informe interno.
- Ñiquén M, Bouchon M (2004) Impact of El Niño events on pelagic fisheries in Peruvian waters. Deep-Sea Res II 51: 563-574.
- Simmonds E, MacLennan D (2005) Fisheries Acoustics: Theory and Practice. 2nd Edition. Blackwell Science, London, p: 437.
- Castillo PR, Peraltilla S, Aliaga A, Flores M, Ballon M, Calderón J, et al. (2011) Protocolo técnico para la evaluación acústica de las áreas de distribución y abundancia de recursos pelágicos en el mar peruano. Versión 2009. Instituto del Mar del Perú 36: 7-28
- Foote KG, Knudsen HP, Vestnes DN, Mac Lennan DN, Simmonds EJ (1987) Calibration of acoustic instruments for fish density estimation: a practical guide. Int Council Explor Sea 144: 1-69.
- MacLennan DN, MacKenzie IG (1988) Precision of acoustic fish stock estimates. Can J Fish Aquat Sci 45: 605-616.
- Simmonds EJ, Williamson NJ, Gerlotto F, Aglen A (1992) Acoustic survey design and analysis procedure: a comprehensive review of current practice. ICES Coop Res Rep 187: 112.
- Simard Y, Gerlotto F (1990) Exploration of the applicability of geostatistics in fisheries acoustics. CIEM/ICES Working group on Fish. Acoust Sci Techno Rostock, p: 27
- Maynou F (1998) The application of geostatistics in mapping and assessment of demersal resources. Nephrops norvegicus (L.) in the northwestern Mediterranean: A case study. Sci Mar 62 (Suppl. 1): 117-133.
- Cressie NAC (1993) Statistics for spatial data. John Wiley and Sons: New York.
- Deutsch CV, Journel AG (1998) GSLIB: Geostatistical Software Library and User’s Guide", Second Edition, Oxford University Press, New York, p: 369.
- Matérn B (1987) Spatial Variation, 2nd edn. Lecture Notes in Statistics, p: 151.
- Jolly GM, Hampton I (1990) A stratified random transect design for acoustic surveys of fish. Can J Fish Aquat Sci 47: 1282-1291
- Johannesson K, R Vilchez (1981) Application and some results of echo-integration methods of monitoring Peruvian anchovy resources. In: J. Suomala (ed.). Meeting on hydroacoustical methods for the estimation of marine fish populations, 25-19 June, 1979. Charles Stark Draper Laboratory Inc. Cambridge, MA. 2b: 756-816.
- Korneliussen RJ, Diner N, Ona E, Fernandes PG (2004) Recommendations for the collection of multi-frequency acoustic data. ICES CM2004/R 36: 15.
- Mitson RB (1995) Underwater noise of research vessels. Review and recommendations. ICES Cooperative Research Report, 209.
- Soria M, Freón P, Gerlotto F (1996) Analysis of vessel influence on spatial behaviour of fish schools using a multi-beam sonar and consequences for biomass estimates by echo-sounder. ICES J Mar Sci 53: 453-458
- Gutiérrez M (1999a) Mediciones In situ de TS a finales de la primavera 1998. Crucero BIC José Olaya Balandra 9811-12. Inf Inst Mar Perú 146: 7-10
- Gutiérrez M, MacLennan D (1998) Resultados preliminares de las mediciones de fuerza de blanco in situ de las principales especies pelágicas. Inf Inst Mar Perú 135: 16-19
- MacLennan DN, M Gutiérrez, R Castillo, F Ganoza, L Escudero, et al. (1998) Fuerza de Blanco de anchoveta (Engraulis ringens) utilizando frecuencias de 38 y 120 kHz. Inf Inst Mar Perú 133: 15-25
- Gutiérrez M (1999) Mediciones In situ de TS a finales del verano 1999. Crucero BIC José Olaya Balandra 9902-03. Inf Inst Mar Perú 147: 7-10