Review Article, J Mar Biol Oceanogr Vol: 7 Issue: 2
Distribution, and Socioeconomic Analysis of Delphinus delphis and Tursiops truncatus in Relation to Vessel Presence in the Eastern Aegean Sea
Inch KM1*, Pietroluongo G2 and Hepburn LJ1
1University of Essex, School of Biological Sciences, CO2 8GY Colchester, England
2Archipelagos Institute of Marine Conservation, 83 103 Samos, Greece
*Corresponding Author : Kari M Inch
University of Essex, School of Biological Sciences, CO2 8GY Colchester, England
Tel: +1 (509) 398 7896
E-mail: Kari.Inch06@gmail.com
Received: February 10, 2018 Accepted: March 08, 2018 Published: March 14, 2018
Citation: Inch KM, Pietroluongo G, Hepburn LJ (2018) Population Abundance, Distribution, and Socioeconomic Analysis of Delphinus delphis and Tursiops truncatus in Relation to Vessel Presence in the Eastern Aegean Sea. J Mar Biol Oceanogr 7:2. doi: 10.4172/2324-8661.1000190
Abstract
Distribution, and Socioeconomic Analysis of Delphinus delphis and Tursiops truncatus in Relation to Vessel Presence in the Eastern Aegean Sea
Objective: This study investigates population abundance and distribution of common (Delphinus delphis) and bottlenose dolphins (Tursiops truncatus) in the Eastern Aegean Sea, where there is limited knowledge of these species. Analyses were made in relation to vessel presence and socioeconomic implications. Methods: Data was collected during boat-based surveys, South of Samos Island and the Northern Dodecanese region, Greece, to determine dolphin population abundance and distribution. Interviews were conducted with native stakeholders to determine socioeconomic factors influencing populations. Results: Mark-recapture photo-identification determined 78 and 76 marked individuals for 2015 and 2017 respectively, for common dolphins, and 31 and zero marked individuals for 2015 and 2017 respectively, for bottlenose dolphins. Common dolphin abundance estimates were 147 in 2015 (95% CL= 109-212) and 180 in 2017 (95% CL= 106-323). For bottlenose dolphins, 2015 estimates were 71 (95% CL= 46-120), while 2017 were unable to be calculated. There was no pattern to either species distribution; however, most sightings occurred near Southern Samos. Considering vessel presence, bottlenose dolphins were sighted most in the presence of fishing vessels, while sightings for common dolphins varied. Bottlenose dolphins showed avoidance of areas where vessels were most present in 2017, compared to 2016, whereas common dolphins did not. Despite competition between artisanal fishermen and populations of these dolphins for the same declining resources, stakeholders had similar awareness for views regarding conservation. Conclusion: Future population fluctuations may occur if vessel traffic continually increases, fishing laws are not abided and enforced, and conservation efforts are not recognized. Additional studies, implementing larger survey areas, are necessary to better understand both species’ population structure and distribution and effects of vessel presence. Moreover, more investigation into socioeconomics, between dolphin conservation and the fishing industry are needed to identify how impactive the industry is to these populations and other cetaceans inhabiting the Eastern Aegean Sea.
Keywords: Bottlenose dolphin; Common dolphin; Conservation; Distribution; Mark- recapture Photo-identification; Population abundance estimates; Socioeconomics; Vessel presence
Abbreviations
CL: Confidence Limits; EAS: Eastern Aegean Sea; IUCN: International Union for Conservation of Nature; MR: Mark-recapture; MS: Mediterranean Sea; Photo-ID: Photoidentification; QGIS: Quantum Geographical Information System; VP: Vessel presence; Archipelagos: Archipelagos Institute of Marine Conservation
Introduction
The Mediterranean Sea (MS), approximately 2,969,000 km2, with an average depth of 1,460 m and maximum of 5,267 m, is one of the largest and deepest enclosed seas, and busiest waterways, with more than 220,000 ships navigating through its waters on a yearly basis [1-3]. While transportation of goods and fishing is essential, many ships’ routes cross habitats vital to the sustainability of several known marine mammal (dolphin/whale/seal) and reptile (turtle) species [3-5]. While sightings may be periodic, their presence is enough to pose concern to threats they encounter. Therefore, further study regarding impacts of vessel presence (VP) on populations of these organisms, specifically abundance and distribution, is necessary.
The Aegean Sea, one of 13 regions in the MS, covers roughly 214,000 km2, and is highly trafficked, with shipping and demersal fishing being the highest, contributing 21% and 53% respectively, to average cumulative impact scores [6-8]. These quantifications assess impacts of these vessels on the environment and while they are high, waterway traffic is only expected to increase [4]. Due to high vessel occurrence and sightings of marine mammals and reptiles, there is potential for interactions, which can have negative consequences on these organisms.
While marine organisms inhabiting highly trafficked waters may show signs of strain after interaction, studies have focused on effects of these stressors on dolphins. Long-term changes in behavior and population health have occurred, owing to vessel and swimmer traffic, wherein spinner dolphins in Hawaii showed avoidance of specific areas and increased mortality [9]. Bejder et al. [10] studied effects of long-term dolphin-watching tours on bottlenose dolphins in Australia. The results indicated increases in tourism caused correlating declines in dolphin abundance within touring areas. Additionally, Campana et al. [3] found that during summer months in the Western MS, cetacean sightings and abundances in pelagic zones decreased with high VP, indicating negative responses. Although several dolphin species were observed, similar behaviors were recorded with high VP; numbers decreased in trafficked areas and dolphins relocated to areas with fewer disturbances.
Two dolphin species frequently sighted in the Eastern Aegean Sea (EAS), include the short-beaked common dolphin (Delphinus delphis, hereby referred to as ‘common dolphin’), inhabiting pelagic and neritic environments, and the common bottlenose dolphin (Tursiops truncatus, hereby referred to as ‘bottlenose dolphin’), residing primarily in coastal regions [11-13]. The common dolphin was one of the most prevalent species inhabiting the MS, but now classifies as endangered within the Mediterranean subpopulation by the International Union for Conservation of Nature’s (IUCN) Red List of Threatened Animals, with current populations decreasing [14,15]. This is partly attributed to anthropogenic stresses and climate change, like increasing sea temperatures [16]. Bottlenose dolphins, classified as vulnerable within the Mediterranean subpopulation by the IUCN, are also experiencing decreases in current populations [17]. Although bottlenose populations are also subjected to anthropogenic stresses and climate change effects, they experience additional factors depleting populations including live capture, acoustic disturbances, and seismic surveys [18,19].
Because the EAS is highly trafficked, distribution and abundance of these dolphin species can fluctuate [12,17]. Bearzi [20] states the fishing industry can cause long and short-term changes to dolphin behavior, influencing emigration and dispersion. It is therefore necessary to identify effects these disturbances have on the distribution and abundance of common and bottlenose dolphins. Mapping population distributions, from the past to the present, provides understanding of how anthropogenic stressors (i.e. vessels) and other environmental factors (i.e. prey availability), are affecting distribution within an area [21]. While dolphins may rely upon fishing practices to assist in capturing prey, their distribution may change once the fishing season ends- prey may not be as readily accessible [22-24]. Populations may fluctuate due to these pressures, making it necessary to predict future abundances, allowing researchers to implement conservation efforts sooner, to prevent further population declines [25].
Mark-recapture (MR) techniques have been used by researchers to assess abundances and distributions of cetaceans [26,27]. This technique can be conducted by capturing an organism, marking/ tagging it, and releasing it back into its environment [28]. However, a more suitable method has become widely used- MR implementing photo-identification (photo-ID). This allows assessment of specific physical traits of an organism (i.e. dorsal fin), without making physical contact, to individually identify them. Dorsal fin traits often categorized when studying dolphins include the position of nicks/ cuts, shape and pigmentation [29]. From this, it can be determined if new individuals are sighted (i.e. births within a pod) or whether the population is stable [30].
Due to the frequency and duration of disturbances marine organisms are subjected to in the EAS, conservation efforts are becoming an increasing need. Common and bottlenose dolphin populations are of high concern for conservationists, regarding their IUCN status and their role in the ecosystem as regulators of the food chain [31]. Although marine protected areas have been implemented throughout the MS, and restrictions and regulations have been established, at times they are not actively enforced or abided [15,17]. This can further cause dolphin populations to fluctuate, depending upon environmental factors (anthropogenic disturbances/food availability). One major factor affecting populations is the fishing industry. Dolphins and fishermen are in direct competition with one another, competing for the same declining resources (anchovy/ sardines/tuna), which dolphins rely upon for survival, and fishermen for their livelihood [13]. From this competition, dolphins are blamed by fisheries for low catch numbers, despite ecosystem damage from overfishing and habitat destruction having been identified as causes to reductions in fishery yields [11,32]. From this, intentional dolphin killings occur, putting populations further at risk [32]. Additional fishing aspects impact populations, such as bycatch, where dolphins become entangled in fishing gear, and habitat degradation/loss because of practices like bottom trawling [20,33]. These events can cause higher order effects to transpire, increasing concern for other marine organisms [31].
Although conflict exists between fishermen and dolphins, common dolphins are less likely than bottlenose to be involved with conflict issues. This is primarily due to diet; common dolphins prey upon epipelagic fish, whereas bottlenose preys upon fish inhabiting deeper regions, like the benthos [11,20,34]. From a study conducted in the Eastern Ionian Sea, total biomass removed annually was determined for 15 common and 42 bottlenose dolphins. Estimations indicated 16 and 90 tons removed by common and bottlenose dolphins respectively, with 3,469 tons removed by 307 fishing vessels. This equals roughly 3% of biomass removed by dolphin populations and 97% by fisheries, demonstrating that dolphin populations do not deplete fish resources as heavily [32]. Tension still exists between fishermen and dolphins; consequently, it is necessary to study conservation conflicts between stakeholders and dolphin populations.
This study aims to 1) determine current and predict future population abundances and distribution of common and bottlenose dolphins, 2) determine relationships between dolphin abundance and VP and; 3) determine local stakeholder opinions on conservation efforts for dolphins, by accessing socioeconomics of conservation conflict with fishing practices.
Materials and Methods
Study area
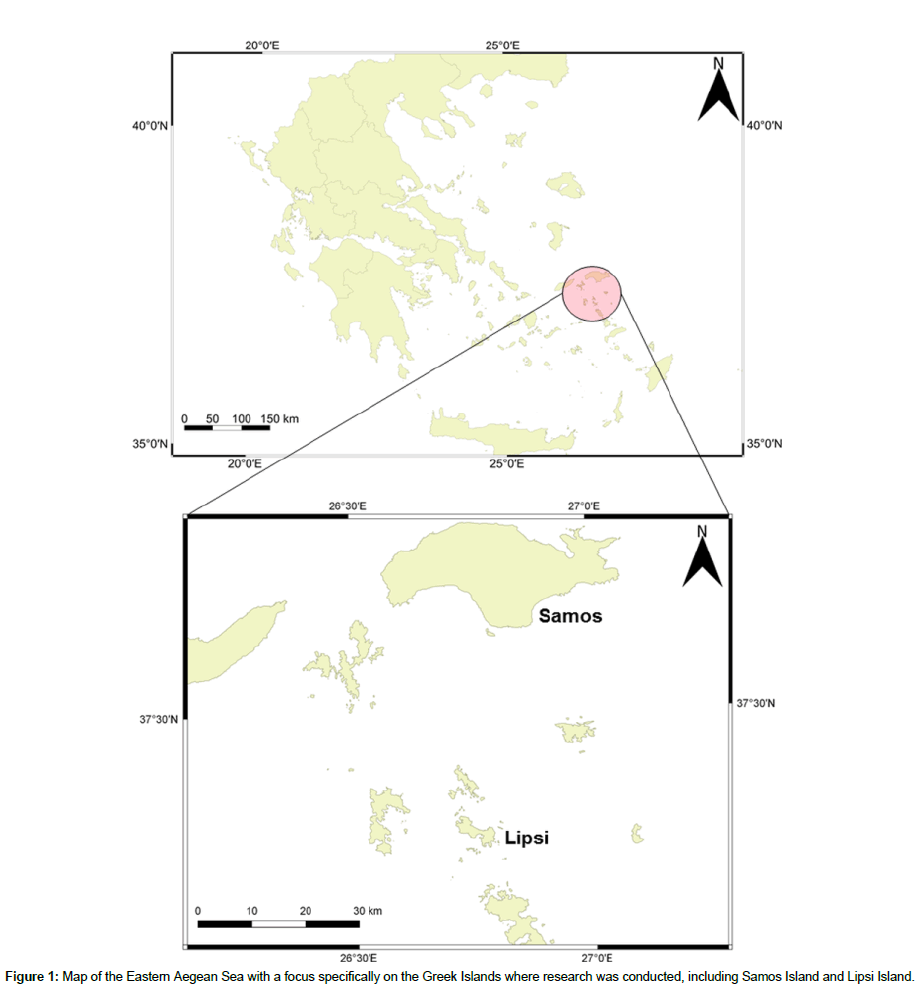
The focused study area was the EAS in survey areas near Samos (37.7548°N, 26.9778°E) and Lipsi Island (37.3011°N, 26.7438°E), Greece (Figure 1). This marine area experiences high quantities of fishing, including: artisanal, commercial (trawlers/purse seines), and recreational. Fishing efforts are quite regular with 70-100 artisanal fishermen, 3 trawlers from Samos and more than 5 from nearby Turkish waters, 2 purse seines, and 100 recreational fishermen. Artisanal fishermen fish 8-12 hrs daily, catching 10-15 kg of fish; trawlers fish 2-3 days consecutively catching half to one ton of fish; purse seines fish 8 hrs daily, catching 300-500 kg of fish; while recreational fishing, occurring closer to the coast, lasts 3-4 hrs daily, catching 5-10 kg of fish (local informal knowledge).
Boat-based surveys, of common and bottlenose dolphins, were conducted to determine population abundance and distribution and to determine if relationships existed between dolphin abundance and VP.
MR photo-ID data collection and analysis
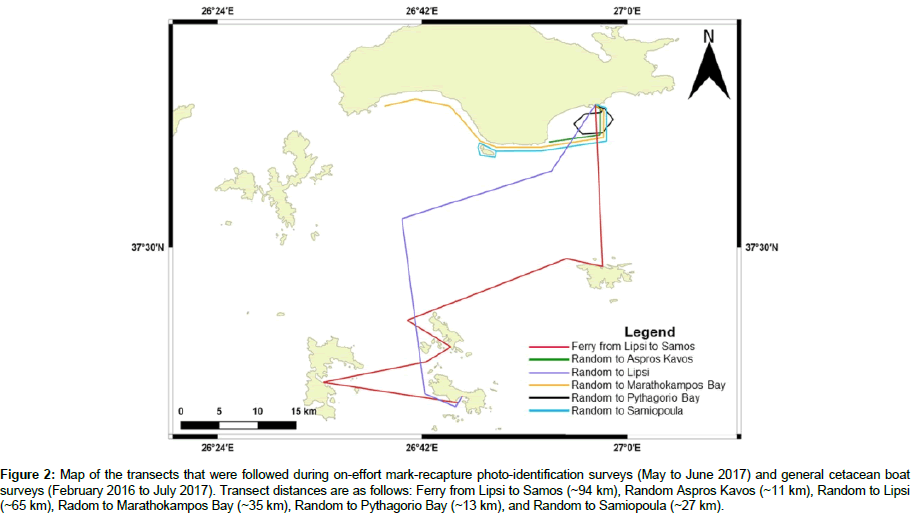
Surveys were conducted between May and June 2017 onboard research vessels and ferries, weather permitting. Beaufort sea state ranged 0-4. Surveys were conducted between 0600 and 2000 hr, at a speed of approximately 1-10 kn onboard research vessels and 4-13 kn onboard ferries. Duration ranged 1-10 hrs and was dependent upon the transect surveyed and number of sightings. Five pre-determined transects were surveyed: Ferry from Lipsi to Samos, Random to Lipsi, Random to Marathokampos Bay, Random to Pythagorio Bay, and Random to Samiopoula (Figure 2).
Figure 2: Map of the transects that were followed during on-effort mark-recapture photo-identification surveys (May to June 2017) and general cetacean boat surveys (February 2016 to July 2017). Transect distances are as follows: Ferry from Lipsi to Samos (~94 km), Random Aspros Kavos (~11 km), Random to Lipsi (~65 km), Radom to Marathokampos Bay (~35 km), Random to Pythagorio Bay (~13 km), and Random to Samiopoula (~27 km).
Research vessel and ferry survey teams consisted of 8-10 and 4-10 members respectively, with each member participating in scans. Two individuals were stationed at the bow and two others at the stern, scanning the horizon of the sea for thirty minutes, by naked-eye and/or with binoculars, coving 90° of the 360° survey area. After thirty minutes of observation, rotations occurred, with new individuals replacing current scanners for another thirty minutes. Rotations continued throughout the duration of the survey [35].
During each survey, a set transect was followed. A sighting was recorded when any dolphin was observed. Vessel speed was reduced to approach the dolphins, and photographs of dorsal fins of all individuals would try to be captured for later identification. On board ferries, speed was not reduced, and dolphins were not approached. The following was recorded onto data sheets: global positioning system, quantity of vessels (sailing boats/high speed boats/fishing boats/ferries/trawlers) in the area, dolphin species, estimated number of individuals, and time of sighting (Supplementary Information Appendix 1). If multiple sightings occurred during a survey, then the above was recorded as an additional sighting. After each encounter, the transect was continued until completion [35].
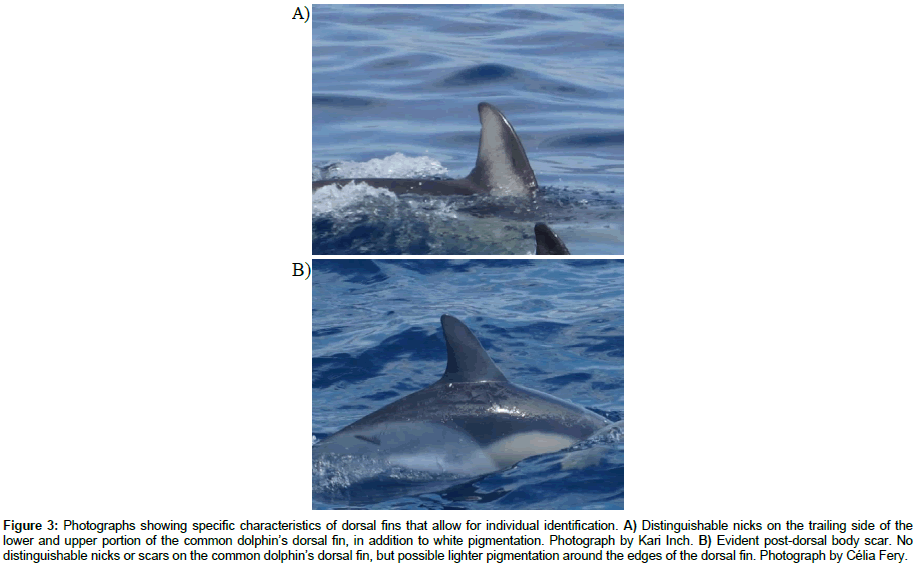
Digital photographs taken from each survey were downloaded and named accordingly, following the format outlined by Archipelagos Institute of Marine Conservation (Archipelagos) [36]. Photographs were examined to determine whether images were of suitable quality (high resolution, minimum glare, focused), whether dorsal fin characteristics were easily identified, and whether the fin was perpendicular to the camera. Images were also selected based on marks used for long-term identification (scars/dorsal fin pigmentation), rather than marks that heal or become less evident over time (scrapes). Photographs not of substantial quality were discarded. After photographic review, photographs were cropped to focus on the dorsal fin of a single individual (Figure 3) [35].
Figure 3: Photographs showing specific characteristics of dorsal fins that allow for individual identification. A) Distinguishable nicks on the trailing side of the lower and upper portion of the common dolphin’s dorsal fin, in addition to white pigmentation. Photograph by Kari Inch. B) Evident post-dorsal body scar. No distinguishable nicks or scars on the common dolphin’s dorsal fin, but possible lighter pigmentation around the edges of the dorsal fin. Photograph by Célia Fery.
Photographs were then compared to species specific photo-ID catalogs from 2015, as this was the only complete historical data for MR photo-ID efforts at Archipelagos. These catalogs allowed the determination of previously marked and new individuals. If a dorsal fin image from current surveys matched an image cataloged from 2015, then it was classified as previously marked, if it did not match, then it was classified as a new individual [36].
Calculating population abundance estimates
Datasets from MR photo-ID efforts in 2015 (May-August, November) and 2017 (May-June) were used. Abundance only considered marked dolphins and calculations were based upon a closed population [37]. The Schnabel Method was used, following the equation provided by Krebs [38] below:

N = number of individuals in population
Mt = total number of previously marked individuals in population at time t
Ct = total number of individuals in sample caught at time t
Rt = number of marked individuals caught at time t
Rt values were less than 50 for both species, so 95% upper and lower confidence limits (CL) were calculated. CL values were obtained from the Poisson distribution table provided by Krebs [38] and substituted for the Rt value in the above calculation. Values, specified by species and year, are as follows: common, 26.31 and 51.29 (2015), 6.686 and 20.335 (2017); bottlenose, 11.177 and 28.966 (2015), 0 and 3.285 (2017).
To estimate future abundances, calculations were performed on both datasets based upon estimates obtained from the above equation. Estimated annual percent mortality and productivity rates for both species were obtained from literature, with 1.1% mortality for common dolphins and 2.3% for bottlenose [39,40]. Annual productivity rates for both species were 4% [41,42].
Population distribution
All available sighting data for both dolphin species was collected from Archipelagos, from 2000-2017. Data was compiled and separated, by species and year, and a map of both species’ distribution was created using Quantum Geographical Information System (QGIS), version 2.18.9 [43].
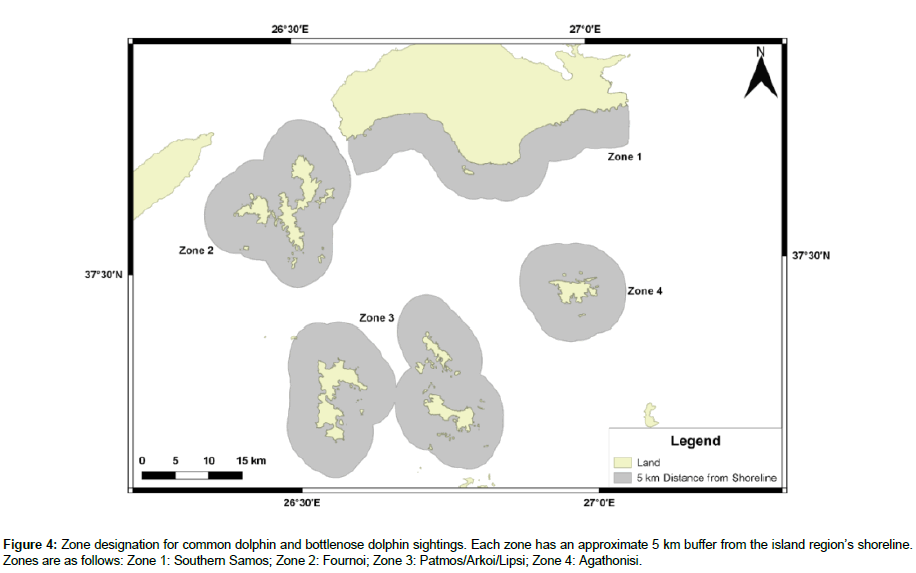
Distribution maps were divided into four zones, to determine the percentage of sightings for each species per zone. Zonation was determined by island region and sightings were included within a zone if they occurred up to 5 km from the region’s shoreline (Figure 4).
Population density
Population density was determined for both dolphin species for all transects pictured in Figure 2. Datasets available included data from February 2016-July 2017. There were an unequal number of replications for all transects, with the Random to Aspros Kavos having the minimum of ten. To conduct statistical tests, random numbers were generated which allowed removal of specific replicates for transects with additional replications.
Vessel presence
To determine VP affecting dolphin distribution and abundance, for all transects pictured in Figure 2, datasets from April 2016-July 2017 were used. Vessels recorded were separated into two groups: fishing (trawlers/fishing boats) and other (sailing boats/high speed boats/ferries). From the quantification of vessels, heat maps were created, per species and vessel type, using QGIS [43].
Stakeholder interviews
Interviews were conducted via email or face-to-face, with native Greek fishermen, authority, and community members, from May- June 2017. Six anonymous individuals, representative of each category, were interviewed to understand the socioeconomics of conservation conflict occurring between the fishing industry and dolphins. Answers were recorded onto interview forms (Supplementary Information Appendix 2).
Statistical analysis
The Kruskal-Wallis test was conducted to determine significant differences in population densities of both dolphin species between transects. The Kolmogorov-Smirnov test, with a Bonferroni correction for multiple comparisons, was conducted to determine relationships between the abundance of vessels on the water during a sighting, and the abundance, per sighting, of both dolphin species [44]. This was also determined between transects. Logistic regressions were conducted to analyze binary data from stakeholder interviews. R Statistical Software, version 3.3.3, was used [45,46].
Results
MR photo-ID
Data was collected from 18 surveys, with all transects surveyed to completion. 82 hrs were spent on the water and 1,119 km were surveyed. Common dolphins were sighted during eight surveys and bottlenose during three, with one survey having a sighting of both species. Seven surveys occurred with no sightings and one where the species was unidentifiable (Table 1).
| Transect Surveyed | Date of Survey | Species | Estimated Number of Individuals Sighted | Recaptures from 2015 | Recaptures from 2017 | New Individuals Identified |
|---|---|---|---|---|---|---|
| Ferry from Lipsi to Samos | 05.05.17 | C | 7 | 0 | 0 | 0 |
| 07.06.17 | - | - | - | - | - | |
| 09.06.17 | - | - | - | - | - | |
| 11.06.17 | C | 20 | 0 | 0 | 0 | |
| 21.06.17 | - | - | - | - | - | |
| 25.06.17 | - | - | - | - | - | |
| 26.06.17 | - | - | - | - | - | |
| Random to Lipsi | 03.05.17 | B, C | 8, 2 | 0 | 0 | 0 |
| 24.05.17 | B | 2 | 0 | 0 | 0 | |
| 26.05.17 | - | - | - | - | - | |
| 03.06.17 | C | 3 | 0 | 0 | 0 | |
| 27.06.17 | B | 5 | 0 | 0 | 0 | |
| Random to Marathokampos Bay | 01.06.17 | C | 20 | 1 | 1 | 17 |
| 22.06.17 | UND | 2 | 0 | 0 | 0 | |
| Random to Pythagorio Bay |
12.05.17 | C | 5 | 0 | 0 | 3 |
| 17.05.17 | C | 17 | 6 | 2 | 31 | |
| 18.05.17 | C | 34 | 1 | 1 | 21 |
Table 1: Summary table of the data from MR photo-ID surveys carried out, per transect surveyed, between May and June 2017. Dolphin species is indicated by C (common), B (bottlenose), or UND (unidentified). Hyphens (-) indicate that no dolphins were sighted during the survey effort.
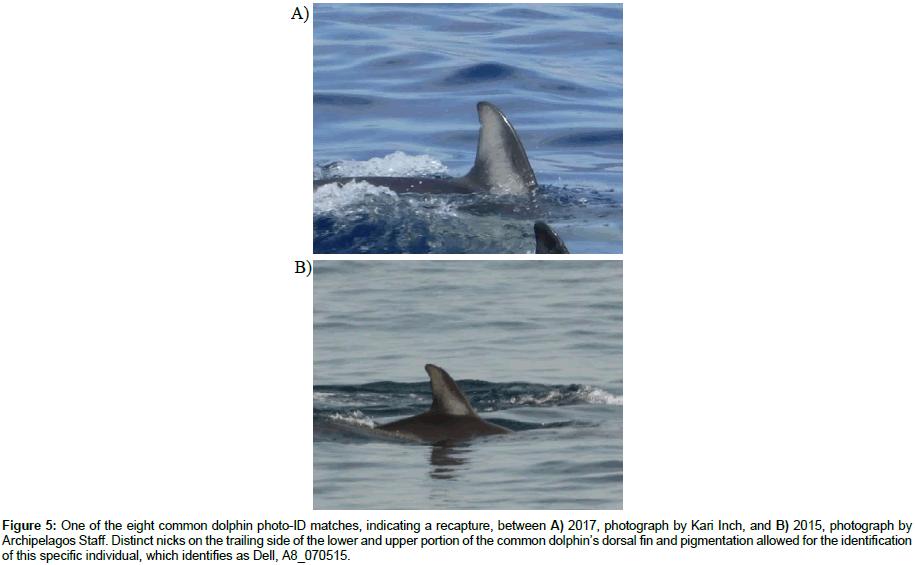
The 2015 common dolphin photo-ID catalog identified 78 individuals. Review of photographs from 2017 survey efforts, compared to the catalog, identified eight recaptures of those 78 individuals (Figure 5). Further photographic review for common dolphins determined 76 individuals to be sighted for the first time during 2017 efforts, four of which occurred a second sighting (Table 2).
| Individual | Sighting Number | Date of Sighting | Transect Surveyed |
|---|---|---|---|
| 1 | 1 | 12.05.17 | Random to Pythagorio Bay |
| 2 | 17.05.17 | Random to Pythagorio Bay | |
| 2 | 1 | 12.05.17 | Random to Pythagorio Bay |
| 2 | 17.05.17 | Random to Pythagorio Bay | |
| 3 | 1 | 17.05.17 | Random to Pythagorio Bay |
| 2 | 18.05.17 | Random to Pythagorio Bay | |
| 4 | 1 | 17.05.17 | Random to Pythagorio Bay |
| 2 | 01.06.17 | Random to Marathokampos Bay |
Table 2: Summary table of the four common dolphin individuals that were recaptured during survey efforts from May to June 2017.
Figure 5: One of the eight common dolphin photo-ID matches, indicating a recapture, between A) 2017, photograph by Kari Inch, and B) 2015, photograph by Archipelagos Staff. Distinct nicks on the trailing side of the lower and upper portion of the common dolphin’s dorsal fin and pigmentation allowed for the identification of this specific individual, which identifies as Dell, A8_070515.
The 2015 bottlenose dolphin photo-ID catalog identified 31 individuals. However, photographs of substantial quality were not taken of bottlenose dolphins during 2017 efforts, therefore recaptures and new individuals could not be identified.
Population abundance estimates
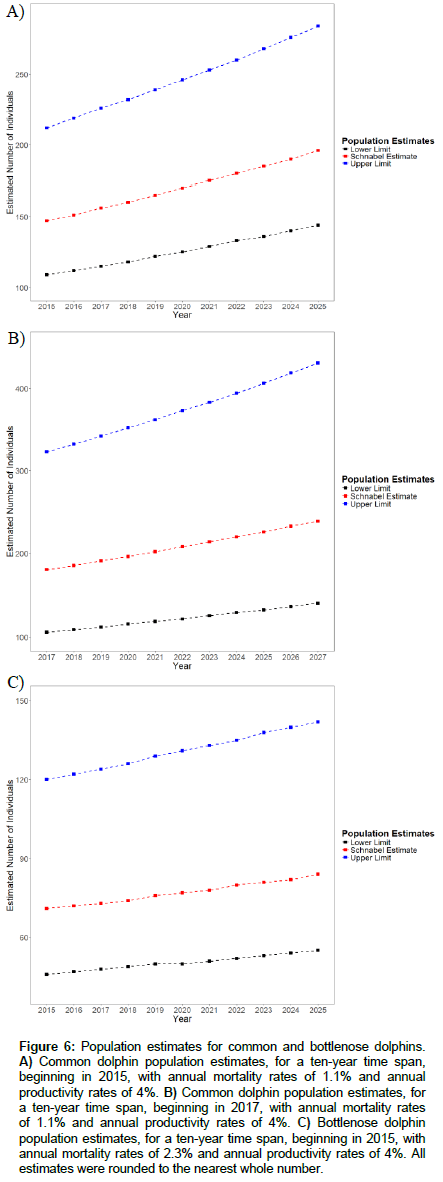
Schnabel Method calculations yielded estimates for common dolphins in 2015 and 2017 to be 147 (95% CL= 109-212) and 180 (95% CL= 106-323) respectively. In comparison, 2017 estimates from 2015 data was 24 individuals less than that calculated for 2017, from 2017 data. Estimates for bottlenose dolphins could only be calculated for 2015, as there was insufficient data for 2017. The 2015 estimate was 71 (95% CL= 46-120). Estimates, predicting population abundances for the next ten years, appear in Figure 6 A-C.
Figure 6: Population estimates for common and bottlenose dolphins. A) Common dolphin population estimates, for a ten-year time span, beginning in 2015, with annual mortality rates of 1.1% and annual productivity rates of 4%. B) Common dolphin population estimates, for a ten-year time span, beginning in 2017, with annual mortality rates of 1.1% and annual productivity rates of 4%. C) Bottlenose dolphin population estimates, for a ten-year time span, beginning in 2015, with annual mortality rates of 2.3% and annual productivity rates of 4%. All estimates were rounded to the nearest whole number.
Population distribution
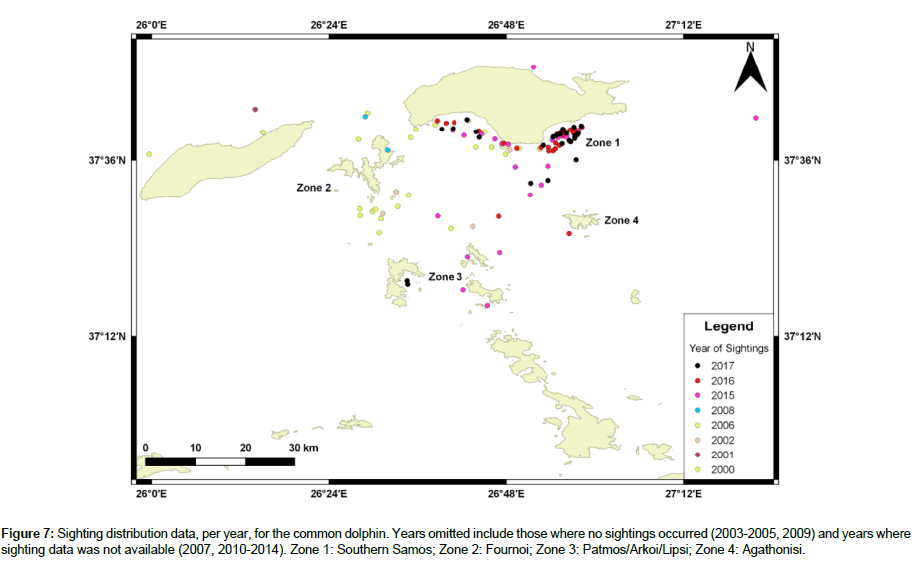
Available sighting data for common dolphins included the years 2000-2006, 2008, and 2015-2017, with 108 total sightings. 2015 and 2017 had the highest number of sightings, 27, while 2001 and 2006 had the lowest, one. No sightings occurred in 2003-2005 and 2009. Table 3 shows the percentage of sightings for each year. There is no evident pattern to dolphin distribution; however, approximately 67% of all sightings occurred in Zone 1, 10% in Zone 2, 7% in Zone 3, and <1% in Zone 4 (Figure 7). Refer to Figure 4 for zone designations.
| Species | ||
|---|---|---|
| Year | Common | Bottlenose |
| 2000 | 20 | 48 |
| 2001 | 1 | 4 |
| 2002 | 4 | 9 |
| 2003 | 0 | 1 |
| 2004 | 0 | 4 |
| 2005 | 0 | 0 |
| 2006 | 1 | 0 |
| 2008 | 2 | 0 |
| 2009 | 0 | 2 |
| 2012 | - | 2 |
| 2013 | - | 5 |
| 2015 | 25 | 13 |
| 2016 | 22 | 8 |
| 2017 | 25 | 4 |
Table 3: Percent of sightings (%) for common and bottlenose dolphins from 2000 to 2017. Omitted years were years where no data was available. Data obtained from Archipelagos.
Figure 7: Sighting distribution data, per year, for the common dolphin. Years omitted include those where no sightings occurred (2003-2005, 2009) and years where sighting data was not available (2007, 2010-2014). Zone 1: Southern Samos; Zone 2: Fournoi; Zone 3: Patmos/Arkoi/Lipsi; Zone 4: Agathonisi.
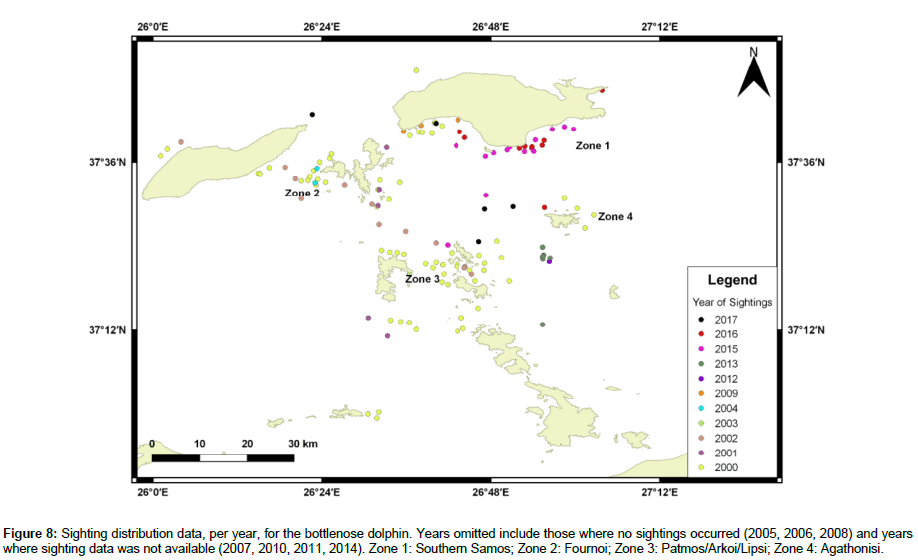
Available sighting data for bottlenose dolphins included the years 2000-2006, 2008-2009, 2012-2013, and 2015-2017, with 130 total sightings. 2000 had the highest number of sightings, 61, while 2003 had the lowest, one. No sightings occurred in 2005, 2006, and 2008. Table 3 shows the percentage of sightings for each year. There is no evident pattern to dolphin distribution; however, approximately 24% of all sightings occurred in Zone 1, 17% in Zone 2, 21% in Zone 3, and 4% in Zone 4 (Figure 8). Refer to Figure 4 for zone designations.
Figure 8: Sighting distribution data, per year, for the bottlenose dolphin. Years omitted include those where no sightings occurred (2005, 2006, 2008) and years where sighting data was not available (2007, 2010, 2011, 2014). Zone 1: Southern Samos; Zone 2: Fournoi; Zone 3: Patmos/Arkoi/Lipsi; Zone 4: Agathonisi.
Population density
Although 43% of all dolphin sightings occurred in Zone 1, the Kruskal-Wallis test yielded no significant difference in population density between any transects surveyed (H29=30.01, p>0.05). Densities were highest for common dolphins on the Random to Marathokampos Bay transect (Zone 1; 2.86 individuals/km2) and highest for bottlenose on the Random to Pythagorio Bay transect (Zone 1; 3.07 individuals/km2). However, Kruskal-Wallis tests yielded no significant differences in population density of common dolphins (H20=23, p> 0.05) and bottlenose (H5=5, p>0.05) between transects when tested independently.
Vessel presence
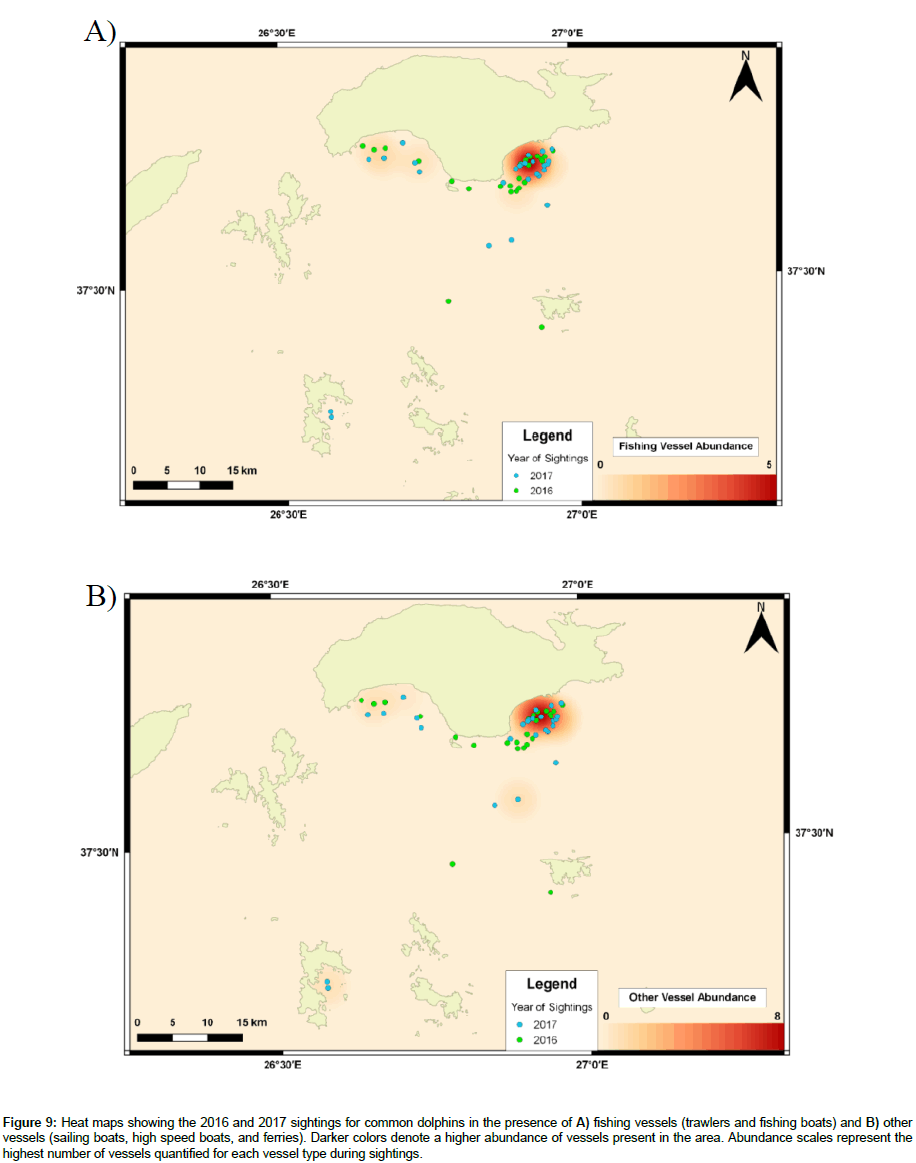
20% of sightings for common dolphins occurred in areas where fishing vessels were present and 30% where other vessels were present (Figure 9 A-B). Comparing years, 25% (2016) and 15% (2017) of sightings occurred in the presence of fishing vessels, and 13% (2016) and 46% (2017) in the presence of other vessels.
Figure 9: Heat maps showing the 2016 and 2017 sightings for common dolphins in the presence of A) fishing vessels (trawlers and fishing boats) and B) other vessels (sailing boats, high speed boats, and ferries). Darker colors denote a higher abundance of vessels present in the area. Abundance scales represent the highest number of vessels quantified for each vessel type during sightings.
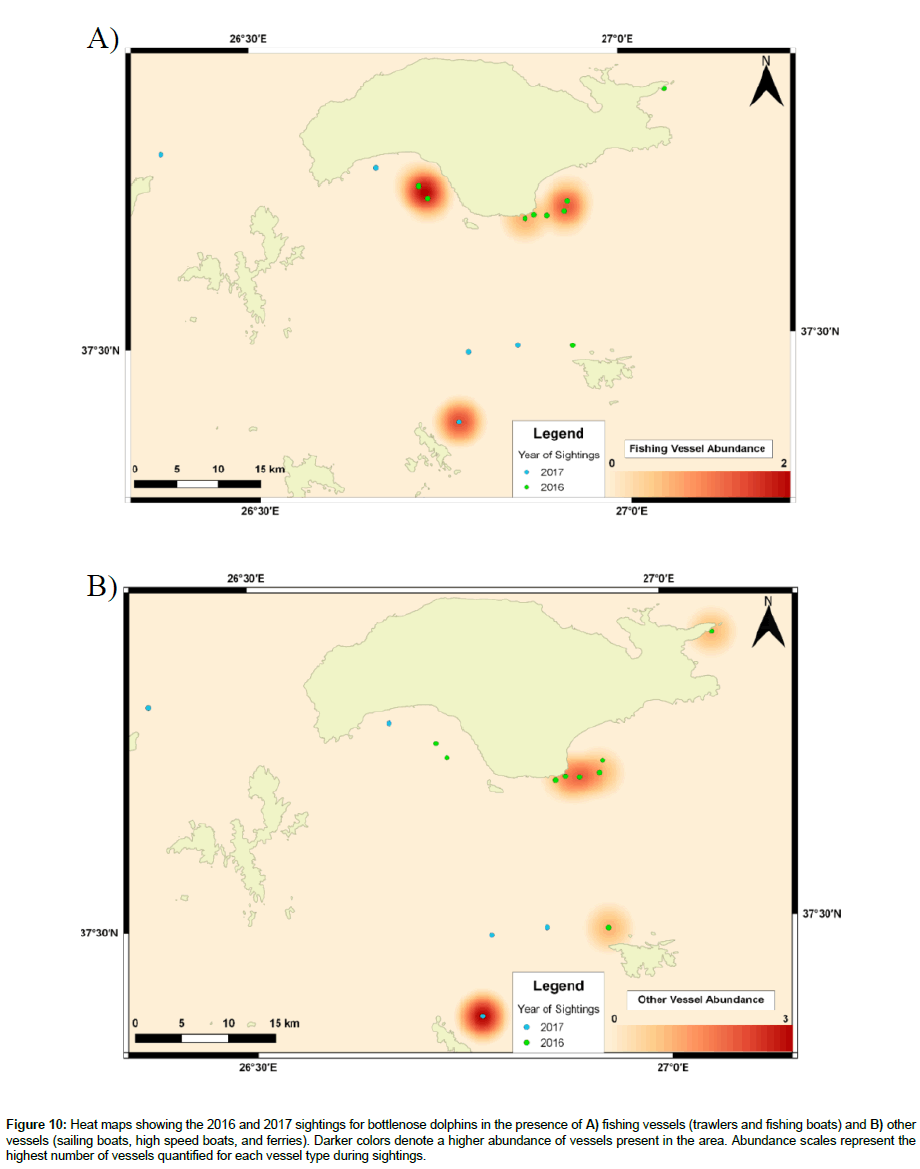
47% of sightings for bottlenose dolphins occurred in areas where fishing vessels were present and 40% where other vessels were present (Figure 10 A-B). Comparing years, 60% (2016) and 20% (2017) of sightings occurred in the presence of fishing vessels, and 50% (2016) and 20% (2017) in the presence of other vessels. Occasionally, both vessel types were present during the same sighting, causing percentages to be higher than expected or over 100%, such for bottlenose dolphins in 2016.
Figure 10: Heat maps showing the 2016 and 2017 sightings for bottlenose dolphins in the presence of A) fishing vessels (trawlers and fishing boats) and B) other vessels (sailing boats, high speed boats, and ferries). Darker colors denote a higher abundance of vessels present in the area. Abundance scales represent the highest number of vessels quantified for each vessel type during sightings.
Results of the Kolmogorov-Smirnov test, to determine relationships between dolphin and vessel abundance, transect, season and year, are reported in Table 4.
| Species | ||
|---|---|---|
| 2016 | Common | Bottlenose |
| Abundance of Dolphins per Sighting/Abundance of Vessels | p<0.0001 | p>0.05 |
| Transect/Abundance of Dolphins per Sighting | p<0.001 | p>0.05 |
| Transect /Abundance of Vessels | p<0.0001 | p<0.05 |
| Season/Abundance of Dolphins per Sighting | p<0.0001 | p>0.05 |
| Season/Abundance of Vessels | p>0.05 | p>0.05 |
| 2017 | ||
| Abundance of Dolphins per Sighting/Abundance of Vessels | p<0.001 | p>0.05 |
| Transect/Abundance of Dolphins per Sighting | p>0.05 | p>0.05 |
| Transect/Abundance of Vessels | p<0.05 | p>0.05 |
| Season/Abundance of Dolphins per Sighting | p<0.0001 | p>0.05 |
| Season/Abundance of Vessels | p>0.05 | p>0.05 |
| Between Years | ||
| Abundance of Dolphins per Sighting | p<0.0001 | p>0.05 |
| Abundance of Vessels | p<0.0001 | p>0.05 |
| Abundance of Dolphins per Sighting/Abundance of Vessels | p<0.0001 | p>0.05 |
| Transect/Abundance of Dolphins per Sighting | p<0.001 | p>0.05 |
| Transect/Abundance of Vessels | p<0.0001 | p<0.05 |
| Season/Abundance of Dolphins per Sighting | p<0.0001 | p<0.05 |
| Season/Abundance of Vessels | p<0.0001 | p>0.05 |
| Season/Abundance of Dolphins per Sighting/Abundance of Vessels | p<0.0001 | p>0.05 |
| Season/Transect/Abundance of Dolphins per Sighting | p<0.001 | p>0.05 |
| Season/Transect/Abundance of Vessels | p<0.0001 | p<0.05 |
Table 4: Summary table of the results for the non-parametric Kolmogorov-Smirnov test, with a Bonferroni correction, for both common and bottlenose dolphins. 2016 and 2017 datasets were used.
Stakeholder interviews
Fishermen: 83% of participants fish more than three times a week in the same locations (South-east Samos and Lipsi), ranging from less than 1 km to 5 km from shore. While fishing, 83% of fishermen encounter dolphins with the majority being bottlenose, however, two participants have encountered both species. 80% of fishermen encountering dolphins, responded they encounter less than 5, while 20% encounter 5-10. These encounters do not last the entire fishing period, but 0-2 hrs. 100% of participants do not use deterrents, but mentioned they knew of people that had. 40% of fishermen encountering dolphins, stated dolphins have never been caught in their equipment, however, 60% responded dolphins have, primarily bottlenose. If the dolphin was alive, it was released, but often the dolphin was already dead. When asked about awareness regarding dolphin conservation, 50% were aware. It was echoed across those that were unaware, that although dolphins may be important, fishermen also need protection. Finally, 67% of fishermen agreed conservation should be implemented for the dolphins. Participant 6, who was opposed to conservation stated, “…as fish stocks deplete, more problems arise between fishermen and dolphins, due to resource competition.”
Authority: Informing local fishermen, implementing fishing laws, and regularly conducting patrols, were actions performed by authority members to make certain fishermen are compliant. When asked how they make sure fishermen comply with dolphin conservation regulations, 67% stated they inform the local fishermen and provide educational opportunities to learn about protection/conservation efforts. Those remaining did not know. 83% of individuals conduct either one patrol or more than three a week, which include day/night shifts and the use of boats and/or vehicles. When fishermen are not abiding laws, they are fined and in extreme cases have their fishing license revoked and/or arrested. However, Participant 2 stated, “…I speak to the fishermen first to tell them what they are doing wrong, giving them a chance to change their ways.” 100% of participants were aware of dolphin conservation efforts and agreed efforts should be implemented for dolphins. Participant 6 stated, “…conservation of animals is important, but the most important factor in all of this, is education and how to educate fishermen…”
Community: 100% of participants could identify all types of marine mammals inhabiting the EAS: dolphins, whales, and seals. However, knowledge of the four dolphin species ranged; only 17% knew all four (striped, bottlenose, common, and Risso’s). When asked about fishing, 83% of participants agreed with catch limits for locals and the fishing industry, with many stating limits will prevent overfishing, helping conserve marine mammals. Participant 4 stated, “…There should be no limit for fishermen with small boats, as they can’t catch very much, but for bigger fishermen and the fishing industry, there should be a limit…Larger fishing boats use big nets and destroy the seabed, causing damage, and could potentially catch other marine organisms.” When asked about interactions between the fishing industry and dolphin conservation efforts, 67% have observed interactions, with 75% of those being negative. In these cases, fishermen were reported to have been angry with the dolphins and would sometimes attempt to kill them, by shooting them or using dynamite. In the case of the single positive interaction, Participant 6 stated, “…fishermen enjoy taking pictures of dolphins around them when they fish, they don’t all have the mentality that they need to be killed.” When asked about fishing laws, 67% agreed with them, while 33% either disagreed or were unaware. When asked about dolphin conservation awareness and agreement, 67% were aware while 100% agreed with conservation efforts, with some suggesting the need for more marine protected areas and no take zones.
Logistical regressions yielded no significant differences in answers reported across all stakeholder categories for questions regarding awareness of dolphin conservation efforts (p>0.05) and whether conservation should be implemented (p>0.05).
Discussion
MR photo-ID
Although a small region of the EAS was studied for MR photo- ID purposes, identifying both common and bottlenose individuals provides insight to current population statuses. Efforts in 2017 determined 76 new individuals for common dolphins, compared to individuals marked in 2015, which may indicate immigration and/or births within this population, known as an open population [47]. In addition, recaptures may further indicate individuals are residential to the area, especially when recaptured across multiple years, suggesting the dolphins do not travel great distances, but rather stay in localized areas [34,48]. This could be the case for the eight common dolphins captured in 2017 survey efforts and matched to individuals marked in 2015. Seven of the eight were sighted in different months in 2015 (July, August, September, November), further supporting they may be residential, as residential populations of common dolphins have been found within the MS, such as the Alboran Sea [49,50].
Although numbers of individuals estimated during sightings were generally larger than numbers of new individuals identified, the Random Pythagorio Bay survey on May 17, estimated numbers to be lower than that identified after photo-ID analysis. This may be because individuals were in close proximity to one another and were unable to be distinguished when estimates were recorded. Photographic review allowed the determination of group size to be larger than that estimated, supporting benefits of MR photo-ID methodologies.
Though no individuals were recaptured, and no new individuals were identified for bottlenose dolphins, their numbers were low for each sighting, signifying there may not have been immigration to the area or births for this population. However, literature suggests group size to be influenced by age, sex, reproductive maturity, and resource availability [51,52]. This may provide reason as to why low numbers of bottlenose dolphins were encountered- resources were not available or dolphins were not sexually mature. Additionally, Bearzi et al. [53] determined average bottlenose dolphin group sizes in the Adriatic Sea to be seven. Both the EAS and Adriatic are relatively small seas within the MS, and both seem to support small groups of bottlenose populations, suggesting group size may also be influenced by sea size, possibly because smaller regions have less food availability.
Since survey efforts were low, the study area was not wide-ranging, not all photographs were of sufficient quality, and not all individuals encountered were photographed, numbers of new individuals marked and recaptured may be lower than expected. Furthermore, time of day when surveys were conducted and weather conditions, may have influenced sightings and numbers of individuals encountered [54].
Population abundance estimates
Estimates were higher for common dolphins in 2017 compared to 2015. However, estimates may not accurately represent the entire population of both species, as survey efforts were not rigorous and not all individuals encountered were photographed. For instance, 2017 bottlenose populations could not be estimated because of insufficient data, which may be because the study area did not cover the entire region, but rather multiple overlapping transects, increasing bias. Though these dolphin populations are semi-isolated, they may be transient within the region, specifically bottlenose as they were sighted less frequently. Conn et al. [55] found similar trends for bottlenose dolphins in Florida, where identified transient individuals were usually only sighted once. Furthermore, increasing survey efforts and the study area, by adding additional transects between Samos and Lipsi, may provide more accurate estimates- data would be more representative of the entire region, providing better confidence in the estimated values.
Mortality rates may have also influenced estimates. Values used were not exact for EAS populations; they were obtained from literature pertaining to populations in other regions of the world or were based upon estimates from a time span [39,40]. Furthermore, these populations may be influenced by other factors, different from those in the EAS, further impacting mortality rates. This in turn could cause estimates for this study to be different than actual abundances if mortality rates in the EAS are unlike those obtained from literature. Similarly, mortality rates from literature may not accurately represent all deaths occurring by either natural or anthropogenic causes. Wilson et al. [39] states the minimum annual mortality rate of the bottlenose population in Scotland was 2.3% because they were unable to recover all dolphins which died during the study, implying mortality rates could have been higher. Therefore, mortality rates for this study area are needed in determining more accurate population estimates.
Though only two years of data were used for estimates, values for overlapping years between the two datasets differed by a minimum of 24, for 2017, and maximum of 31, for 2025, for common dolphins. This may be because more individuals were re-marked in 2015 compared to 2017, as more surveys were conducted that year, or the population was smaller. Moreover, literature suggests abundance estimate calculations to underestimate known population sizes, in addition to variance decreasing with more recaptures occurring over time [28].
Population distribution
Multiple studies in the MS have found common dolphins residing in waters ranging in depth from 150-2,000 m [56-58]. In this study, the distribution for common dolphins occurred primarily around the Southern Samos region and Fournoi Island. The depth in these locations ranges from about 40-100 m, indicating populations to prefer coastal or shallower waters [59]. Additional studies, such as that conducted by Cañadas et al. [12] found similar depth ranges, in which common dolphins showed preference to shallow areas. However, in this study some sightings occurred in areas away from coastlines and shallow depths, such as that which occurred around the Northern region of Ikaria, ranging 500-1,000 m [59]. This sighting may suggest other factors influencing the dolphins’ distribution such as distribution/abundance of prey, sea surface temperatures, and the presence of calves/juveniles [60]. For example, sightings along the Samos coastline may indicate the presence of calves/juveniles within the populations; however, further research is needed to determine whether distribution is age related. Additionally, sightings in deeper depths and further out at sea, may indicate populations traveling to follow prey or removing themselves from disturbances in the area. Markoglou et al. [61] found sardine presence in the EAS to influence where common dolphins were sighted; more sightings occurred when sardines were present.
Although many factors can influence distribution and sighting numbers of common dolphins, sightings around the South-eastern region of Samos may be influenced by sampling efforts. Unequal replications of transects occurred, allowing one area to have more sightings than another. In addition, many transects overlap, permitting the same general region to be surveyed multiple times. For this reason, the survey area needs to be expanded to see if dolphins are distributed in areas currently unknown.
In previous MS studies, bottlenose dolphins have been sighted in depths ranging 70-900 m [57,58,62]. These depths are like those where sightings occurred in this study, generally greater than 100 m but less than 1,000 m [59]. Preference of bottlenose dolphins to shallow waters could be linked to feeding habits and the organisms they prey upon, including those of the benthos (cephalopods/fish) [20,63]. However, two genetically different ecotypes of bottlenose dolphins exist; one preferring shallow/coastal areas and another preferring offshore areas [64-66]. Although an ecotype has not been specified within the MS, locations of most sightings may indicate populations encountered to be like those of the shallow water/coastal ecotype. Additionally, distribution may be linked not only to biotic factors, but to human activities, which may influence foraging and swimming behaviors, such as overfishing, chemical pollution, and vessel traffic [10,34,67].
In recent years, both species showed preference towards the Southern Samos region. Occurrences may have been highest here because the habitat was optimal, and disturbances were not threatening. However, there was no identifiable pattern to distribution, just distinguishable shifts. Further research, implementing season specific surveys, may provide insight to seasonal distributions. Balmer et al. [68] studied movements of bottlenose dolphins in Florida, where those seen in spring/autumn were identified as visitors and those seen in winter/summer were considered year-round residents. Similarly, studies conducted by Cañadas and Hammond [60] in the MS, and Neumann [69] in New Zealand, determined seasonal distribution for common dolphins. In the MS, dolphins were found in lower densities in winter months, indicating groups moved further off coast towards deeper waters. In New Zealand, comparable patterns were observed; dolphins moved offshore during autumn/winter and inshore during spring/summer. Similar results may be obtained within this study area if surveys are conducted seasonally.
Population density
Results indicated no significant differences in population densities between transects. Estimated abundances between transects did not substantially differ, possibly because the dolphins do not prefer one location to another. Four transects overlap, so dolphins are being sighted on a different transect but in the same general location, potentially causing one transect to have higher densities than another. However, anomalies may have occurred during sightings where higher abundances of dolphins were estimated than were present. In one instance, 18 bottlenose dolphins were estimated in a sighting, whereas in previous surveys they were generally seen in groups estimated to be 1-8. For this survey, estimates may have been higher than actual abundances, causing population densities to be higher than expected, but not enough to cause significant differences between transects. This may be a similar occurrence for common dolphins as two surveys estimated 34 and 35 individuals, but previous surveys estimated 1-25.
Even though densities were insignificant between transects, they were highest for common dolphins on the Random to Pythagorio Bay transect. Though this transect has high vessel traffic due to its proximity to the marina, the dolphins may be acclimated or have shown behavioral learning, so they no longer feel harmed or threatened when traffic increases [70]. Densities were highest for bottlenose dolphins on the Random Aspros Kavos transect, but because bottlenose dolphins were sighted with less frequency, they may not be as accustomed to vessel traffic, frequenting areas with fewer pressures which may not include areas currently surveyed. In addition, other factors could have influenced abundances and therefore population densities, including anthropogenic stresses (pollution/excessive noise) and prey distribution [71,72].
Vessel presence
Dolphins were sighted in the presence of both fishing and other vessels, however bottlenose dolphins were sighted most in the presence of fishing, whereas common dolphins varied. This may suggest fishing vessels were targeting organisms bottlenose dolphins prey upon, as the case of bottlenose interactions with trawlers studied by Gonzalvo et al. [73]. Additionally, this suggests bottlenose dolphins avoid other vessel types. Papale et al. [74] concluded bottlenose dolphins flee in the presence of large vessels which do not alter speed and direction and avoid powered engine and fishing boats coming within 200 m. However, dolphins occasionally trailed trawlers, while sailing boats caused no change to their distribution. This research supports the idea that vessel size and type may affect dolphin distribution. This study region is semi-isolated, so dolphins may be more habituated to VP, however, more research is necessary to confirm this.
Areas of high VP for common dolphins occurred near the South-eastern region of samos, near the marina. Heat maps show sighting locations in 2017 to be like those of 2016. However, this may be biased, as vessels frequently leave and return to dock, causing VP to be higher here than other survey locations, or suggests common dolphin populations to be habituated towards VP. For bottlenose dolphins, areas of high VP occurred near Marathokampos Bay and Northern Arkoi. Nevertheless, 2017 sightings suggest bottlenose dolphins have moved away from areas where vessels are present, compared to 2016 sightings.
During some sightings, both vessel types were present. Results suggest common dolphins to be more effected by VP than bottlenose as they were sighted only 50% of the time in areas where vessels were present, compared to 87% for bottlenose dolphins. Results coincide with those found by Neumann and Orams [75], where small groups of common dolphins, less than 57, showed avoidance of boats, compared to larger groups, considered boat-tolerant. This may support why common dolphins were seen with less frequency in the presence of vessels for the current study, as the largest estimate for a sighting was 35 individuals. Additionally, significant differences were found for common dolphins, between and within years, for dolphin abundance and number of boats, further confirming avoidance of vessels by common dolphins. However, this can be contradicting as bottlenose dolphins were sighted less frequently than common dolphins.
Fishing seasons and VP had significant effects on the abundance of common dolphins within and between years. This may be because dolphins benefit from fishing activities, foraging for the same fish targeted by fishermen. Although significance was only found for bottlenose dolphins between years, specific to fishing season, both species are known to associate with fishing practices. Bottlenose are often found along the continental shelf in the MS associating with coastal fisheries, while common often associate with bottom gillnet fisheries and trawlers [20,73,76]. However, a lack of significant results for bottlenose dolphins may be due to low sighting frequency.
Future research would benefit from altered methodology where vessels would be quantified when no sightings occur. This will allow for the determination of whether vessel presence/absence correlates with the presence/absence of dolphins within the study area, providing an indication of whether vessels effect dolphin distribution and abundance.
Stakeholder interviews
Various viewpoints were voiced across each category, but overall, it was determined that conservation efforts need to be implemented for dolphins inhabiting the EAS. Although results showed stakeholder category to have no effect on conservation awareness and views, larger sample sizes may yield different results. Additionally, interviewing more industrial fishermen may provide other viewpoints for consideration. However, it must be recognized that although fishermen agreed with conservation efforts, their livelihoods are at risk. Often, dolphin encounters result in damaged equipment, as the case for gillnet fishermen in Italy, where 68.7% of fishing days occurred damage by dolphins [77]. Equipment repairs may significantly affect these fishermen and costs may rise with increased dolphin encounters, thus affecting their overall income.
Closed questions were used for interviews, possibly biasing results, as participants may not have been able to provide answers accurately representing their viewpoint. Another approach, and one that may be applied to future studies, could include open ended questions, which allow participants to provide whatever information they think necessary to answer questions given, rather than choosing a single answer best fitting their opinion [78]. Furthermore, this study was of short duration, so experimentation with interview methods was not possible. Had more time been available, other methods, such as focus groups, could have been applied before conducting interviews. Focus groups bring multiple individuals together, allowing them to discuss their opinions on subjects presented to them. Benefits are that participants can voice everything they feel represents the topic, their answers are not confined, disagreements can occur, and opinions can be influenced. This may allow for better structured interviews, providing researchers with improved understanding of participant’s knowledge on topics and concepts discussed, helping obtain more accurate results. Although focus groups may serve beneficial, limitations need consideration, such that participants may not fully represent stakeholder categories, data gathered is generally qualitative, so results may be unreliable and subjective, and researchers cannot assess participants individually [78].
Conclusion
This study provides insight to the distribution and population abundances of common and bottlenose dolphins in the EAS and the impact of VP on these populations. Although populations of both dolphin species were documented, their populations may continually fluctuate if conservation efforts are not recognized, human activities, specifically vessel traffic increases within the study area, and fishing laws are not abided and actively enforced. Complementary studies, implementing a larger survey area, are necessary to better understand both species’ population structure and other factors affecting their distribution. Furthermore, more investigation into the socioeconomics, between dolphin conservation and the fishing industry, are needed to further identify how impactive the fishing industry is to these dolphin species and other cetaceans inhabiting the EAS.
Acknowledgements
I would like to thank the Archipelagos Institute of Marine Conservation for allowing me to conduct my research on Samos Island in Greece, as well as boat captains and supervisors, specifically Guido Pietroluongo and Kerstin Klingler, without whom this research would not have been possible. I would also like to thank specifically Dr. Leanne J. Hepburn and Professor David J. Smith, Professors for the University of Essex School of Biological Sciences, who supervised my research and provided support while I was away collecting data. I would like to give a final thank you to those that aided with data collection and analysis including: Niki Karagouni, Cecilia Adam, Emily Doan, Alexandra Hanusch, Célia Fery, Sébastien Saintignan, Synthesa Praharani Ksatrya, and Nguyen Cuu Huong Giang.
References
- Coll M, Piroddi C, Steenbeek J, Kaschner K, Lasram FBR, et al. (2010) The biodiversity of the Mediterranean Sea: estimates, patterns, and threats. PLoS One 5: 1-36.
- Silber GK, Vanderlaan AS, Arceredillo AT, Johnson L, Taggart CT, et al. (2012) The role of the International Maritime Organization in reducing vessel threat to whales: process, options, action and effectiveness. Mar Policy 36: 1221-1233.
- Campana I, Crosti R, Angeletti D, Carosso L, David L, et al. (2015). Cetacean response to summer maritime traffic in the Western Mediterranean Sea. Mar Environ Res 109: 1-8.
- Notarbartolo di Sciara G, Birkun Jr. A (2010) Conserving whales, dolphins and porpoises in the Mediterranean and Black Seas: an ACCOBAMS Status Report, 2010. ACCOBAMS, Monaco: 1-212.
- Boudouresque CF (2004) Marine biodiversity in the Mediterranean: status of species, populations and communities. Sci Rep Port-Cros Natl Park 20: 97-146.
- Bosc E, Bricaud A, Antoine D (2004) Seasonal and interannual variability in algal biomass and primary production in the Mediterranean Sea, as derived from 4 years of SeaWiFS observations. Global Biogeochem Cycles 18: 1-17.
- Bagiorgas HS, Mihalakakou G, Rehman S, Al-Hadhrami LM (2012) Offshore wind speed and wind power characteristics for ten locations in Aegean and Ionian Seas. J Earth Sys Sci 121: 975-987.
- Micheli F, Halpern BS, Walbridge S, Ciriaco S, Ferretti F, et al. (2013) Cumulative human impacts on Mediterranean and Black Sea marine ecosystems: assessing current pressures and opportunities. PLoS One 8: 1-10.
- Courbis S, Timmel G (2009) Effects of vessels and swimmers on behavior of Hawaiian spinner dolphins (Stenella longirostris) in Kealake ‘akua, Honaunau, and Kauhako bays, Hawai‘i. Mar Mamm Sci 25: 430-440.
- Bejder L, Samuels AMY, Whitehead HAL, Gales N, Mann J, et al. (2006) Decline in relative abundance of bottlenose dolphins exposed to long-term disturbance. Conserv Biol 20: 1791-1798.
- Reeves RR, Read AJ, Notarbartolo di Sciara GN (2001) Report of the Workshop on Interactions between Dolphins and Fisheries in the Mediterranean, Evaluation of Mitigation Alternatives. Roma, 4-5 May 2001. ICRAM.
- Cañadas A, Sagarminaga R, García-Tiscar S (2002) Cetacean distribution related with depth and slope in the Mediterranean waters off southern Spain. Deep Sea Res Part 1 Oceanogr Res Pap 49: 2053-2073.
- Bearzi G, Reeves RR, Notarbartolo-Di-Sciara GIUSEPPE, Politi E, Cañadas ANA, et al. (2003) Ecology, status and conservation of short-beaked common dolphins Delphinus delphis in the Mediterranean Sea. Mamm Rev 33: 224-252.
- Bearzi G, Bonizzoni S, Agazzi S, Gonzalvo J, Currey RJ (2011) Striped dolphins and short-beaked common dolphins in the Gulf of Corinth, Greece: Abundance estimates from dorsal fin photographs. Mar Mamm Sci 27: 165-184.
- Bearzi G (2012) Delphinus delphis (Mediterranean subpopulation). The IUCN Red List of Threatened Species 2003: e. T6336A16236707.
- Bianchi CN, Morri C (2000) Marine biodiversity of the Mediterranean Sea: situation, problems and prospects for future research. Mar Pollut Bull 40: 367-376.
- Bearzi G, Fortuna C, Reeves R (2012) Tursiops truncatus (Mediterranean subpopulation). The IUCN Red List of Threatened Species 2012: e. T16369383A16369386.
- Marino L, Lilienfeld SO (2007) Dolphin-assisted therapy: More flawed data and more flawed conclusions. Anthrozoös 20: 239-249.
- Nowacek DP, Thorne LH, Johnston DW, Tyack PL (2007) Responses of cetaceans to anthropogenic noise. Mamm Rev 37: 81-115.
- Bearzi G (2002) Interactions between cetacean and fisheries in the Mediterranean Sea. Cetaceans of the Mediterranean and Black Seas: state of knowledge and conservation strategies. A Report to the ACCOBAMS Secretariat, Monaco 9: 1-20.
- Guisan A, Thuiller W (2005) Predicting species distribution: offering more than simple habitat models. Ecol Lett 8: 993-1009.
- Amaral AR, Beheregaray LB, Bilgmann K, Boutov D, Freitas L, et al. (2012) Seascape genetics of a globally distributed, highly mobile marine mammal: the short-beaked common dolphin (genus Delphinus). PLoS One 7: 31482.
- Degrati M, Dans SL, Garaffo GV, Cabreira AG, Machado FC, et al. (2013) Sequential foraging of dusky dolphins with an inspection of their prey distribution. Mar Mamm Sci 29: 691-704.
- Eierman LE, Connor RC (2014) Foraging behavior, prey distribution, and microhabitat use by bottlenose dolphins Tursiops truncatus in a tropical atoll. Mar Ecol Prog Ser 503: 279-288.
- Parra GJ, Corkeron PJ, Marsh H (2006) Population sizes, site fidelity and residence patterns of Australian snubfin and Indo-Pacific humpback dolphins: Implications for conservation. Biol Cons 129: 167-180.
- Speakman TR, Lane SM, Schwacke LH, Fair PA, Zolman ES (2010) Mark-recapture estimates of seasonal abundance and survivorship for bottlenose dolphins (Tursiops truncatus) near Charleston, South Carolina, USA. J Cetacean Res Manag 11: 153-162.
- Wang JY, Yang SC, Fruet PF, Daura-Jorge FG, Secchi ER (2012) Mark-recapture analysis of the critically endangered eastern Taiwan Strait population of Indo- Pacific humpback dolphins (Sousa chinensis): Implications for conservation. Bull Mar Sci 88: 885-902.
- Wells RS, Scott MD (1990) Estimating bottlenose dolphin population parameters from individual identification and capture-release techniques. Report of the International Whaling Commission 12: 407-415.
- Sutaria D, Marsh H (2011) Abundance estimates of Irrawaddy dolphins in Chilika Lagoon, India, using photo-identification based mark-recapture methods. Mar Mamm Sci 27: 338-348.
- Speed CW, Meekan MG, Bradshaw CJ (2007) Spot the match–wildlife photo- identification using information theory. Front Zool 4: 1-11.
- Lewison RL, Crowder LB, Read AJ, Freeman SA (2004) Understanding impacts of fisheries bycatch on marine megafauna. Trends Ecol Evol 19: 598- 604.
- Bearzi G, Agazzi S, Gonzalvo J, Bonizzoni S, Costa M, et al. (2010) Biomass removal by dolphins and fisheries in a Mediterranean Sea coastal area: do dolphins have an ecological impact on fisheries? Aquat Conserv 20: 549-559.
- Crosti R, Arcangeli A, Romeo T, Andaloro F (2017) Assessing the relationship between cetacean strandings (Tursiops truncatus and Stenella coeruleoalba) and fishery pressure indicators in Sicily (Mediterranean Sea) within the framework of the EU Habitats Directive. Eur J Wildl Res 3: 1-13.
- Gnone G, Bellingeri M, Dhermain F, Dupraz F, Nuti S, et al. (2011) Distribution, abundance, and movements of the bottlenose dolphin (Tursiops truncatus) in the Pelagos Sanctuary MPA (north-west Mediterranean Sea). Aquat Conserv 21: 372-388.
- Birkemeier B, Lonsdale H (2016). “Marine mammal team boat survey booklet: conduction of boat surveys and data processing.” Archipelagos, Institute of Marine Conservation, Samos, Greece.
- Archipelagos Institute of Marine Conservation (2016). “Photo-ID Protocol.” Archipelagos Institute of Marine Conservation, Samos, Greece.
- Seber GA (1986) A review of estimating animal abundance. Biom 42: 267-292.
- Krebs CJ (1999) Ecological Methodology. Addison Wesley Educational Publishers Inc., Menlo Park, California, USA.
- Wilson B, Hammond PS, Thompson PM (1999) Estimating size and assessing trends in a coastal bottlenose dolphin population. Ecol Appl 9: 288- 300.
- Reeves R, Notarbartolo di Sciara G (2006) The Status and Distribution of Cetaceans in the Black Sea and Mediterranean Sea: Workshop Report-Monaco 5-7 March 2006. IUCN Centre for Mediterranean Cooperation, Malaga, Spain.
- Barlow J, Swartz SL, Eagle TC, Wade PR (1995) US marine mammal stock assessments: Guidelines for preparation, background, and a summary of the 1995 assessments. U.S. Department of Commerce, NOAA Technical Memorandum NMFS-OPR-95-6: 1-80.
- Waring GT, Josephson E, Maze-Foley K, Rosel PE (2013) US Atlantic and Gulf of Mexico Marine Mammal Stock Assessments- 2012.
- Quantum GIS Development Team (2017) Quantum GIS Geographic Information System. Open Source Geospatial Foundation Project.
- Cabin RJ, Mitchell RJ (2000) To Bonferroni or not to Bonferroni: when and how are the questions. Bull Ecol Soc Am 81: 246-248.
- http://www.minagric.gr/index.php/en/
- R Core Team (2017) R: A language and environment for statistical computing. R Foundation for Statistical Computing, Vienna, Austria.
- Fearnbach H, Durban J, Parsons K, Claridge D (2012) Photographic mark–recapture analysis of local dynamics within an open population of dolphins. Ecol Appl 22: 1689-1700
- Maze KS, Würsig B (1999) Bottlenosed dolphins of San Luis Pass, Texas: Occurrence patterns, site-fidelity, and habitat use. Aquat Mamm 25: 91-103.
- Notarbartolo di Sciara G (2002) Cetacean species occurring in the Mediterranean and Black Seas: an ACCOBAMS Status Report, 2002. ACCOMBAS, Monaco: 1-18.
- Tudela S, Kai AK, Maynou F, El Andalossi M, Guglielmi P (2005) Driftnet fishing and biodiversity conservation: the case study of the large-scale Moroccan driftnet fleet operating in the Alboran Sea (SW Mediterranean). Biol Conserv 121: 65-78.
- Wiirsig B (1986) Dolphin Cognition and Behavior: A comparative approach. Lawrence Erlbaum Associates Inc., Hillsdale, New Jersey, Canada.
- Wells RS, Scott MD, Irvine AB (1987). Current Mammalogy: The social structure of free-ranging bottlenose dolphins. (1st edtn), Springer, Boston, USA.
- Bearzi G, Notarbartolo-DI-Sciara G, Politi E (1997) Social ecology of bottlenose dolphins in the Kvarnerić (northern Adriatic Sea). Mar Mamm Sci 13: 650-668.
- Stockin KA, Pierce GJ, Binedell V, Wiseman N, Orams MB (2008) Factors affecting the occurrence and demographics of common dolphins (Delphinus sp.) in the Hauraki Gulf, New Zealand. Aquat Mamm 34: 200-211.
- Conn PB, Gorgone AM, Jugovich AR, Byrd BL, Hansen LJ (2011) Accounting for transients when estimating abundance of bottlenose dolphins in Choctawhatchee Bay, Florida. J Wildl Manage 75: 569-579.
- Frantzis A, Alexiadou P, Paximadis G, Politi E, Gannier A, et al. (2003) Current knowledge of the cetacean fauna of the Greek Seas. J Cetacean Res Manag 5: 219-232.
- Azzellino A, Gaspari S, Airoldi S, Nani B (2008) Habitat use and preferences of cetaceans along the continental slope and the adjacent pelagic waters in the western Ligurian Sea. Deep Sea Res Part 1 Oceanogr Res Pap 55: 296-323.
- Dede A, Saad A, Fakhri M, Öztürk B (2012) Cetacean sightings in the Eastern Mediterranean Sea during the cruise in summer 2008. J Black Sea Mediterr Environ 18: 49-57.
- NOAA National Centers for Environmental Information (2004) Multi beam Bathymetry Database (MBBDB). NOAA National Centers for Environmental Information, 2016.
- Cañadas A, Hammond PS (2008) Abundance and habitat preferences of the short-beaked common dolphin Delphinus delphis in the southwestern Mediterranean: implications for conservation. Endanger Species Res 4: 309-331.
- Markoglou E, Frantzis A, Valavanis VD, Alexiadou P, Kalaitzidis C, et al. (2015) Habitat suitability of short-beaked common dolphin in the Aegean and Ionian Seas in relation to sardine presence. 11th Panhellenic Symposium on Oceanography and Fisheries, Mytilene, Lesvos Island, Greece.
- Notarbartolo di Sciara G, Venturino MC, Zanardelli M, Bearzi G, Borsani FJ, et al. (1993) Cetaceans in the central Mediterranean Sea: distribution and sighting frequencies. Ital J Zool 60: 131-138.
- Fernandez R, Santos MB, Carrillo M, Tejedor M, Pierce GJ (2009) Stomach contents of cetaceans stranded in the Canary Islands 1996-2006. J Mar Biol Assoc UK 89: 873-883.
- Mead JG, Potter CW (1995) Recognizing two populations of the bottlenose dolphin (Tursiops truncatus) off the Atlantic coast of North America: morphologic and ecologic considerations. IBI reports 5: 31-44.
- Hoelzel AR (1998) Genetic structure of cetacean populations in sympatry, parapatry, and mixed assemblages: implications for conservation policy. J Hered 89: 451-458.
- Torres LG, Rosel PE, D'Agrosa C, Read AJ (2003) Improving management of overlapping bottlenose dolphin ecotypes through spatial analysis and genetics. Mar Mamm Sci 19: 502-514.
- Balmer BC, Schwacke LH, Wells RS, Adams JD, Clay George R, et al. (2013) Comparison of abundance and habitat usage for common bottlenose dolphins between sites exposed to differential anthropogenic stressors within the estuaries of southern Georgia, USA. Mar Mamm Sci 29: 114-135.
- Balmer BC, Wells RS, Nowacek SM, Nowacek DP, Schwacke LH, et al. (2008) Seasonal abundance and distribution patterns of common bottlenose dolphins (Tursiops truncatus) near St. Joseph Bay, Florida, USA. J Cetacean Res Manag 10: 157-167.
- Neumann DR (2001) Seasonal movements of short-beaked common dolphins (Delphinus delphis) in the north-western Bay of Plenty, New Zealand: influence of sea surface temperature and El Niño/La Niña. N Z J Mar Freshwater Res 35: 371-374.
- Wright AJ, Soto NA, Baldwin AL, Bateson M, Beale CM, et al. (2007) Do marine mammals experience stress related to anthropogenic noise? Int J Comp Psychol 20: 274-316.
- Gomez-Salazar C, Trujillo F, Portocarrero-Aya M, Whitehead H (2012) Population, density estimates, and conservation of river dolphins (Inia and Sotalia) in the Amazon and Orinoco river basins. Mar Mamm Sci 28: 124-153.
- Buckstaff KC, Wells RS, Gannon JG, Nowacek DP (2013) Responses of bottlenose dolphins (Tursiops truncatus) to construction and demolition of coastal marine structures. Aquat Mamm 39: 174-186.
- Gonzalvo J, Valls M, Cardona L, Aguilar A (2008) Factors determining the interaction between common bottlenose dolphins and bottom trawlers off the Balearic Archipelago (western Mediterranean Sea). J Exp Mar Bio Ecol 367: 47-52.
- Papale E, Azzolin M, Giacoma C (2012) Vessel traffic affects bottlenose dolphin (Tursiops truncatus) behaviour in waters surrounding Lampedusa Island, south Italy. J Mar Biol Assoc UK 92: 1877-1885.
- Neumann DR, Orams MB (2006) Impacts of ecotourism on short-beaked common dolphins (Delphinus delphis) in Mercury Bay, New Zealand. Aquat Mamm 32: 1-9.
- Powell JR, Wells RS (2011) Recreational fishing depredation and associated behaviors involving common bottlenose dolphins (Tursiops truncatus) in Sarasota Bay, Florida. Mar Mamm Sci 27: 111-129.
- Díaz López B (2006) Interactions between Mediterranean bottlenose dolphins (Tursiops truncatus) and gillnets off Sardinia, Italy. ICES J Mar Sci 63: 946-951.
- Groves RM, Fowler Jr. FJ, Couper MP, Lepkowski JM, Singer E, et al. (2011) Survey Methodology. (2nd edtn), John Wiley & Sons Inc., New Jersey, Canada.
 Spanish
  Chinese
  Russian
  German
  French
  Japanese
  Portuguese
  Hindi
Hindi 