Research Article, Int J Cardiovasc Res Vol: 8 Issue: 2
Effect of Vagus Nerve Stimulation on Tissue Damage and Function Loss in a Mouse Myocardial Infarction Model
MGJ Nederhoff1*, SAMW Verlinde1, T van Zuuren1, G Pasterkamp2 and RLAW Bleys1
1Anatomy Department, University Medical Center Utrecht, Utrecht University, Utrecht, The Netherlands
2Experimental Cardiology Laboratory, University Medical Center Utrecht, Utrecht University, Utrecht, The Netherlands
*Corresponding Author : MGJ Nederhoff
Department of Anatomy, University Medical Center Utrecht, Room Str.0.201 P.O. Box 85060, 3508AB, Utrecht, The Netherlands
Tel: +31887568317
Fax: +31887569030
E-mail: m.g.j.nederhoff@umcutrecht.nl
Received: January 28, 2019 Accepted: March 14, 2019 Published: March 25, 2019
Citation: Nederhoff MGJ, Verlinde SAMW, van Zuuren T, Bleys RLAW, Pasterkamp G (2019) Effect of Vagus Nerve Stimulation on Tissue Damage and Function Loss in a Mouse Myocardial Infarction Model. Int J Cardiovasc Res 8:2. doi: 10.4172/2324-8602.1000376
Abstract
Introduction
Autonomic regulation of immune functions has increasingly been studied in recent decades. The attenuating effect of the parasympathetic nervous system on inflammatory processes is demonstrated in studies on inflammatory disease like rheumatoid arthritis, chronic bowel disease and heart failure. Similar inflammatory processes play a role in the development of tissue damage following myocardial infarction (MI). In this study, effects of vagus nerve stimulation (VS) on tissue damage and function loss after MI in the mouse heart were measured.
Methods
Anaesthetized male C57Bl6 mice were treated with or without 30 seconds of VS prior to experimental MI. Baseline and terminal heart function were studied. After 48 hours animals were sacrificed and infarct size and presence of inflammatory cells in different locations in the infarcted heart were determined. Inflammatory responsiveness and inflammatory cells in the blood were measured as well.
Results
The differences in ejection fraction and infarct size were found to be not significant. Counts of T-lymphocytes and macrophages were equal on baseline and at termination. Neutrophil counts were higher in the area remote from the infarction in the MI group compared to that in the VS+MI group. VEGF amounts were not different in the infarcted hearts of MI as compared to the hearts of VS+MI treated mice.
Conclusion
Ejection fraction decreased at 48 hours, less in the VS+MI group than in MI alone. However, this decrease, compared between groups was not significantly different. Although values of infarct size and cardiac function come close to significant reduction this study does not show clear proof for an inhibiting effect of VS on MI injury or function loss. Since the limited time period after MI could be of influence on the variation in the data future research is necessary to provide more information on the development of tissue damage and functional reduction.
Keywords: Myocardial infarction; Ischemia; Inflammation; Vagus nerve stimulation; Autonomic nerve system; Mouse
Introduction
Myocardial ischemia (MI) triggers an inflammatory response in the peri-infarct area with the aim of repairing injured tissue and removing cellular debris. In many cases however, patients recovering from MI remain in a delicate situation because of the development of ventricular remodeling and heart failure.
Inflammatory activity plays a crucial role in both the development of cardiovascular disease (CVD) and function loss in later stages of CVD [1,2]. This inflammatory activity itself, however, appears to be balanced by the autonomic nerve system (ANS). Accumulating evidence shows the modulating effects of the ANS in which sympathetic innervation is generally associated with an increased, and the parasympathetic with an attenuated inflammatory response [3,4]. As a consequence, the risk for CVD increases with an enhanced sympathetic and a lowered parasympathetic tone. Keeping an autonomic balance is essential in cardiac health maintenance, especially when a serious threat like a MI elicits a strong inflammatory response.
Electrical stimulation of the vagus nerve (VS) increases parasympathetic activity, while, at the same time, it decreases the sympathetic tone [5,6]. As found in recent studies, VS strongly attenuates inflammatory responsiveness in experimental sepsis [7], inflammatory bowel disease [8], heart failure [9] and rheumatoid arthritis [10]. Apart from this effect VS attenuates development of edema [11] and stimulates vasodilation and angiogenesis [12].
Upon VS a marked decrease in plasma levels of inflammatory cytokines such as TNFα, IL-1β and IL6 was found. These cytokines also play an important role in atherogenesis and MI. It is largely unknown how parasympathetic nerve stimulation influences the acute inflammatory response following myocardial inflammation.
In the effectiveness of VS the main factor is the release of acetylcholine and therefore the process has been named the Cholinergic Anti-inflammatory Pathway. This pathway describes how cytokines are released when a physical threat like a pathogen, an injury or ischemia initiates an inflammatory response. This activity is sensed by afferent vagal branches that transport a signal to vagal nuclei in the brain. In those nuclei the signal is processed and an inhibiting signal is sent back through efferent fibers in the vagus nerve. Upon this signal acetylcholine (ACh) is released, blocking the α7-subunits of nicotinic ACh-receptors (α7-nAChR) on inflammatory cells. This block inhibits inflammatory cytokine release and thus prevents excessive inflammation [13-15]. We hypothesize that VS has the potency to attenuate the inflammatory response that occurs after MI which may lead to a better recovery of the heart function.
So far patients surviving an initial MI are often still in the danger zone caused by ventricular arrhythmia, remodelling of the left ventricle and development of chronic heart failure. Obviously an effective therapy to prevent excessive loss of viable myocardial tissue would be of great value. In this respect the parasympathetic nerve system could be a means to prevent excessive damage after MI but crucial information about mutual influence of the ANS and inflammation is still lacking.
We hypothesized that VS reduces excessive tissue damage and cardiac function loss after MI. The increase of vagal tone, causing vasodilation and angiogenesis, combined with a decrease of inflammation and reduction of edema formation, can be of great therapeutic value for patients recovering from MI. We therefore examined cardiac function and the size of the infarcted area in mice that underwent VS or sham-VS prior to permanent occlusion of the left anterior descending coronary artery (LAD). Additionally we studied the presence of inflammatory cells and the amount of vascular endothelial growth factor (VEGF) in the infarcted heart.
Methods
Animals
Sample size was calculated with G* power [16]. Forty five male C57Bl/6j mice were used (Charles River Laboratories Maastricht, the Netherlands). The average weight was 27 ± 1 gram and the mice received regular chow as well as water ad libitum. All animal procedures were performed in accordance with the Guide for the Care and Use of Laboratory Animals, with prior approval by the Animal Ethical Experimentation Committee, Utrecht University, The Netherlands.
Euthanasia
After 48 hours animals were euthanized by bleeding under general anaesthesia with FDD-mix (Fentanyl 0.05 mg/kg, Domitor 0.5 mg/kg, Dormicum 5 mg/kg). The abdomen was opened and a maximum of left ventricular blood was drawn through the diaphragm from the cardiac apex. When this maximum volume of blood was collected, the heart was excised for further examination.
Animals that reached a humane endpoint during the experiment were also sacrificed using the same method.
Experimental setup
Three experimental groups were defined. The first group (MI) underwent both MI and sham-VS while a second group (VS+MI) received MI preceded by VS. A third group (VS) received VS plus sham-MI. The mice were randomly assigned to one of the groups in such a way that the MI, VS+MI and VS contained 17, 17 and 11 animals respectively. To examine the effect of vagus nerve stimulation cardiac function was measured as well as infarct size and the presence of inflammatory cells. All animals were terminated 48 hours after surgery by bleeding under complete anaesthesia. The time point of 48 hours was chosen because the first response of neutrophils should still be visible just like the inhibited inflammatory response as shown by plasma TNFα levels. Blood was collected in anti-coagulated tubes for determination of inflammatory responsiveness by measuring plasma levels of TNF-α. A small volume of blood was used for circulating cell counts. The hearts from 9 mice of MI and VS+MI and 6 from the VS group were excised to be examined for inflammatory cells and VEGF. Eight hearts of the MI and VS+MI and 5 hearts of the VS were prepared to assess the infarct size.
Echo cardiography
The mice were weighed and sedated with isoflurane (induction with 4%, maintenance at 1.8% in air: O2, 2:1) and the medial-right area of the neck, as well as the medial-left area of the thorax was chemically depilated (Veet, Benckiser NV. Hoofddorp, Netherlands).
Base line echo cardiography was executed at t=0 before surgery and at termination 48 hours thereafter with a Vevo 2100 (Visualsonics, Amsterdam, the Netherlands). The executing lab assistant was blinded for the experimental groups. Three views were recorded in a sagittal, coronal and axial orientation, from which end systolic and end diastolic volumes (EDV) were determined to calculate ejection fraction (EF). EF is expressed as a percentage of stroke volume (SV) over EDV. Or put simply as: EF=(EDV−ESV)/EDV)*100. The difference per heart between baseline-EF and EF at 48 hours after surgery is used as a measure for loss of cardiac function.
Surgical procedure: MI and VS
For surgery the animals were anaesthetized via intraperitoneal injection with FDD-mix. The mice were intubated and ventilated and body temperature was kept at 38°C. Both operations were executed in one session.
The extremities of the mice were connected to ECG electrodes. The neck was sterilized with 70% alcohol and opened to expose the right vagus nerve. A bipolar electrode, connected to an external stimulator (TTi, type TGP110), was placed on the nerve and the nerve was stimulated for 30 seconds (f=10 Hz, I=1 mA, pulse width=0.5 ms). A minimal decrease of 20% in heart rate during VS was accepted as proof for an effective vagus stimulation since A-fibers in the vagus nerve that inhibit inflammatory responsivity are easier to stimulate than B-fibers that trigger heart rate to slow down [17-19]. Then, the electrodes of the stimulator and the ECG recorder were removed and the skin was closed with Vicryl 4.0.
Subsequently the thorax was opened left laterally between the fourth and fifth ribs and the LAD was occluded with a braided silk 8.0 ligature. Pale colouring of the infarcted area and slight arrhythmias were taken as an indication of a solid occlusion. The thorax was closed with monofil prolene 8.0 and the thoracic skin was sutured with Vicryl 4.0. Finally, the anaesthesia was antagonized with Antisedan (Pfizer) 2.5 mg/kg and Anexate (Roche) 0.5 mg/kg. The sham-VS procedure was performed identically but only until exposure of the vagus nerve. The nerve as such was minimally touched to prevent unwanted effects. In the sham-MI group the whole procedure was followed and a ligature was pierced underneath the LAD but was not tied up. Immediately after surgery, the animals received 0.1 mg/kg buprenorphine (Temgesic®, Reckitt Benckiser, UK)
Immunohistochemistry
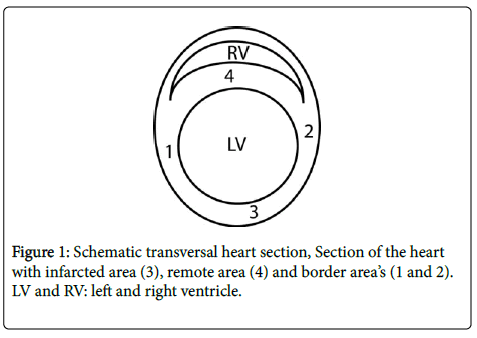
The hearts for immunohistochemistry were flushed with Phosphate Buffered Saline (PBS), fixed in 4% formaldehyde for ca. 90 minutes and stored in PBS with 15% sucrose. They were embedded in paraffin and cut in 5 μm sections. Sections from ca. 2 mm above the apex were used for inflammatory cell staining. Antigen retrieval was performed in 2.94 g/l Tri-sodium-citrateÙ 2H2O (pH=6) for 20 minutes at 96°C and the sections were stained for inflammatory cells. The amounts of neutrophils, T-lymphocytes and macrophages were determined with Ly6G antibody (BioLegend, Cat.nr:108402), anti-CD3 (DAKO, ref: A0452) and MAC-3 (BD Biosciences, cat.nr:553322) respectively and all stained with Liquid Permanent Red (LPR). Vascular Endothelial Growth Factor (VEGF) was determined with anti-VEGFA (Abcam, Cat.nr:ab46154). Pictures of the stained sections were taken at 200x magnification and analysed for relative amounts of stained area with the colour selection tool of ImageJ [20]. CD3+ lymphocytes were manually counted by a blinded investigator. The left ventricular myocardium was divided in 4 regions (Figure 1). Zone 3 is the infarcted area, 1 and 2 are border zones, ventral and dorsal respectively, and zone 4 represents the septal area, most remote from the infarction. The zones 1 and 2 were taken together as one border zone to be compared with the remote and infarcted areas. The measurements were recalculated to amounts or stained area per mm2.
Blood content, inflammatory responsiveness
Terminal blood was processed through a cell counter (Cell-Dyn Sapphire, Abbott Diagnostics, Lake Forest, Ill, USA) to define numbers of total white blood cells (WBC), lymphocytes, granulocytes and red blood cells (RBC). In the same procedure plasma levels of haemoglobin were determined.
A volume of 100 μl whole blood was stimulated with 100 μl lipopolysaccharide (100 ng/ml LPS, Sigma-Aldrich, cat.nr: L2880) at 37°C. After 20 hours incubation the blood samples were centrifuged for 5 minutes at 300 G after which the plasma supernatant was transferred into sterile tubes and stored at -80°C. To determine inflammatory responsiveness, TNFα levels in LPS stimulated plasma samples were examined with ELISA (mouse TNF-alpha Quantikine Kit, R&D systems, cat.nr: MTA00B).
Infarct size
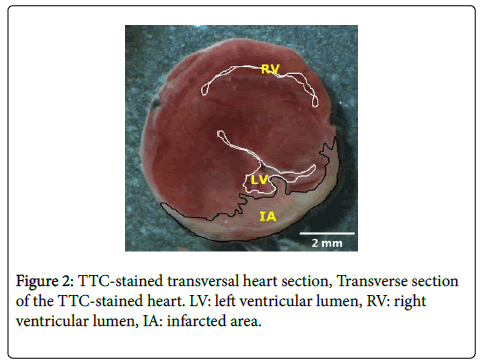
For measurement of the infarct size, the hearts were flushed with saline, excised and put in a -20°C freezer for ca. 60 minutes. Then, the hearts were sliced in 0.9 mm sections, perpendicular to the long axis. These sections were incubated for 15 minutes in 4% 37°C Triphenyl tetrazolium chloride (TTC-) solution (2,3,5-Triphenyl-tetrazolium chloride, Sigma-Aldrich, cat.nr: T8877). Viable tissue stains red in TTC while infarcted tissue remains white. After staining slices were preserved in 4% formaldehyde for 60 minutes and then transported into phosphate buffered saline with 15% sucrose and 0.05% Na-azide. Pictures at fixed distance were taken immediately after preparation and infarct size was determined as a percentage of the whole section with the contour tool in Image J [20] (Figure 2). Since the infarcted area in all hearts was located in the lower transversal heart sections, only the four sections closest to the apex were included in the calculation of the total infarct size and the four were averaged per heart.
Data processing
Quantification of TTC-areas, cardiac volumes and inflammatory cells was performed by a blinded assistant. Statistics were performed in Prism-7 (Graphpad Prism 7 Software, La Jolla California USA). Significant outlier identification was performed with Grubbs outlier detection. Differences were determined by ANOVA-Kruskal-Wallis or t-test-Mann-Whitney, both non-parametric, and all results are presented as means (M) with standard deviation (SD). Results were considered significant if p-values were smaller than 0.05.
Results
Experimental details
In the 2 days following surgery the animals decreased in body weight, VS: 4%, VS+MI: 4.4% and MI: 4.9% (ns). The mortality after MI was 11% in 48 hours leaving 15 mice in the MI group, 14 in the VS +MI and 11 in the VS group. After termination, two animals were excluded from the MI group because no infarction, normally visible as a pale area under the ligature, was observed on the heart.
With respect to the VS procedure all subjects met the criteria for reliable stimulation. The heart rate showed an average decrease of 63% (range 40%-75%) that immediately returned to normal when the VS was stopped.
Terminal blood values
One value from the VS+MI group and from the MI group two values are missing because the condition of the animal was not good enough to draw a sufficient amount of blood.
The numbers of blood cells and the hemoglobin concentration are shown in Table 1. Although means of the VS+MI (N=13) group are highest for all blood cells, the values did not significantly differ from the MI (N=12) group. VS (N=11) appears to cause lower levels of total WBC than VS+MI: 5.36 ± 3.52 vs. 9.02±4.21 counts per liter blood (p=0.040).
| WBC | Lym | Gran | Hb | |
|---|---|---|---|---|
| MI | 7.09 (4.12) | 4.85 (2.96) | 0.45 (0.38) | 8.00 (1.05) |
| VS+MI | 9.02 (4.21) | 6.06 (2.60) | 1.02 (0.82) | 8.55 (0.89) |
| VS | 5.36 (3.52) | 3.76 (2.54) | 0.54 (0.57) | 8.59 (0.70) |
Table 1: Blood plasma content. Group averages of amounts of white blood cells (WBC), lymphocytes (Lym) and granulocytes (Gran) as 109 cells/L and haemoglobin (Hb) in mmol/L 48 h after intervention. Differences between MI and VS+MI are not significant. Mean ± (SD), Kruskall-Wallis of One Way ANOVA.
Cardiac function
In the MI and VS+MI groups 12 echographies had to be excluded because of technical problems at the moment of termination.
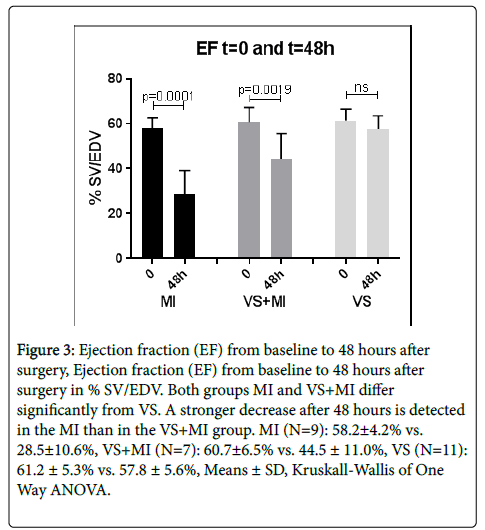
The EF, a measure for cardiac function, is shown as stroke volume as a percentage of the EDV. Baseline and terminal group values of EF at t=0 and t=48 h are depicted in Figure 3. Compared to t=0 the terminal EF decreased in the MI and the VS+MI groups. The t=48 h EF of the MI group decreased to 28.5 ± 10.6% compared to the baseline value of 58.2 ± 4.2% (p=0.0001). In the VS+MI group, the t=0 EF of 60.7 ± 6.5% decreased to 44.5 ± 11.0% at t=48 h (p=0.0019). The group that only received VS did not change in cardiac function.
Figure 3: Ejection fraction (EF) from baseline to 48 hours after surgery, Ejection fraction (EF) from baseline to 48 hours after surgery in % SV/EDV. Both groups MI and VS+MI differ significantly from VS. A stronger decrease after 48 hours is detected in the MI than in the VS+MI group. MI (N=9): 58.2±4.2% vs. 28.5±10.6%, VS+MI (N=7): 60.7±6.5% vs. 44.5 ± 11.0%, VS (N=11): 61.2 ± 5.3% vs. 57.8 ± 5.6%, Means ± SD, Kruskall-Wallis of One Way ANOVA.
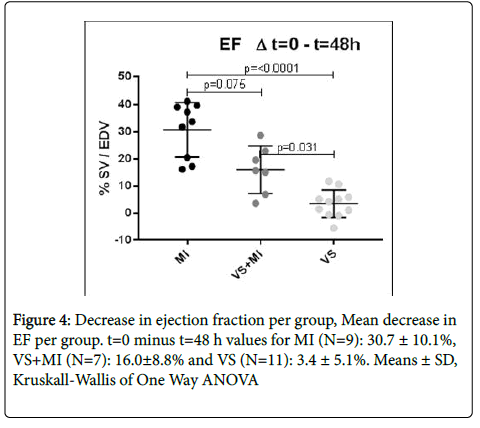
The average decrease in EF of the MI group (N=9), however, did not significantly differ from the decrease of the VS+MI group (N=7), 30.7 ± 10.1% vs. 16.0 ± 8.8% (p=0.075) respectively. As expected, the EF in the VS group (N=11) did not change in the 48 hours after surgery. T=0 vs. t=48 h change in EF of the VS group was 3.4 ± 5.1% (ns, Means ± SD) (Figure 4).
Infarct size
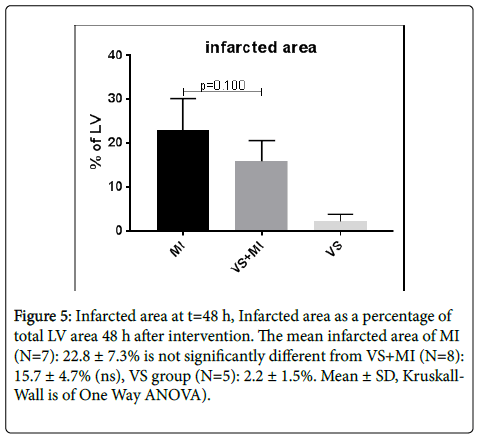
From the MI group one mouse was excluded from analysis because no effective MI was verified. The infarct size as indicated by the TTC-staining was measured with Image and expressed as percentage of total slice area (Figure 5). Although not significant group averages show smaller infarctions in the VS+MI compared to the MI group (p=0.100). Group means with SD of infarct size are respectively MI: 22.8 ± 7.3% (N=7), VS+MI: 15.7 ± 4.7% (N=8) and VS: 2.2 ± 1.5% (N=5).
Figure 5: Infarcted area at t=48 h, Infarcted area as a percentage of total LV area 48 h after intervention. The mean infarcted area of MI (N=7): 22.8 ± 7.3% is not significantly different from VS+MI (N=8): 15.7 ± 4.7% (ns), VS group (N=5): 2.2 ± 1.5%. Mean ± SD, Kruskall- Wall is of One Way ANOVA).
Inflammatory responsiveness
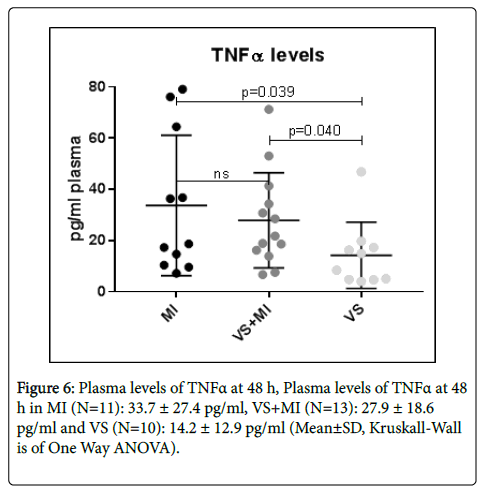
TNFα levels in LPS stimulated blood were determined with ELISA. There was no significant difference in TNFα levels between MI and VS +MI groups (Figure 6). Both groups MI (N=11) and VS+MI (N=13) significantly differed from the VS (N=10) group, respectively 33.7±27.4 (p=0.039) and 27.9±18.6 (p=0,040) vs. 14.2±12.9 pg/ml plasma. (N=10).
Inflammatory cells
In preserved and stained transversal slices of the infarcted heart at t=48 h the numbers of neutrophils, T-lymphocytes and macrophages were quantified. One value from the VS+MI and two from the VS group were detected as significant outliers by Grubbs outliers test and therefore excluded.
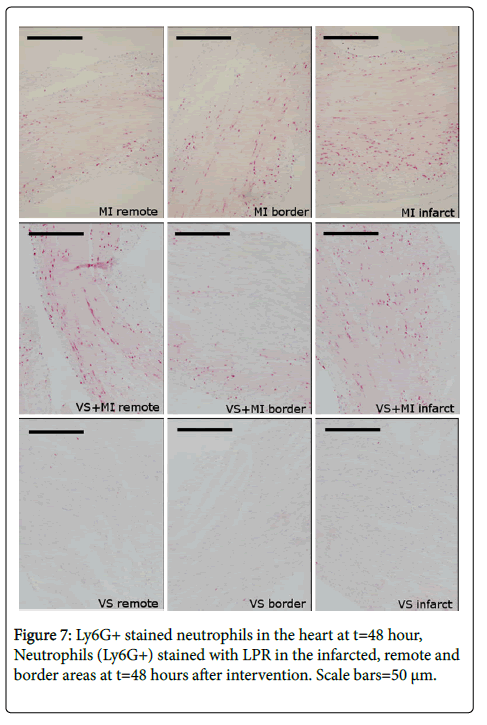
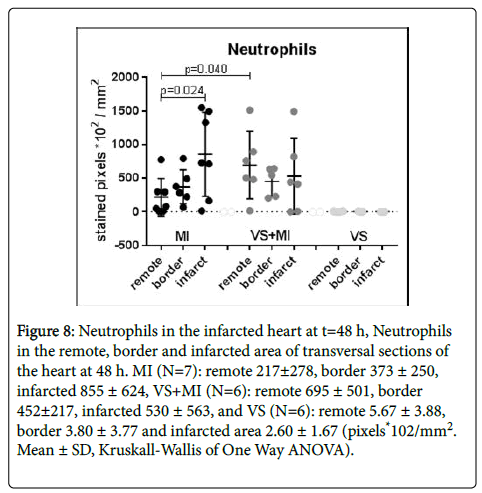
Neutrophils, presented as stained pixels *102 per mm2, in the infarcted areas appeared to be less present in the VS+MI group than in the MI group (ns). On the other hand, in the remote areas, the VS+MI group shows significantly higher values than the MI group (p=0.040). Within the MI group the presence of neutrophils is bigger in the infarcted area (ns) than in the remote area (p=0.024). The values in the VS group are close to zero and show no internal difference between areas. The combined results are shown in Figure 7 and Figure 8.
Figure 8: Neutrophils in the infarcted heart at t=48 h, Neutrophils in the remote, border and infarcted area of transversal sections of the heart at 48 h. MI (N=7): remote 217±278, border 373 ± 250, infarcted 855 ± 624, VS+MI (N=6): remote 695 ± 501, border 452±217, infarcted 530 ± 563, and VS (N=6): remote 5.67 ± 3.88, border 3.80 ± 3.77 and infarcted area 2.60 ± 1.67 (pixels*102/mm2. Mean ± SD, Kruskall-Wallis of One Way ANOVA).
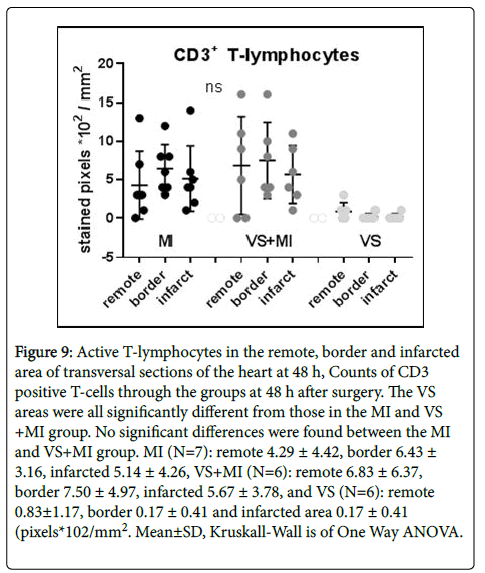
The results of counting CD3+ T-lymphocytes in the heart at t=48 h did not exhibit significant differences between the MI and VS+MI group. On the average, slightly more CD3+ T-lymphocytes are found in the VS+MI as compared to the MI group, specifically in the remote areas (MI 4.29±4.42 vs. VS+MI 6.83±6.37 pixels *102/mm2, ns) (Figure 9).
Figure 9: Active T-lymphocytes in the remote, border and infarcted area of transversal sections of the heart at 48 h, Counts of CD3 positive T-cells through the groups at 48 h after surgery. The VS areas were all significantly different from those in the MI and VS +MI group. No significant differences were found between the MI and VS+MI group. MI (N=7): remote 4.29 ± 4.42, border 6.43 ± 3.16, infarcted 5.14 ± 4.26, VS+MI (N=6): remote 6.83 ± 6.37, border 7.50 ± 4.97, infarcted 5.67 ± 3.78, and VS (N=6): remote 0.83±1.17, border 0.17 ± 0.41 and infarcted area 0.17 ± 0.41 (pixels*102/mm2. Mean±SD, Kruskall-Wall is of One Way ANOVA.
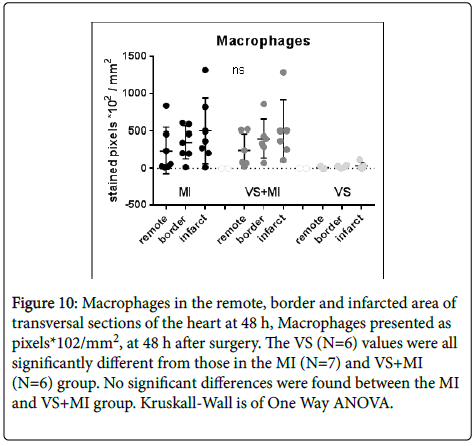
The values of present macrophages in the stained sections of the MI group and VS+MI group did not differ between groups. Virtually no macrophages were found in the vagus stimulated hearts (Figure 10).
Figure 10: Macrophages in the remote, border and infarcted area of transversal sections of the heart at 48 h, Macrophages presented as pixels*102/mm2, at 48 h after surgery. The VS (N=6) values were all significantly different from those in the MI (N=7) and VS+MI (N=6) group. No significant differences were found between the MI and VS+MI group. Kruskall-Wall is of One Way ANOVA.
VEGF
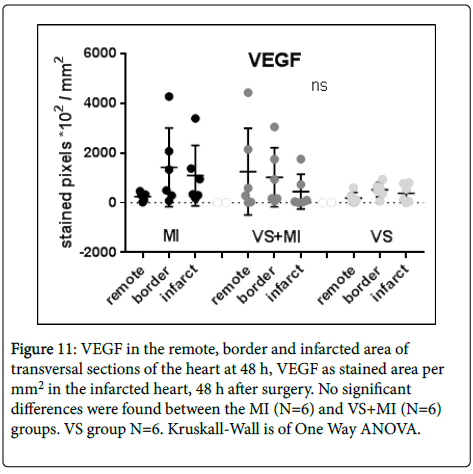
Results of Vascular Endothelial Growth Factor (VEGF) measurements in the different areas of the infarcted heart are depicted in Figure 10 as stained pixels per mm2. In values for VEGF stained area there are no significant differences to report between the groups. Great variation was found in both MI and VS+MI groups (Figure 11).
Figure 11: VEGF in the remote, border and infarcted area of transversal sections of the heart at 48 h, VEGF as stained area per mm2 in the infarcted heart, 48 h after surgery. No significant differences were found between the MI (N=6) and VS+MI (N=6) groups. VS group N=6. Kruskall-Wall is of One Way ANOVA.
Discussion
Inflammatory processes play a crucial role in tissue repair and recovery after MI. The ANS modulates inflammation and the parasympathetic part of the ANS serves as an attenuating player in this connection by inhibiting the inflammatory response [21,22]. This study explored whether parasympathetic activation, by electrical stimulation of the vagus nerve, could reduce tissue damage and cardiac function loss after MI.
To measure a potential protective effect, mice were subject to experimental MI with or without electrical VS and the effects were studied at 48 hours after surgery and defined in difference of heart function, ischemic area and inflammatory activity.
Cardiac function
The EF values and averages at t=0 as well as 48 h after intervention are consistent with existing literature [22-24]. Moreover, EF in the MI group at t=48 h is significantly lower than baseline values (28.46 ± 12.07 vs. 58.46 ± 4.50%) a decrease of 51% from baseline (p=<0.000) while the reduction in EF of the VS+MI group is only 37% from t=0 (39.38 ± 15.42 vs. 62.48 ± 5.36%, p=0.002). However both groups show a decreased EF, the reduction in the VS+MI group is seriously less than in the MI group. The difference between MI and VS+MI comes close to significance (p=0.075), such that it reinforces our basic assumption that VS reduces the development of function loss in MI.
Infarct size
Infarcted area as measured with TTC staining yielded a nonsignificant difference between MI and VS+MI (p=0.100). However, after 48 h the exact infarct borders are not yet fully outlined and sometimes difficult to define. The shape of the infarction can be irregular and slices of 0.9 mm could show a different ischemic pattern on each side of the slice. Nevertheless, quantification of all caudal/ superior surfaces or of the cranial/inferior surfaces yielded equal results for infarcted area.
Inflammatory responsiveness
Inflammatory responsiveness was measured as TNFα levels in LPS stimulated blood 48 hours after MI and VS. A period of 20 hours LPS stimulation is quite long and beyond the response maximum. However, TNFα levels after such a period are still increased and measurable and differences are clear to see. For logistic reasons in our experimental schedule it was not possible to choose for a shorter incubation period.
The TNFα levels in the MI and VS+MI groups are not found to be significantly different. In both groups however, they are significantly higher than in the VS group. This could indicate that a MI serves as a major inflammatory trigger, causing an immune reaction to such an extent that the influence of 30 seconds of VS on TNF-levels is overruled within the recovery period of 48 hours.
Inflammatory cells
Neutrophils, T-lymphocytes and Macrophages were quantified in transverse sections of the infarcted heart. Resulting values in the VS group were for all subsets close to zero indicating that the scores in the other two groups were caused by the MI procedure.
Neutrophils belong to the first responders after MI. They are attracted to the infarcted area and reach a peak between one and three days after intervention [25-27]. However, an increase in neutrophils was not found in this study. While within the MI group a clear difference is found between the remote and infarcted area (p=0.024), this is not the case in the VS+MI group. The remote area is considered to be a control area being the same type of tissue but not affected by the MI process. Nevertheless, while in the VS no cells were found serious amounts of neutrophils were located in the remote areas of the other groups. Moreover, significantly more neutrophils were found in the remote area of the VS+MI than in the remote area of the MI group (p=0.040). This is contrary to the expectations because high numbers of neutrophils are generally associated with increased injury. Through the border and infarcted areas however, no significant difference was found between the MI and VS+MI groups.
In the VS+MI group, neutrophil counts in the infarcted area did not differ from the counts in the remote or border area. Concerning neutrophils, VS prior to MI does not seem to have a great additional effect on the infarcted heart, although small differences were found in different locations. In the VS+MI group most neutrophils were found in the remote area while in the MI group the highest concentrations were located in the infarcted area.
The reported average increase of CD3+ lymphocytes after two days of MI varies in literature from none to a small increase. A stronger increase was found four days after surgery [25-27]. In the present study no differences were found in counts of CD3+ T-lymphocytes between different areas and groups at t=48 h. Macrophages are essential for tissue repair after infarction. They accumulate and a clear increase in the infarcted heart can be found after three days [28,29]. In the present study no significant differences were found in resident macrophages in areas of the ischemic heart, the levels at termination were found to be almost identical in both MI and VS+MI groups. Unchanged levels of macrophages can also be explained by the phonotypical plasticity of macrophages. M1 macrophages produce pro-inflammatory cytokines, while M2 macrophages provide anti-inflammatory functions and are involved in wound healing and fibrosis [30,31]. Upon certain triggers they can easily change from type M1 to type M2. In a mouse study on VS in renal ischemia-reperfusion injury, the numbers of infiltrating macrophages did not change upon VS but the phenotype of those cells did change from M1 to M2 [32]. Another study showed an increase of M1 in the first 3 days after I-R followed by a decrease. For M2 the opposite occurred showing a decrease until day 3 followed by a gradual increase [28]. In future studies separate determination of M1 and M2 could shed some new light on the inflammatory and repairing processes involved.
VEGF
Hypoxia, as caused by MI urges dying myocardial cells to produce VEGF in an attempt to re-vascularize the threatened tissue [33,34].
Levels of VEGF in the infarcted heart were not found to be different between MI and VS+MI treated mice which means that a positive effect of VS to save the infarcted myocardium by stimulation of new vessel growth is not demonstrated.
Limitations
The physical condition of some of the animals was not good enough to draw a sufficient amount of blood at the moment of termination. Also, some of the echocardiographic data at termination time were difficult to analyse. The unstable position of the heart without an intact pericardium often caused blurred recordings, some of which did not yield reliable values and had to be excluded.
The results of some parameters do not reach significance because of a large SD. This can partly be explained by the relatively short time of two days between the surgical intervention and the moment of termination. After a recovery period of 48 hours ongoing migratory processes of inflammatory cells like neutrophils may not yet be stable and cause fluctuations in the results. Small differences in the recovery speed may be reflected in substantial variation in experimental outcomes.
For cells like lymphocytes and macrophages 48 hours could be too short for changes to develop, they may only become detectable after a longer time. A second measurement point, later on in the process, would provide extra information on the course of development of damage and function loss. This preferably would be around day 5 when the inflammatory processes are more stabilized.
Conclusions
VS+MI treated mice showed less reduction of ejection fraction compared to MI alone and a close to significant smaller infarct size. The degree of this reduction is not found to be significantly different in MI as compared to VS+MI mice. Circulating cells and resident inflammatory cells in the infarcted heart were not different in MI compared to the VS+MI group and the same applies for VEGF levels in the heart. Inflammatory responsiveness as measured with TNFα was not significantly influenced by VS in MI treated mice 48 hours after surgery. In conclusion, this study did not show clear proof for an inhibiting effect of VS on development of MI injury.
Future studies on this topic should include an extra measurement step to examine the longer term effects of vagus nerve stimulation on injury on day 5 after MI.
Funding
This work was partly supported by funding from the department of Cardiology of the University Medical Center in Utrecht, the Netherlands.
Competing Interests
The authors declare no competing interests.
References
- Hansson GK (2005) Inflammation, atherosclerosis, and coronary artery disease. N Engl J Med 353: 429-30-30
- Van Der Wal AC, Becker AE, Van Der Loos CM, Das PK (1994) Site of intimal rupture or erosion of thrombosed coronary atherosclerotic plaques is characterized by an inflammatory process irrespective of the dominant plaque morphology. Circulation 89: 36-44.
- Pal GK, Adithan C, Ananthanarayanan PH, Pal P, Nanda N, et al. (2013) Association of sympathovagal imbalance with cardiovascular risks in young prehypertensives. Am J Cardiol 112:1757-1762.
- Gidron Y, Kupper N, Kwaijtaal M, Winter J, Denollet J (2007) Vagus-brain communication in atherosclerosis-related inflammation: a neuroimmunomodulation perspective of CAD. Atherosclerosis 195:e1-e9.
- Zamotrinsky AV, Kondratiev B, Jong JW (2001) Vagal neurostimulation in patients with coronary artery disease. Auton Neurosci 88: 109-116.
- Clancy JA, Mary DA, Witte KK, Greenwood JP, Deuchars SA, et al. (2014) Non-invasive vagus nerve stimulation in healthy humans reduces sympathetic nerve activity. Brain Stimul 7: 871-877.
- Borovikova LV, Ivanova S, Zhang M, Yang H, Botchkina IG, et al. (2000) Vagus nerve stimulation attenuates the systemic inflammatory response to endotoxin. Nature 405: 458-462.
- Bonaz B, Sinniger V, Pellissier S (2017) Vagus nerve stimulation: A new promising therapeutic tool in inflammatory bowel disease. J Intern Med 282: 46-63.
- Gold MR, Van Veldhuisen DJ, Hauptman PJ, Borggrefe M, Kubo SH, et al. (2016) Vagus nerve stimulation for the treatment of heart failure: The INOVATE-HF trial. J Am Coll Cardiol 68: 149-158.
- Koopman FA, Chavan SS, Miljko S, Grazio S, Sokolovic S, et al. (2016) Vagus nerve stimulation inhibits cytokine production and attenuates disease severity in rheumatoid arthritis. PNAS 113: 8284-8289.
- Clough RW, Neese SL, Sherill LK, Tan AA, Duke A, et al. (2007) Cortical edema in moderate fluid percussion brain injury is attenuated by vagus nerve stimulation. Neuroscience 147: 286-293.
- Jiang Y, Li L, Ma J, Zhang L, Niu F, et al. (2016) Auricular vagus nerve stimulation promotes functional recovery and enhances the post-ischemic angiogenic response in an ischemia/reperfusion rat model. Neurochem Int 97: 73-82.
- Martelli D, Farmer DGS, Yao ST (2016) The splanchnic anti-inflammatory pathway: could it be the efferent arm of the inflammatory reflex? Exp Physiol 101: 1245-1252.
- Tracey KJ (2007) Physiology and immunology of the cholinergic antiinflammatory pathway. J Clin Invest 117: 289-296.
- Pavlov VA, Tracey KJ (2017) Neural regulation of immunity: molecular mechanisms and clinical translation. Nat Neurosci 20: 156-166.
- Faul EF, Erdfelder E, Buchner A, Lang AG (2009) Statistical power analyses using G*Power 3.1 : Tests for correlation and regression analyses. Behav Res Methods 41: 1149-1160.
- Qing KY, Wasilczuk KM, Ward MP, Phillips EH, Vlachos PP, et al. (2018) B fibers are the best predictors of cardiac activity during Vagus nerve stimulation. Bioelectron Med 4: 5.
- Yuan H, Silberstein SD (2015) Vagus nerve and vagus nerve stimulation, a comprehensive review: Part I. Headache J Head Face Pain 56: 71-78.
- McAllen RM, Shafton AD, Bratton BO, Trevaks D, Furness JB (2018) Calibration of thresholds for functional engagement of vagal A, B and C fiber groups in vivo. Bioelectron Med 1: 21-27.
- Schneider CA, Rasband WS, Eliceiri KW (2012) NIH Image to ImageJ: 25 years of image analysis. Nat Methods 9: 671-675.
- Papaioannou V, Pneumatikos I, Maglaveras N (2013) Association of heart rate variability and inflammatory response in patients with cardiovascular diseases: current strengths and limitations. Front Physiol 4: 174.
- Olshansky B, Sabbah HN, Hauptman PJ, Colucci WS (2008) Parasympathetic nervous system and heart failure: pathophysiology and potential implications for therapy. Circulation 118: 863-871.
- Pons S, Fornes P, Hagege AA, Heudes D, Giudicelli JF, et al. (2003) Survival, haemodynamics and cardiac remodelling follow up in mice after myocardial infarction. Clin Exp Pharmacol Physiol 30: 25-31.
- Mao Y, Tokudome T, Otani K, Kishimoto I, Miyazato M, et al. (2013) Excessive sympathoactivation and deteriorated heart function after myocardial infarction in male ghrelin knockout mice. Endocrinology 154: 1854-1863.
- Shimazu T, Otani H, Yoshioka K, Fujita M, Okazaki T, et al. (2011) Sepiapterin enhances angiogenesis and functional recovery in mice after myocardial infarction. Am J Physiol Heart Circ Physiol 301: H2061-72.
- Latet SC, Hoymans VY, Van Herck PL, Vrints CJ (2015) The cellular immune system in the post-myocardial infarction repair process. Int J Cardiol 179: 240-247.
- Arslan F, Smeets MB, O’Neill LAJ, Keogh B, McGuirk P, et al. (2010) Myocardial ischemia/reperfusion injury is mediated by leukocytic toll-like receptor-2 and reduced by systemic administration of a novel anti-toll-like receptor-2 antibody. Circulation 121: 80-90.
- Yan X, Anzai A, Katsumata Y, Matsuhashi T, Ito K, et al. (2013) Temporal dynamics of cardiac immune cell accumulation following acute myocardial infarction. J Mol Cell Cardiol 62: 24-35.
- Ben-Mordechai T, Holbova R, Landa-Rouben N, Harel-Adar T, Feinberg MS, et al. (2013) Macrophage subpopulations are essential for infarct repair with and without stem cell therapy. J Am Coll Cardiol 62: 1890-1901.
- Glezeva N, Horgan S, Baugh JA (2015) Monocyte and macrophage subsets along the continuum to heart failure: Misguided heroes or targetable villains? J Mol Cell Cardiol 89: 136-145.
- Murray PJ, Wynn TA (2011) Protective and pathogenic functions of macrophage subsets. Nat Rev Immunol 11: 723-737.
- Inoue T, Abe C, Sung SJ, Moscalu S, Jankowski J, et al. (2016) Vagus nerve stimulation mediates protection from kidney ischemia-reperfusion injury through α 7nAChR + splenocytes. J Clin Invest 126: 1939-1952.
- Forsythe JA, Jiang BH, Iyer NV, Agani F, Leung SW, et al. (1996) Activation of vascular endothelial growth factor gene transcription by hypoxia-inducible factor 1. Mol Cell Biol 16: 4604-4613.
- Levy A, Levy N, Wegner S, Goldberg M (1995) Transcriptional regulation of the rat vascular endothelial growth factor gene by Hypoxia. J Biol Chem: 13333-13340.
 Spanish
  Chinese
  Russian
  German
  French
  Japanese
  Portuguese
  Hindi
Hindi 