Research Article, J Aging Geriatr Med Vol: 3 Issue: 2
Effects of Arm Restriction on Slips and fall in Young and Older Individuals
Aditya Jayadas1* and James L. Smith2
1Design, Housing & Merchandising Department, Oklahoma State University, Stillwater, OK, USA
2Industrial Engineering Department, Texas Tech University, Lubbock, TX, USA
*Corresponding Author: Aditya Jayadas
Design, Housing & Merchandising Dept.
Oklahoma State Univ., Stillwater, OK, USA
E-mail: aditya.jayadas@okstate.edu
Received: February 02, 2019 Accepted: April 09, 2019 Published: April 15, 2019
Citation: Jayadas A, Smith JL (2019) Effects of Arm Restriction on Slips and fall in Young and Older Individuals. J Aging Geriatr Med 3:1.
Abstract
Abstract When the human body moves from single support to double support, during the heel contact phase, there is a possibility of a slip-induced fall as the weight acceptance task is being transferred from one foot to another. Exploring the biomechanics of gait in the elderly and young with one or two arms restricted under not only the unknown slippery condition but also the dry floor and known slippery conditions could provide a better understanding of slip and fall mechanics. Twenty-eight individuals (14 young and 14 elderly) with equal number of males and females participated in the study. Individuals were required to walk along a circular track and they were required to walk over dry floor and also exposed to a ‘known’ and ‘unknown’ slippery floor condition. For dry walking conditions, a reduced step length and foot-floor angle, and decreased walking velocities were noted when one or two arms of individuals were restricted. For the known slippery condition, reduced step length and foot-floor angle, and smaller walking and heel contact velocities were used by both younger and older individuals. Average sliding heel velocity, peak sliding heel deceleration and separation between whole body center of mass and sliding heel showed differences for age. For differences between fallers and non-fallers, the variables including average sliding heel velocity, maximum separation between the whole body center of mass (WBCOM), and the maximum difference in velocities between the upper body center of mass (UBCOM) and the lower body center of mass (LBCOM) showed significant differences. For arm restriction, both young and older individuals showed significant differences in maximum wrist velocities for the different arm restriction conditions. The most significant finding was that when the arms of individuals were not restricted, they could have higher differences in velocities between the UBCOM and LBCOM, and still not fall.
Keywords: Proactive; Reactive; Upper and lower body center-of-mass; Slip; Fall
Practitioner Summary
When you are holding a towel in your hand and you slip, does that affect your ability to recover? A biomechanical study was conducted to investigate the effects of arm restriction on slip recovery. When arms were restricted, simply by carrying a light weight object, gait modifications were noted both prior to lip and during the recovery effort.
Introduction
Human locomotion or gait is one of the most common activities of daily living. It has been reported that 50% of all falls occurred during some form of locomotion [1]. Falls can be extrinsic, where an external factor in the environment was the main factor that contributed to the fall, or intrinsic, where some condition or event affected the postural control system of an individual that led to the fall. The primary external factors that could lead to a fall include slippery surfaces, foreign objects on the walking surface and/or design flaws in the walking surface [2]. Falls from slippery surfaces are one of the most common types of fall [3]. The intrinsic factors could include failure to select and execute effective proactive and/or reactive strategies to avoid or reduce the risk of injury from a fall, and an individual’s current physical condition.
In terms of falls and the elderly, the dynamic equilibrium of the body is adversely affected by age, as indicated by the fall statistics of the elderly [4]. The higher incidence of falls in the elderly leads to greater injuries and more severe health complications as a result of these injuries. If elderly individuals do recover from the injuries they sustained during a fall, the impact from the fall can still affect the individual’s subsequent lifestyle [5]. Thus, falls pose a serious threat to elderly individuals, as they are the leading cause of not only injury, but also death and disability in individuals who are older than 65 years of age [6].
Elderly individuals rely on walking to perform various activities of daily living (ADL). The number of elderly individuals walking to perform their ADL is increasing day-by-day. The current demographic trends indicate that there is a transition in the population structure towards an aging population. Current projections estimate that there will be 70 million people over the age of 65 in the United States (U.S.) by the year 2030, which is double the figure of 35 million in 2003 [7]. It could be inferred that as the number of elderly individuals increase, the problems associated with falls could also increase unless measures are taken to reduce the high incidence of falls in the elderly.
In terms of cost associated with slips and falls in the U.S., the annual direct cost of injuries due to slips and falls has been estimated to be in the excess of US $6 billion [8]. The high cost associated with slip and fall injuries is the result of a number of individuals including the elderly walking on slippery surfaces and not being able to recover after the initiation of a slip event. If an individual fails to recover from the slip event, the individual falls to the ground, often resulting in an injury, with the impact of the injury being greatest in the aged-old (age>75 years) and old-old (age>85 years) elderly populations. Campbell et al. [6] reported that hip fractures increase exponentially (28 per 10,000 individuals in the age group 65-74, and 251 per 10,000 in the age group>81) with age in the elderly and so does the associated cost. The cost statistics indicate that there is an urgent need for the establishment of successful intervention strategies to reduce the likelihood of slip-induced fall events, which could in turn help reduce the costs associated with slip and fall incidents in the elderly. In order to introduce intervention strategies, it is essential to understand better the gait control mechanisms during a slip perturbation.
One of the goals of conducting a slip and fall study in a laboratory is to realistically simulate a slip incident, as it would occur in the real world, and thus better understand the control mechanisms of the human body in its attempt to recover from a slip-induced fall. Falls as they relate to response control represent the failure of the balance control system in taking appropriate proactive and/or reactive control when encountering a slip perturbation, which could lead to a fall and subsequent injury, disability or death in the elderly. A proactive control strategy relies on experience-based prediction of the sign and magnitude of a perturbation prior to the onset of movement [4]. When using a proactive control strategy, individuals change their locomotor patterns to minimize any potential threat to stability prior to encountering the perturbation. For instance, individuals may select an alternative foot placement pattern or walk slower in order to stabilize the balance control system. A proactive strategy could be used early on prior to the onset of movement. Different proactive strategies include reduced step length and reduced foot-floor angle, both of which help reduce slip potential [9]. Fong et al. [10] suggested that to avoid or reduce the likelihood of an injury resulting from a slip event individuals should walk slowly which includes shortening stride length, decreasing propagation speed, and increasing stance and stride time. Lockhart et al. [7] suggested that using a more gentle foot strike helped reduce the heel contact velocity.
This covers only one-half of the strategies as proactive strategies involve strategies taken by individuals prior to the onset of a perturbation. The other half involves strategies taken after individuals encounter a perturbation such as a slippery surface. When compared to a proactive strategy, during a reactive strategy, the stabilizing responses follow the perturbation as opposed to preceding it. In terms of successful reactive strategies used by individuals to recover, You et al. [11] suggest that smaller displacement and faster velocity of the WBCOM with respect to the BOS are noteworthy reactive response strategies to help individuals regain balance during the period of heelstrike to contralateral toe-off. In terms of the timing of response strategies, Cham and Redfern [12] reported that corrective reactions took place 20% into the stance phase. This suggests that although heel contact initiates a slip, the stance phase immediately following this might be more important in terms of identifying corrective responses or the lack of, which could lead to a fall. In terms of the upper body, Marigold et al. [13] demonstrated that during unexpected slip incidents an elevated arm strategy could help reduce the likelihood of a fall. Myung and Smith [14] took a different approach through load carrying (using a container 46 cm × 30 cm × 30 cm with varying weights of 20% body weight and 40% body weight, 18 kg and 24 kg) using two hands in front of the body during a slip perturbation. The authors reported that as load carrying levels increased, though step length reduced, heel contact velocity and slip distance increased, thus increasing the likelihood of a fall [14]. Holbein-Jenny and Redfern [15] found similar results in that individuals modified their gait patterns when they carried loads (4.5 kg, 9 kg and 13.5 kg) using a container (30 cm × 33 cm × 28 cm). However, the authors found conflicting results in that slip distances were higher for smaller loads but smaller for the heavy load (13.5 kg). These results suggest that individuals probably used a more cautious gait reflecting the use of a proactive strategy when carrying heavier loads. In terms of one hand load carriage, Holbein-Jenny and Redfern [15] found that carrying loads asymmetrically using one hand always resulted in greater medio-lateral center of mass (ML-COM) displacement when compared to walking with no load under dry walking conditions. The effects of arm restriction through load carriage when carrying relatively light loads (0.2 kg) using one or two hands is yet to be explored.
The purpose of this study was to better understand the effects of arm restriction when individuals (young and old) walked over dry, known slippery and unknown slippery floor conditions. First, it was hypothesized that both young and older individuals would show differences in walking velocity, heel contact velocity, step length and foot floor angle under different arm restriction conditions (no arm, two arm and one arm restriction) for the non-slippery dry floor walking conditions. Next, it was hypothesized that both young and older individuals would show decreases in walking velocity, step length, foot floor angle and heel contact velocity when the individuals walked over known slippery floor conditions. Lastly, it was hypothesized that there would be differences not only between older and younger individuals in terms of recovery effort during an unknown slippery perturbation but also between no arm restriction and the arm restriction conditions, and also between fallers and nonfallers.
Methods
Experiment location and approval
The research study was conducted at the Ergonomics Laboratory in the Industrial Engineering Department at Texas Tech University (TTU). All procedures for this study were conducted upon approval from the Texas Tech University Institutional Review Board for the protection of human subjects.
Subjects
Twenty-eight individuals were recruited for the study. Specifically, 14 young adult (7 male and 7 female) and 14 elderly (7 male and 7 female) individuals from the university and elderly community in Lubbock, Texas volunteered to participate in the study. The 14 elderly subjects ranged as follows in age (65-80 yr), height (1.56-1.93 m) and mass (56.4-113.2 kg). The 14 younger subjects ranged as follows in age (20-33 yr), height (1.63-1.88 m) and mass (44.7-101.6 kg). All the individuals were in good health and passed the screening procedures required for participation. Individuals were screened for heart problems, blood pressure, shortness of breath, dizziness, fatigue, discomfort in hip, knee and/or ankle joints, difficulty in walking, difficulty with cognition and history of prior falls. Further, individuals were required to do a practice gait trial while wearing a whole body fall protection harness. If individuals indicated difficulty in walking, they were not included in the study. No monetary benefits were provided to the subjects for their participation in the study.
\ Experimental set-up and protocol
Gait trials were performed on a circular track equipped with a fall arrest rig system. Subjects walked at their preferred walking speed. Motion data were captured using an 8-camera motion capture system from Motion Analysis Corporation (Santa Rosa, California, USA). The sampling rate used for the motion capture of the 3-D (dimensional) position data using reflective markers was 120 Hz. Marker coordinate data were smoothed using a 4th order zero lag Butterworth filter with a cut off frequency of 6hz. Nineteen reflective markers were placed on each individual at various palpable locations. The marker protocol previously used by Lockhart [16] was modified and used in the study. Markers were placed bilaterally on the ulnar styloid process, lateral epicondyle (estimating elbow axis), temporal bone (above the ear), acromion process (most lateral part), greater trochanter, lateral femoral condyle, lateral malleolus, head of second metatarsal, heel and on the sacrum. The heel marker and the markers on the second metatarsal head were placed on the shoe. A stick figure was created from the 19 markers to provide a visual model by which to better understand the recovery effort during a slippery perturbation. It must be pointed out that the markers were placed over clothing and shoes, so slight movement of the clothing could have altered the location of the marker location. This was minimized using double sticky tape and elastic bands.
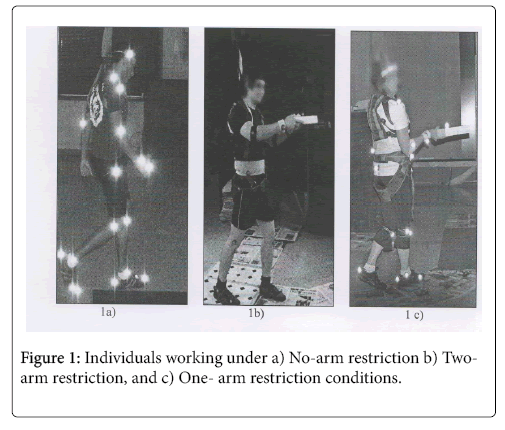
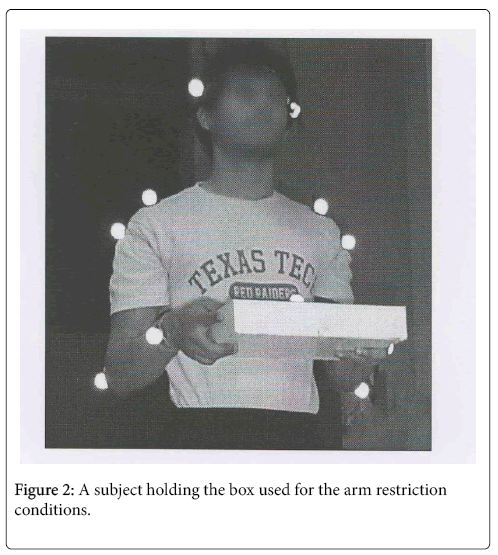
Individuals were required to walk during ‘dry’, ‘known’ and ‘unknown’ slippery floor conditions under different arm restriction conditions. The walking trials under the three arm restriction conditions (no-arm, two-arm and one-arm) are shown in Figure 1. For the two-arm and one-arm restriction conditions individuals were required to carry a box. The dimensions of the box were 0.29 m (length) × 0.23 m (breadth) × 0.05 m (thickness), and the mass of the box was 0.2 kg. The box was held with the elbow bent at a 90-degree angle as shown in Figure 2. It must be pointed out that while for the two-arm condition both hands were used to hold the load, for the onearm restriction the load was always carried in the right hand.
Calculation of gait variables
The first variable, normalized step length, was calculated as the distance from the heel contact of one foot to heel contact of the other foot normalized to the height of the individual. Next, walking velocity was calculated as the average velocity for 500 ms prior to heel contact using the sacrum marker motion in the x (anterior-posterior) direction as the reference. A finite difference was used to calculate all velocities. Next, heel contact velocity was defined as the instantaneous resultant velocity in the x-y direction (anterior-posterior and medio-lateral) of the heel at heel contact. Foot-floor angle was defined as the angle of the heel-toe relative to the walking surface in the sagittal plane. For the wrist velocities (left and right), x, y & z resultant peak velocities of the wrist marker were used and was calculated for time periods initial contact to 500 ms after initial contact to better understand the role of arm movement in the reactive phase of the slip perturbation. Next, slip distance was defined as the distance the sliding heel moved across the tile surface in the resultant x-y direction for the duration of the slip. Average sliding heel velocity was defined as the average of the instantaneous velocity of the sliding heel for the duration of the slip. Peak heel deceleration was calculated after the instantaneous velocity of the sliding heel was differentiated to get acceleration/deceleration data. The most negative value was then recorded as peak deceleration of the heel.
The LBCOM, UBCOM and WBCOM were calculated from the coordinates of the 19 markers and anthropometric information [17]. The LBCOM segments included left and right thighs, legs, and feet. The UBCOM segments included the head and neck, trunk, left and right upper arm, forearms and hands. The WBCOM included all of the aforementioned segments. The separation between the WBCOM and heel was calculated in the x-y direction for the duration of the slip. The resultant velocities for the LBCOM and UBCOM were then calculated from the 3D positional data using central finite differences. The maximum differences in velocities for the LBCOM and the UBCOM for both the leading and trailing scenarios were calculated for the duration of the slip.
Classification of the outcome of the unknown slippery trials The outcomes of the 84 ‘unknown’ slippery perturbations were classified as ‘recovery’ or ‘fall’. A trial was classified as a ‘fall’ if the resulting vertical load exceeded 100 N as detected by the fall-arrest-rig (FAR) system which would cause the machine to shut down and support the individual fully using the full-body-harness system attached to the FAR. If individuals did not exert a vertical force greater than 100 N on the FAR the trial was classified as ‘recovery’. Individuals who fell were classified as ‘fallers’, whereas individuals who recovered were classified as ‘non-fallers’. The ‘fall’ and ‘recovery’ trials were also visually confirmed through observation of all the 84 gait trials.
Statistical Analysis
A 3*3*2 (floor condition *arm restriction *age) repeated-measures analysis of variance (ANOVA) model was used to determine differences within and between subjects for the dry walking and known slippery conditions for the variables heel contact velocity, walking velocity, foot floor angle and normalized step length. Next, a 2*3*2 (floor condition *arm restriction *age) repeated-measures analysis of variance (ANOVA) model was used to determine differences within and between subjects for the unknown slippery conditions for the variables left and right wrist velocities. Further, independent t-tests were used to test differences between fallers and non-fallers, younger and elderly fallers, and younger and elderly nonfallers for the variables including slip distance, peak sliding heel velocity, peak heel deceleration, maximum separation (in the x-y direction) between the WBCOM and heel for slip duration and differences in velocities between the UBCOM and the LBCOM for slip duration (when the LBCOM was both trialing and leading the UBCOM). Further, a multiple analysis of variance (MANOVA) & discriminant analysis was also carried out to determine the order of importance and predictability of the variables to distinguish fallers and non-fallers. The variables slip distance, peak sliding heel velocity, separation between the WBCOM and heel for slip duration and differences in velocities between the UBCOM and the LBCOM for slip duration (when the LBCOM was both trialing and leading the UBCOM) were used for this analysis also. Significance levels were set at 0.05 for all analyses. Statistical analyses were performed using SPSS.
Results
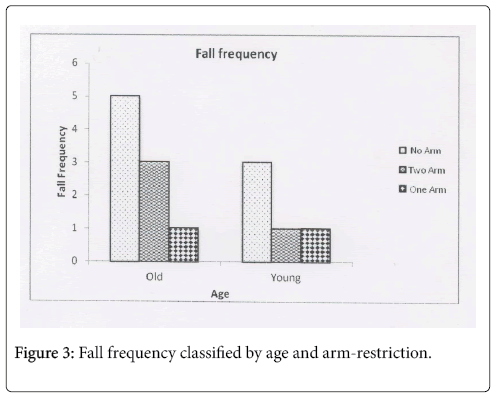
The first question answered was how many trials resulted in a fall? A total of 14 fall trials were observed for the 84 unknown slippery trials. In terms of age, nine and five falls were observed for the older and younger individuals respectfully. As for fall frequency by arm restriction, eight falls resulted from the no-arm restriction condition followed by four for the two-arm restriction and lastly two for the onearm restriction condition. The fall frequency broken down by age and arm restriction is show in Figure 3. This was not consistent with what was expected. It was expected that the two arm restriction condition would result in the most falls, followed by the one arm restriction and lastly the no arm restriction. The order of testing, going from no arm restriction in week 1, to two arm restrictions in week 2 and one arm restriction in week 3 could have had an effect on the outcome of the results.
For the dry walking trials, normalized step length, walking velocity and foot floor angle showed significant differences (p<0.05) across arm restriction. Heel contact velocity, however was not found to be significant. None of these variables showed significant differences for age. However, step length did show significant difference for foot floor angle *age interaction. Foot floor angle was the only variable that showed significant differences for floor condition. The statistical results for these variables are summarized in Table 1.
| Search terms | Initial search | MeSH terms filter | MeSH major topic filter | MeSH major Topic+Date |
|---|---|---|---|---|
| Older adults view of aging | 883 | 546 | 457 | 238 |
| Seniors and perceptions of aging | 133 | 63 | Filter not used | Filter not used |
| Subjective views of aging | 29 | Filter not used | Filter not used | Filter not used |
| Objective views of aging | 163 | 73 | 53 | Filter not used |
| Positive perceptions of aging | 1171 | 718 | 570 | 347 |
| Positive view of aging | 344 | 279 | 157 | 79 |
| Optimism in older adults | 289 | 248 | 12 | Filter not used |
| Aging stereotypes | 470 | 5 | Filter not used | Filter not used |
| Stereotype impacts on aging | 3 | Filter not used | Filter not used | Filter not used |
| Viewpoints of aging | 109 | 57 | Filter not used | Filter not used |
| Cultural perspectives of aging | 231 | 115 | 87 | Filter not used |
| Cultural perspectives of elderly | 1372 | 681 | 24 | Filter not used |
| Models of aging stereotypes | 38 | Filter not used | Filter not used | Filter not used |
| Interventions for perceptions of aging | 149 | 62 | Filter not used | Filter not used |
| Successful aging intervention | 2310 | 127 | 35 | Filter not used |
Table 1: Number of results returned through PubMed searches.
In terms of proactive strategies, normalized step length, foot floor angle, heel contact velocity and walking velocity all showed significantly (p<0.05) lower values when individuals knew that the floor was slippery. None of these variables showed significant differences across floor condition. However, the variables normalized step length, foot floor angle and walking velocity did show significant differences for the interaction term arm restriction * floor condition. The statistical results for these variables are summarized in Table 2.
| Major topic category | Number of references selected |
|---|---|
| Older Adults-General | 4 |
| Perceptions of Aging | 9 |
| Stereotypes of Aging | 9 |
| Definitions and Measures | 10 |
| Factors and Outcomes | 17 |
| Interventions | 5 |
| TOTAL | 54 |
Table 2: Number of final references selected for inclusion by major topic category.
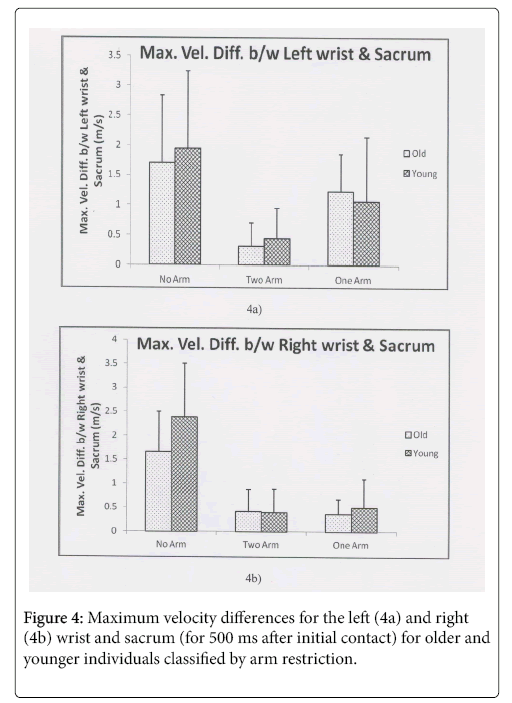
In terms of reactive strategies, the left and right wrist velocities (normalized to sacrum velocity) did show significant differences (both P<0.001) for arm restriction as expected. The right hand carried the load for the one arm restriction condition, and as expected the velocity of the left wrist was higher for the one arm restriction condition when compared with that in the two arm restriction condition. The left wrist velocity was, as expected lower than in the no arm restriction condition (Figure 4a). However, it is important to note that the standard deviation was proportional to the magnitude of the wrist velocities. The level of uncertainty increases from two arm to one arm to no arm restriction condition in that the standard deviation was highest for the no arm restriction condition. As for the right wrist, the two and one arm condition wrist velocities were similar as the right hand was similarly engaged in load carriage in both arm restriction conditions (Figure 4b). Once again, this result was expected. It is important to note that all but one younger individual were right handed. When comparing the right and left wrists, for the no arm and two arm restriction conditions, the wrist velocities were similar. Expectedly, for the one arm condition, the right and left wrist velocities differed. An interesting finding was that restricting one wrist resulted in a decreased velocity of the other "free" wrist. This could be due to the single arm carriage having disrupted the natural symmetry in gait. No other significant differences were noted across age or fallers versus non-fallers for the left and right wrist velocities.
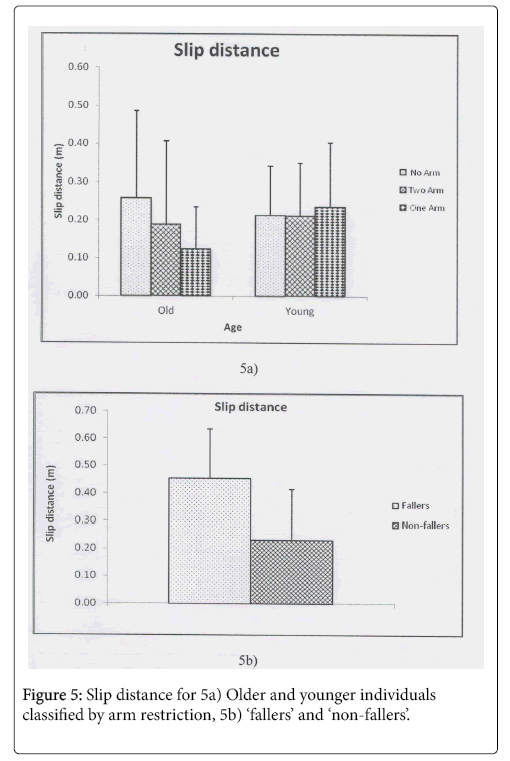
In terms of age, the first question addressed was if older individuals slipped longer distances as anticipated. This was not the case. As hypothesized, there were no statistically significant differences (p=0.12) overall between old and young for the slip distance variable. For the no arm restriction, the older individuals did slip longer distances on average, but for the two arm and one arm restriction conditions, the younger individuals slipped longer distances (Figure5a). The older individuals had greater slip distance for the no arm restriction condition, followed by the two arm and lastly the one arm restrictions. Whereas, the younger individuals had fairly consistent slip distances regardless of arm restriction. This could suggest that older individuals became a little more cautious as they progressed from week 1 to week 3. This idea is supported by an observed decrease in average inter-session walking velocity. In terms of fallers and non-fallers, slip distance (Figure 5b) did show statistically significant differences. As anticipated, the individuals who fell slipped farther (P<0.001).
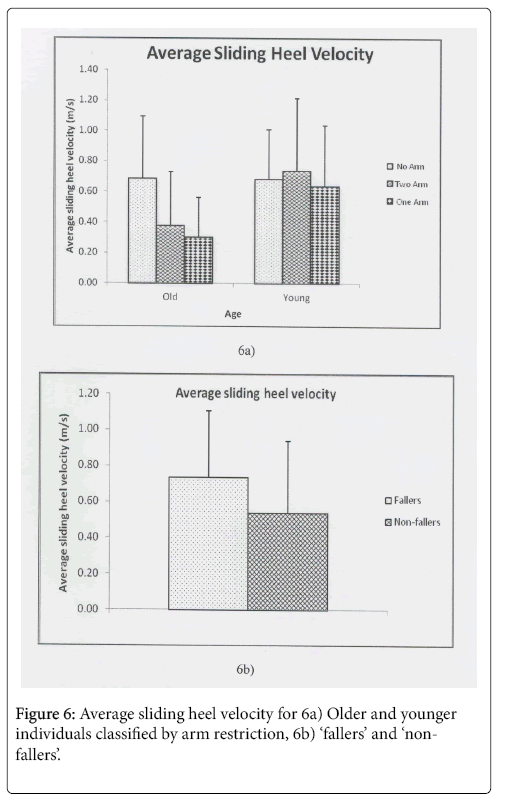
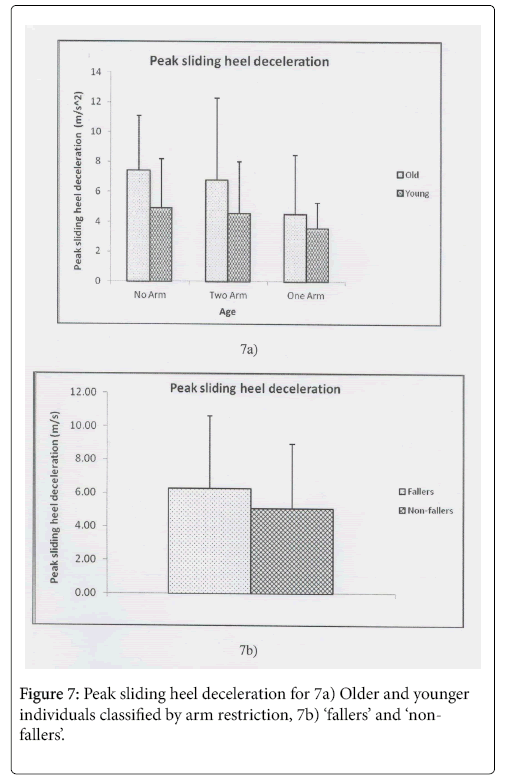
The variables of average sliding heel velocity (refer Figure 6a) and peak sliding heel deceleration (refer Figure 7a) did show significant differences (p=0.01 and p=0.04 respectively) between older and younger individuals. Similar to slip distance, older individual’s demonstrated greater average sliding heel velocity for the no arm condition compared with the two arm and one arm restriction. The younger individuals again had fairly consistent velocities regardless of arm restriction. As suggested previously, the older individuals may have become more cautious in the subsequent testing sessions, thus resulting in lower sliding heel velocities in week 3 (one arm restriction) compared with week 1 (no arm restriction). For peak sliding heel deceleration, both older and younger individuals had greater peak decelerations for the no arm condition compared with the two arms and one arm condition, with greater deceleration values always being observed in the older individuals. This suggests that the older individuals were using more of a breaking strategy when compared with the younger individuals. The younger subjects might have been more comfortable using a "sliding" strategy in an attempt to recover from the slippery perturbation, as supported by higher observed average sliding heel velocity values. When comparing fallers and nonfallers, average sliding heel velocity (see Figure 6b) and peak heel deceleration (see Figure 7b) did not show significant differences between fallers and non-fallers (P=0.09 & P=0.33 respectively) in fallers when compared with non-fallers. This result is interesting in that the breaking strategy used by elderly individuals did not seem to play an important role in differentiating fallers from non-fallers, which could subsequently account for the higher fall frequency in elderly individuals. However, it is important to not draw conclusions favoring the sliding strategy over the breaking strategy based simply on these results. Investigation of other variables, including WBCOM and heel separation and velocity differences between the UBCOM and LBCOM may provide a better understanding of the slip and fall mechanics during a recovery effort.
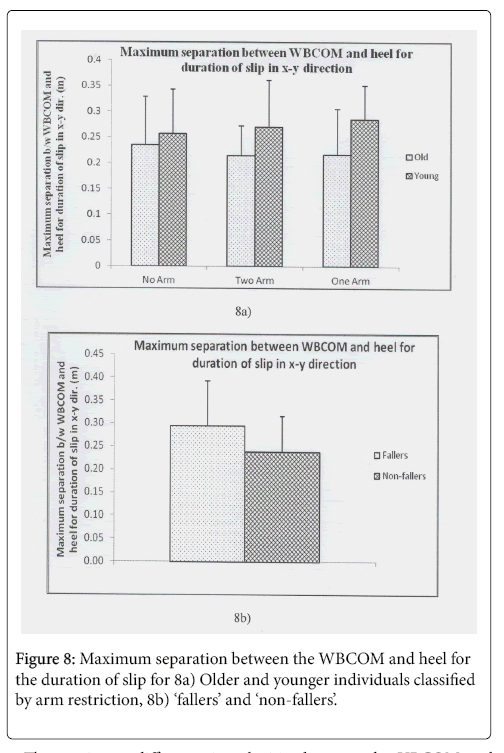
The maximum separation between the WBCOM and the heel for the duration of the slip was found to be significantly different (P=0.003) between older and younger individuals as shown in Figure 8a. For the younger individuals, the one arm restriction condition showed the highest separation followed by the two arms and lastly the no arm restriction condition. Perhaps this suggests that younger individuals were less cautious about falling going from one week to the next, and perhaps even grew more confident on return to the testing center? For the older individuals however, the no arm restriction condition revealed higher separation between the WBCOM and heel than the two and one arm restriction conditions. In terms of the fallers and non-fallers, the separation between the WBCOM and the heel was also significant as shown in Figure 8b. This is expected as fallers would display higher WBCOM-heel separation as a result of the fall.
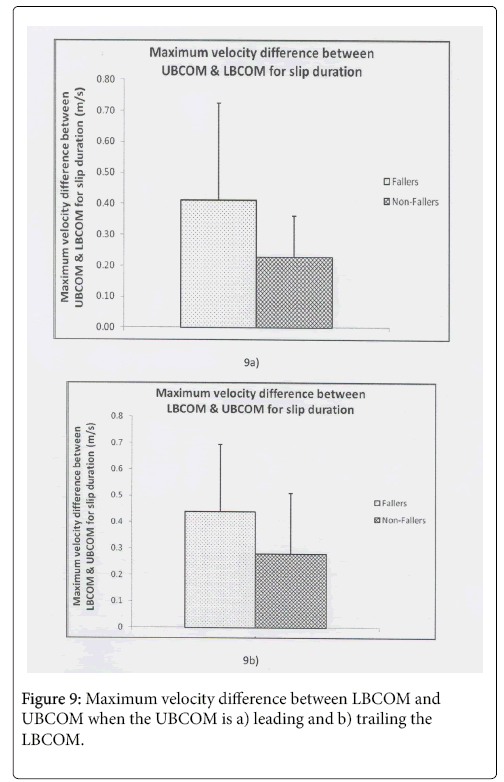
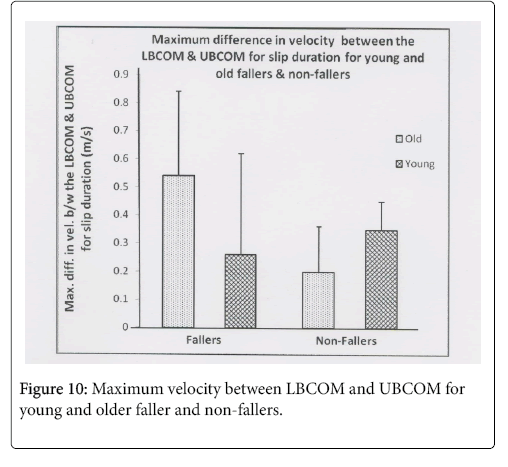
The maximum difference in velocities between the UBCOM and LBCOM when the LBCOM was trailing and leading the UBCOM (P=0.02 in both cases) for the duration of slip showed significant differences between fallers and non-fallers as shown in Figure 9a and 9b. In both the leading and trailing scenarios, there appeared to be a threshold of about 0.4m/s. This suggests that when the UBCOM is moving 0.4m/s faster or slower than the LBCOM a fall could result. When age was considered it was found that for the fallers, the older individuals had higher difference in velocities between the LBCOM and the UBCOM when compared to the younger individuals. On the other hand for the non-fallers, younger individuals showed higher difference in velocities between the LBCOM and the UBCOM (Figure 10). This demonstrates that the younger individuals could experience higher difference in velocities between the LBCOM and UBCOM, regardless of direction, when compared to older individuals and still not fall.
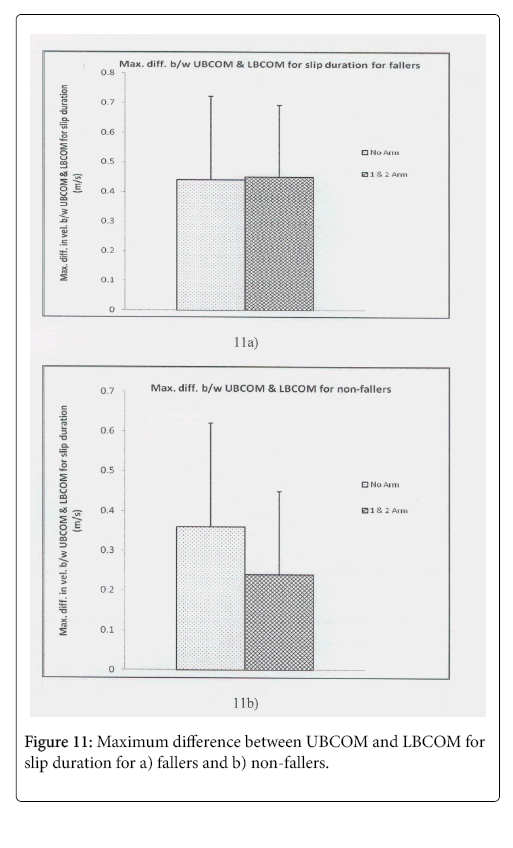
The maximum velocity difference between the UBCOM and LBCOM was also explored for fallers comparing the no-arm with the arm restriction (combined two-one-arm restriction) conditions. The results showed no significant differences (P=0.46) between the no-arm and the arm restriction condition for fallers, though higher values were expected for arm restriction (Figure 11a). However, when exploring the difference in velocities between the UBCOM and the LBCOM for the non-fallers it was found that the no-arm restriction condition had significantly higher differences (P=0.04) in velocities when compared to the arm restriction conditions (Figure 11b). This suggests that individuals can experience higher velocity differences and likely accelerations between the UBCOM and LBCOM and still recover when the arms are free as opposed to when either or both are restricted. Higher walking velocities observed in the no arm restriction condition may have also played a role in the result.
The MANOVA results did show significance (Pillai’s trace, P<0.001) for fallers and non-fallers for the six variables used. The univariate tests did reveal that the variables slip distance (P<0.001), maximum separation between WBCOM and heel for slip duration (P=0.02), and the maximum difference in velocities between the LBCOM & UBCOM for both leading (P<0.001) and lagging (P=0.02) scenarios showed significant differences between fallers and non-fallers. However, the variables average sliding heel velocity (P=0.09) and peak sliding heel deceleration (P=0.34) did not show insignificant differences between fallers and non-fallers.
Next, the discriminant analysis showed that the slip distance was the best predictor variable to distinguish fallers and non-fallers. The next was the difference in UBCOM & LBCOM velocities (leading and lagging), followed by the separation between the WBCOM and the heel. The last two variables were the average sliding heel velocity and the peek sliding heel deceleration. The structure matrix with the order of the variables is shown in Table 3. In terms of predictability, the variables were able to distinguish 9 of the 14 fall trials, and 69 of the 70 recovery trials with the original count. For the cross-validated count the predictability dropped to 7 out of the 14 fall trials and 68 out of the 70 recovery trials. These classification results are shown in Table 4.
| Key psychosocial factors | Key physical factors |
|---|---|
| Resilience | Longevity |
| Positive attitude | Healthy weight |
| High self-esteem | Absence of disease |
| Overall well-being | Fewer chronic conditions |
| High cognitive functioning | Frequent physical activity |
| Engagement/purpose in life | High physical functioning |
| Social support and social activity | Better physical health status |
| Lower loneliness and social isolation | Felt age vs. actual chronological age |
| Realistic self-appraisal and acceptance | Maintained healthy lifestyle behaviors |
Table 3: Key factors involved in self-perceptions of aging.
| Fall Recovery | Predicted Group Membership | Total | |||
|---|---|---|---|---|---|
| Fall | Recovery | ||||
| Original | Count | Fall | 9 | 5 | 14 |
| Recovery | 1 | 69 | 70 | ||
| % | Fall | 64.3 | 35.7 | 100.0 | |
| Recovery | 1.4 | 98.6 | 100.0 | ||
| Cross-validated | Count | Fall | 7 | 7 | 14 |
| Recovery | 2 | 68 | 70 | ||
| % | Fall | 50.0 | 50.0 | 100 | |
| Recovery | 2.9 | 97.1 | 100.0 | ||
Table 4: Classification results.
Discussion
In terms of fall frequency, elderly individuals in the current study experienced more falls when compared to younger individuals. Specifically, nine (9) out of the 14 observed trials resulting in a fall involved elderly subjects. These findings are similar to those of a previous study [18,19] in which it was reported that that more older individuals fell (12) when compared to younger individuals (5) when they encountered a slippery perturbation. In terms of arm restriction, the fall frequency was eight (8) for the no-arm restriction condition, followed by four (4) for the two-arm restriction condition and two (2) for the one-arm restriction condition. A similar finding has not been reported in the past. It was expected going in to the study that more individuals would fall under the two-arm and one-arm restriction conditions when compared to the no-arm restriction conditions. This was not the case. It is unclear if a possible anticipation of the slippery surface and a more conservative gait observed in the second week of testing (for the two-arm restriction condition) and third week of testing (for the one-arm restriction condition) resulted in the progressively fewer falls going from week-one (no-arm restriction condition) to week-two, and week-two to week-three. Bhatt and Pai [20] reported that a single slip did not alter the second slip conducted four months later suggesting that there was no long term retention. However, a short inter-session duration of one week as utilized in the current study, could have resulted in a retention and anticipation the following week, and thus affected the outcome measures. While subject retention was the primary rationale for using a shorter one-week intersession duration, a longer duration between test sessions is recommended for future slip perturbation studies.
When comparing between arm restriction conditions for the three ‘dry’ walking trials (before slip, after unknown slip and after known slip), it was hypothesized that there would be no significant differences in any of the four variables (heel contact velocity, foot-floor angle, step length and average walking velocity). To our surprise, all but one variable (heel contact velocity) significantly differed across arm restriction. Heel contact velocity was not significantly different and was highly variable between individual subjects across floor condition, arm restriction and age. Wide variation in heel contact velocity values have been previously reported by Cham & Redfern [21]. Rietdyk et al. [22] reported that individuals did not modify their step length, foot floor angle or walking velocity when they walked with an empty box, which is inconsistent with the current findings where all three of these variables differed significantly across walking conditions as well as arm restriction conditions. It is possible that the more conservative gait patterns observed for the two-arm and one-arm restriction conditions resulted in fewer falls when compared to the no-arm restriction condition. Contradictory to what was expected and hypothesized; more individuals fell under the no-arm restriction condition when compared with the one- and two- arm restriction conditions. It is unclear if the order of testing, going from the no-arm (week 1) to twoarm (week 2) and then lastly the one-arm restriction condition (week 3), had any effect on the outcome of the results. Replication of these methods with a counter-balanced arm restriction condition order in future studies is the only means of knowing for certain. Age differences were not expected for the four variables and none were observed. For normalized step length, a floor condition * age interaction was noted, suggesting that older individuals perhaps modified their gait in subsequent trials following the initial slip event.
The four variables explored to quantify proactive strategies including normalized step length, foot floor angle, heel contact velocity and walking velocity were all significant for floor condition. In other words, when individuals knew that the floor was slippery they took smaller steps, walked more flat-footed, struck the floor more gently and walked slower. These findings are in agreement with those of Lockhart, Spaulding and Park [7] who reported that individuals took smaller steps and also struck the ground more gently and thus had smaller heel contact velocity values, when they knew that the floor was slippery. Marigold and Patla [23] similarly reported smaller foot floor angles in subjects when walking on a known slippery surface. Fong et al. [10] suggested that to avoid or reduce the likelihood of an injury resulting from a slip event, individuals should walk slower by shortening stride length, decreasing propagation speed, and increasing stance and stride time. Individuals in the current study did walk more slowly when they knew the floor was slippery, and thus no falls were observed during the ‘known slippery’ condition. In terms of differences between older and younger individuals for the ‘known slippery’ condition, the normalized step length and heel contact velocity were not significantly greater in the young compared with older individuals. This is contrary with the findings reported by Lockhart et al. [7] who reported significantly smaller heel contact velocities and shorter step lengths in older individuals during known slippery condition walking trials when compared with younger individuals. Walking velocity and foot floor angle did not differ significantly between older and younger individuals during the known slipper floor condition in the current study.
For the reactive phase from an unknown slip, the current results indicate that elderly individuals had higher peak deceleration values when compared to younger individuals. Cham and Redfern [24] reported that individuals most often decelerated 200 ms to 300 ms into stance in an attempt to recover from the slip. As for the sliding heel velocity, in the current study the younger subjects had higher average sliding velocities compared with the older subjects. This again was not consistent with Lockhart [16] who reported that older individuals had a higher average sliding heel velocity when compared to younger individuals. These conflicting results may be reflective of a different strategy used by younger compared with older individuals. While the older individuals appear to be attempting to minimize slip distance and arrest the slip, the younger individuals might be more confident in using a "sliding" or "surfing" strategy and adjusting their body to the slip as opposed to trying to arrest it. Marigold and Patla [23] suggested that individuals used a “surfing” strategy when they knew that the floor was slippery. A similar strategy appeared to be adopted by younger individuals in the current study for the unknown slippery condition.
In terms of the role of arms for recovery, Marigold et al. [13] reported that rapid arm movements were crucial for recovery from a slippery perturbation. In the current study, rapid arm movements were used to aid in the recovery process. The two arm restriction condition resulted in the lowest wrist velocities as expected. However, the wrist velocity of the left arm (the one not carrying the load) during the onearm restriction condition was significantly lower than the wrist velocity of the left arm during the no-arm restriction condition. It is unclear if the lower velocity observed in the left arm was due to lack of a coordinated response since one arm was restricted, or if subjects felt a one-armed swing could potentially result in a fall because it would create an asymmetric UPCOM shift which may be unhelpful as it could not be countered. Thus, it appears that even one arm restriction might prevent the use of a rapid arm strategy for recovery and hence lead to a fall. Regardless of the restriction conditions, the wrist velocities were always higher for the unknown slippery conditions when compared to the dry walking conditions. The higher wrist velocities values obtained (3.0-3.5m/s) for the no-arm restriction conditions are comparable to those reported by Jongprastithporn & Lockhart [25] for hazardous slippery conditions though they reported values only for the vertical direction.
It was important to determine how the different arm restriction conditions would alter the upper-body-center-of-mass (UBCOM) velocities as it related to the lower-body-center-of-mass (LBCOM) velocities. The no-arm restriction condition showed higher differences between the UBCOM and the LBCOM velocities. This suggests that when their arms were unrestricted individuals were better able to control their UBCOM with respect to their LBCOM and were able to encounter higher excursions between the UBCOM and LBCOM velocities and still recover. We believe this is an interesting finding. Marigold et al. [13] demonstrated that during unexpected slip incidents individuals elevated their arms rapidly forward and outward in an attempt to stabilize the backward displaced center of mass of the whole body (WBCOM). Additionally, this raised arm posture increases the bodies transverse rotational moment arm allowing subjects to more easily control any twisting or torsion experienced during the slip. The two and one-arm restriction conditions in the present study resulted in lower values for the UBCOM-LBCOM velocity difference suggesting that any arm restriction could impose limits in terms of recovery effort or options during slip perturbations. It must be pointed out that the higher LBCOM velocities pretty consistently resulted in a backward fall. During the no arm restriction condition, individuals where able to generate a much higher UBCOM velocity when compared to the LBCOM in an attempt to keep the WBCOM over the base of support. The arm movements might also serve to move the trunk forward and avoid a backward fall. Troy et al. [26] reported that arm responses served to reduce trunk rotational velocity immediately following the slip while simultaneously repositioning the UBCOM away from the rear support boundary. Arm motion therefore may be crucial to aid in the recovery process.
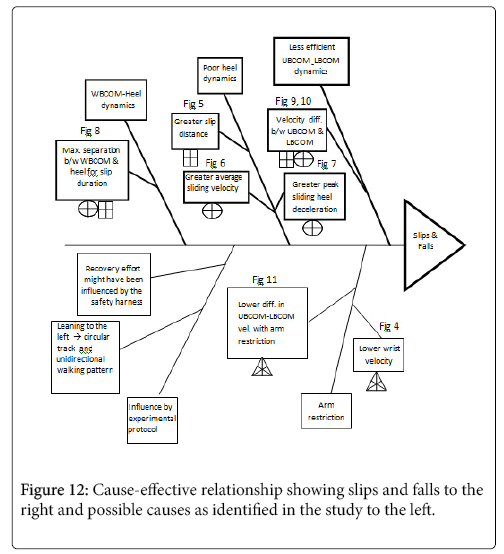
The current study showed interesting results in terms of different gait variables including the dynamics of the UBCOM and the LBCOM, under different arm restriction conditions during a slippery perturbation. As one of the primary goals of this research is to help reduce fall incidences in the elderly, the results of this research can be summarized through the development of a fish-bone diagram which can be used to identify the possible causes of slips and falls. A fish-bone or cause-effect diagram for a slip and fall event as the effect or outcome is show in Figure 12. As can be seen in the diagram, arm restriction influenced the outcome of a slip, but the more important variables (shown with darker lines on the top half of the fish-bone diagram) that distinguished between fallers and non-fallers included slip distance, average sliding heel velocity, WBCOM-heel dynamics and UBCOM-LBCOM dynamics. Further testing and validation of the aforementioned variables is needed therefore to provide a clearer picture of critical predictive variables.
Experimental protocol could also have affected the current outcome measures of a slippery perturbation. One possible limitation pointed out earlier was the order of arm restriction condition during testing. Lack of a counter-balanced design in terms of arm restriction condition may have influenced subject responses during slip perturbation. Namely, testing the no-arm condition in the first test session for all subjects could have created a learning effect and resulted in the observance of lower fall frequency during the arm restriction conditions. In terms of future studies, the fish-bone diagram could be expanded by exploring other gait variables including strength, trunk flexibility, electromyography (EMG), spinal reflex and the activity of motion-detector neurons in the brain. Testing under different natures of the load might be interesting as well. For instance, would individuals react differently if they were carrying a cup of hot coffee or a delicate electronic device instead of a book or a tray?
Conclusion
The primary objective of this paper was to understand the role of two and one arm restriction in effecting the recovery effort resulting from a slippery perturbation. Though the results from the study showed that fall frequency was higher for the no-arm restriction condition, it was also observed that individuals could recover better when their arms were not restricted. Unrestricted arm motion allowed subjects to experience higher differences between the UBCOM and LBCOM velocities and still recover. Thus older individuals could be encouraged not to carry loads when walking on potentially slippery surfaces.
In conclusion, slips and falls is a continuing problem facing elderly individuals. However, through a better understanding of slip mechanisms as explored in this study and looking at recovery under two and one arm restrictions, it is possible to introduce interventions (e.g. Tai-Chi, yoga) to help reduce slip and fall incidences in the elderly through the development of better coordinated upper and lower body movement strategies.
References
- Winter DA (1995) A.B.C. of Balance during Standing and Walking. Waterloo, Canada: University of Waterloo Press, 1-53.
- Goetsch DL (2005) Occupational Safety and Health for Technologists, Engineers and Managers (5th edn). Uppers Saddle River, New Jersey: Pearson Education Inc, 240.
- Yang J, Jin D, Ji L, Wang R, Zhang J, et al. (2007) The reaction strategy of lower extremity muscles when slips occur to individuals with trans-femoral amputation. J Electromyogr Kinesiol 17: 228-240.
- Patla AE (1995) A framework of understanding mobility problems in the elderly. Gait analysis: theory and practice. Mosby-Year books Inc., St. Louis MO: 436-449.
- Cummings SR, Nevitt MC, Kidd S (1988) Forgetting falls: The limited accuracy of recall of falls in the elderly. J Am Geriatr Soc 36: 613-616.
- Campbell AJ, Borrie MJ, Spears GF, Jackson SL, Brown JS et al. (1990) Circumstances and consequences of falls experienced by a community population 70 years and over during a prospective study. Age Ageing 19: 136-141.
- Lockhart TE, Spaulding JM, Park SH (2007) Age-related slip avoidance strategy while walking over a known slippery surface. Gait Posture 26: 142-139.
- Courtney TK, Webster BS (1999) Disabling occupational morbidity in the United States: an alternative way of seeing the Bureau of Labor Statistics’ data. J Occup Environ Med 41: 60-69.
- Chambers AJ, Cham R (2007) Slip-related muscle activation patterns in the stance leg during walking. Gait Posture 25: 565-572.
- Fong DT, Hong Y, Li JX (2005) Lower-extremity gait kinematics on slippery surfaces in construction worksites. Med Sci Sports Exerc 37: 447-454.
- You J, Chou Y, Lin C, Su F (2001) Effect of slip on movement of body center of mass relative to base of support. Clin Biomech 16: 167-173.
- Cham R, Redfern MS (2001) Lower extremity correction reactions to slip events. J Biomechanics 34: 1439-1445.
- Marigold DS, Bethune AJ, Patla AE (2003) Role of the unperturbed limb and arms in reactive recovery response to an unexpected slip during locomotion. J Neurophysiol 89: 1727-1737.
- Myung R, Smith JL (1997) The effect of load carrying and floor contaminants on slip and fall parameters. Ergonomics 40: 235-246.
- Holbein-Jenny MA, Redfern MS (1994) Postural Stability While Walking and Carrying Loads in Various Postures. Proceedings of the Human Factors and Ergonomics Society 38: 564-567.
- Lockhart TE (2000) Effects of musculoskeletal and sensory degradation due to age on the biomechanics of slips and falls. Ph.D. dissertation, Department of Industrial Engineering, Texas Tech University, USA.
- Winter DA (2005) Biomechanics and motor control of human movement (3rd edn). Hoboken, NJ: John Wiley & Sons, Inc., 9-10.
- Lockhart TE, Woldstad JC, Smith JL (2003) Effects of age-related gait changes on the biomechanics of slips and falls. Ergonomics 46: 1136-1160.
- Norton R, Campbell J, Lee JT, Robinson E, Butler M (1997) Circumstances of falls resulting in hip fractures among older people. J American Geriatric Society 45: 1108-1112.
- Bhatt T, Pai YC (2009) Prevention of slip-related backward balance loss: effect of session and frequency on long-term retention. Arch Phys Med Rehabil 90: 34-42.
- Cham R, Redfern MS (2002a) Changes in gait when anticipating slippery surfaces. Gait Posture 15: 159-171.
- Rietdyk S, McGlothlin JD, Knezovich MJ (2005) Work experience mitigated age-related differences in balance and mobility during surface accommodation. Clin Biomech 20: 1085-1093.
- Marigold DS, Patla AE (2002) Strategies for dynamic stability during locomotion on a slippery surface: effects of prior experience and knowledge. J Neurophysiol 88: 339-353.
- Cham R, Redfern MS (2002b) Heel contact dynamics during slip events on level and inclined surfaces. Safety Sci 40: 559-576.
- Jongprasithporn M, Lockhart TE (2012) The effects of hazardous slips on upper extremity kinematics. Proceedings of the XXIVth Annual International Occupational Ergonomics and Safety Conference, Fort Lauderdale, Florida, USA.
- Troy KL, Donovan SJ, Grabiner MD (2009) Theoretical contribution of the upper extremities to reducing trunk extension following a laboratory-induced slip. J Biomech 42: 1339-1344.
 Spanish
  Chinese
  Russian
  German
  French
  Japanese
  Portuguese
  Hindi
Hindi 