Research Article, J Polym Sci Appl Vol: 1 Issue: 2
Effects of Polyetheramine on the Properties of Polyamide 6
Chuyu Zheng1, Jizong Chen2, Xin Chen2, Yuanbo Gao1, Bo Zhu3,* and Yong He1,3,*
1Donghua University Collaborative Innovation Center for Civil Aviation Composites, Donghua University, Shanghai 201620, China
2Guandong Xinhui Meida Nylon Co. Ltd, Jiangmen 529100, China
3State Key Laboratory for Modification of Chemical Fibers and Polymer Materials, College of Material Science and Engineering, Donghua University, Shanghai 201620, China
*Corresponding Author: Yong He
Donghua University Collaborative Innovation Center for Civil Aviation Composites, Donghua University, Shanghai 201620, China
Tel: +86 (021) 6787427
E-mail: yhe@dhu.edu.cn/ yhe99@yahoo.com
*Corresponding Author: Bo Zhu
State Key Laboratory for Modification of Chemical Fibers and Polymer Materials, College of Material Science and Engineering, Donghua University, Shanghai 201620, China
E-mail: Bzhu@dhu.edu.cn
Received: August 28, 2017 Accepted: September 25, 2017 Published: September 29, 2017
Citation: Zheng C, Chen J, Chen X, Gao Y, Zhu B, et al. (2017) Effects of polyetheramine on the properties of polyamide 6. J Polym Sci Appl 1:2.
Abstract
To modify the properties of polyamide 6 (PA6), trimethylolpropane tris[poly(propylene glycol), amine terminated] ether (PEA) was added to PA6 matrix by melt-mixing. By FTIR, 1H-NMR, DSC, melt index, relative viscosityand mechanical properties measurements, it was found that PA6/PEA blends have excellent melt-flowability, good thermal stability, high strength and good color. The melt flowability of PA6 can be significantly improved by a low loading of PEA without the loss of mechanical strengths.
Keywords: Polyamide (PA6); Trimethylolpropane tris[poly(propylene glycol); Amine terminated] (PEA); Melt flowability; Viscosity reducer
Introduction
Polyamide 6 (PA6) has been developed more than 70 years and has become one of the most important engineering plastic due to its high strength, excellent corrosion resistance, suitable wear resistance and favorable self-lubricating property. However, the application of PA6 grades with high molecular weight was limited due to the high melt viscosity. It often becomes difficult to use these grades to produce small parts with thin wall or precision parts because of its poor melt flowability. This problem becomes more serious in case where these grades are mixed with inorganic filler.
So far, many efforts have been devoted to solve the poor process ability or high viscosity PA6. One method is to blend the high viscosity resin with no volac resin, ionomer, hyper branched polymers or liquid-crystal polymers to enhance the flowability, but it may need high loading of modifier (such as 10%) and thus limits its application. Another effective method is to directly synthesis star-branched PA6 with high flowability [1-12].
In this work, a low molecular weight polyetheramine additive, trimethylolpropane tris[poly(propylene glycol), amine terminated] ether (PEA, Mn=440) was included into PA6 to modify its properties. PEA was chosen due to its unique structure as well as commercial availability. It is a kind of amine terminated polyether with three -NH2 groups. On the one hand, these -NH2 groups of PEA are possible to form hydrogen bonds with C=O groups in PA6 chains, break some of the hydrogen bonds between PA6 segments and thus improve the melt flowability. On the other hand, the side -CH3 group near -NH2 group in PEA lowers its chemical reactivity and should greatly restrain the reaction between PEA and PA6. The PA6 blends with low loading of PEA were prepared by melt mixing and their structures and properties were investigated by FTIR, 1H NMR, DSC, WAXD, melt indexer and Ubbelohde viscometer.
Experimental
Materials
PA6 used in this study was a product (Grade: M2800) of Guangdong Xinhui Meida Nylon Co. Ltd (China). Trimethylolpropane tris[poly(propylene glycol), amine terminated] ether(PEA,Mn=440), sulfuric acid-d2 and chloroform-d were purchased from Sigma- Aldrich Co. LLC. They were used as received.
Preparation of the blend samples
After dried at 110°C under vacuum overweight, PA6 was meltmixed with PEA under nitrogen purge at 250°C for 5mins in a twinscrew micro compounder (Shanghai Dehong Rubber Machinery Co. China). The blend is coded as PEA xwt%, where x is weight percentages of PEA in the blend. Pure PA6 after the melt processing was coded as blank.
FTIR-ATR
Fourier transform infrared-attenuated total reflectance (FTIRATR) spectra were recorded in a Nicolet 8700 spectroscope in the range of 4000-600cm-1 for the films of PA6 blank and the blends. The films were prepared by hot-press at 250°C for 2 min under a pressure of 10MPa. Data were collected over 64 scans with a resolution of 0.5 cm-1.
1H-NMR spectra
1H-NMR spectra were obtained on a Bruker Advance 600 spectrometer using sulfuric acid-d2 as solvent for the blends and chloroform-d for PEA at room temperature. The chemical shift was referred tosulfuric acid-d2 (10.981 ppm) or chloroform-d (7.260 ppm).
WAXD
Wide angle X-Ray diffraction (WAXD) was performed on a SAXSmc2 wide-angle X-ray scattering instrument (Anton Paar, Austria) at room temperature. Nickel-filtered Cu Kα radiation (λ= 0.154 nm) was used. WAXD patterns were recorded in the 2θ range of 5-60° at a scan speed of 1.0°/min. Each step increased 2θ by 0.004° and pattern was collected for 20s at each step.
Relative viscosity
The relative viscosity (ηr) of the PA6 and PA6/PEA blends were measured at 0.01g/ml (concentration of PA6 component) of solution in 96% sulfuric acid at 25.00 ± 0.01oC in water bath of JWC-32C1 (Shanghai S.R.D Scientific Instrument Co., LTD) employing an Ubbelohde viscometer.
Differential scanning calorimetry (DSC)
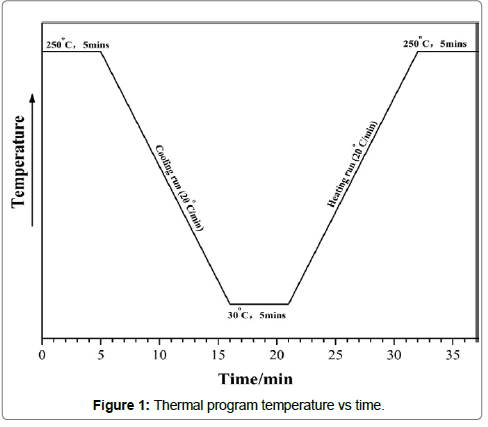
Differential scanning calorimetry (DSC) runs were performed on Polyma DSC214 (NETZSCH) under ultrapure nitrogen purge with 5.5-6.0 mg samples encapsulated in aluminum DSC pans. Before the DSC measurement, the calibration was carried out with indium. The sample was firstly melt at 250°C for 5mins to remove the thermal history, then cooled to 30°C at 20°C/ min, maintaining the temperature at 30°C for 5mins and finally heated to 250°C at a scanning rate of 20°C/min. The area and maximum of the crystallization exothermic peak during the cooling run were taken as the crystallization enthalpy and temperature (ΔHc and Tc), respectively. Similarly, those of the melting endothermic peak in the heating run were recorded as the melting enthalpy and temperature (ΔHm and Tm), respectively. Figure 1 showed that the thermal program.
Mechanical properties
The tensile strength was measured using the dumbbell pieces (length: 147 mm; width: 10 mm; thickness: 4 mm) from injection molding with an Instron 5996 universal tester (Instron) at 23oC with an initial gap of 50 mm under a crosshead speed of 50 mm/min. At least 6 specimens were used and the average value was taken as the result for each sample.
The Rheological behavior
The rheological behavior was characterized with melt index, which was measured with an SRZ-400E melt indexer (Changchun Intelligent Instrument & Equipment Co. Ltd, China) at 250°C under a load of 2.16 kg. Each sample was tested for at least 3 times and the average value was taken as the result.
Results and discussion
FTIR
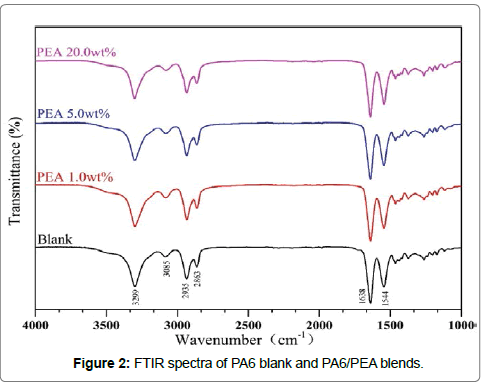
FTIR spectroscopy is a particularly suitable technique for investigating the structure change and the specific intermolecular interaction. The spectra of PA6/PEA blends were collected to check the interaction between the PA6 and PEA blends and summarized in Figure 2. The C-H stretching bands between 3100-2800 cm-1, C=O stretching centered at about 1638 cm-1 and -NH- absorption band centered at about 3300 cm-1 were observed for all the samples. No obvious difference was observed between the blank and the blends, which may suggest that there is no significant chemical reaction between PA6 and PEA.
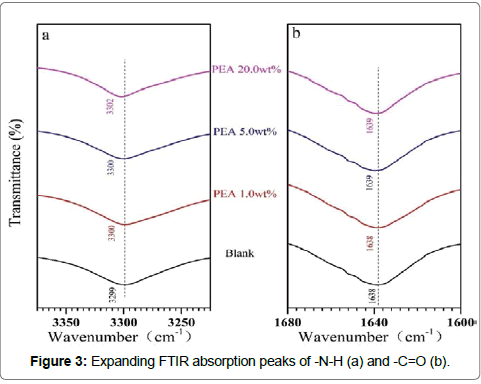
The expanding FTIR absorption peaks of -N-H and -C=O were plotted in Figure 3a and 3b, respectively. Comparing with PA6 blank, the-N-H and -C=O absorption peaks of the blends shifted to higher wave number. Even these shifts were only about 2 cm-1, it should suggest that the hydrogen bonds between -N-H and -C=O became weaker with the introduction of PEA into PA6 and thus the interaction between PA6 chains became smaller. These results should be due to the interactions between PEA and PA6. The -NH2 group of PEA may form hydrogen bonds with the -NH group and -C=O group of PA6.
1H-NMR
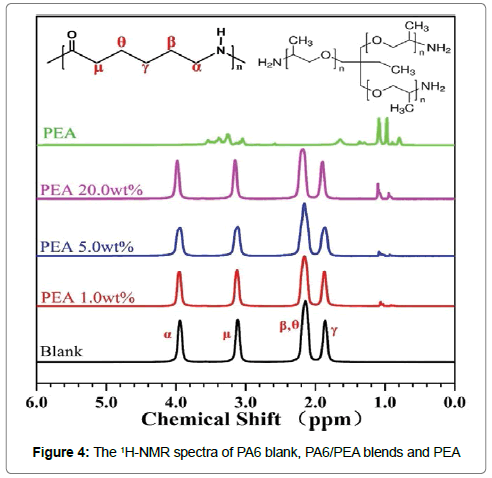
The 1H-NMR spectra of PA6 blank, PA6/PEA blends and PEA were depicted in Figure 4. Clearly, no any new signal can be observed for the blends and the spectra of the blends were only the overlap of those of PA6 blank and PEA. This result should indicate that there was no obvious chemical reaction between PA6 and PEA during the melt-mixing.
WAXD
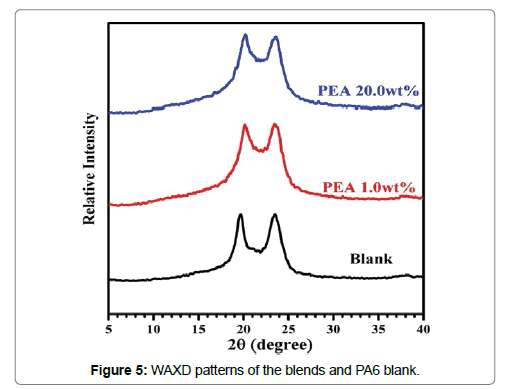
WAXD was used to check the effect of PEA on the crystal structure of PA6. As shown in Figure 5, it is clear that WAXD patterns of the blends were almost the same as PA6 blank. For all the samples, the diffraction peaks were observed at scattering angle 2θ of 19.0° and 23.5°, corresponding to γ (2,0,0) and γ (0,0,2/2,2,0) planes of the PA6 blank, respectively. Furthermore, no additional new diffraction peak was detected for the blends [15-19]. These results indicated that the inclusion of PEA into PA6 matrix did not influence the crystal structure of PA6 and PA6 in the blend crystallized in the stable γ form under the studied conditions [15,20].
Relative viscosity (ηr)
The relative viscosity (ηr) of PA6/PEA blends was measured to check if there was decrease in the molecular weight during the melt-mixing and the results were listed in Table 1. The relative viscosity (ηr) of the blend was about 2.9 and almost the same as PA6 blank, which confirmed that there is no obvious change in molecular weight of PA6. This result was in agreement with the results of FTIR and 1H-NMR.
| hr | Average | Variance |
|---|---|---|
| Blank | 2.85 | 0.06 |
| PEA 1.0wt% | 2.79 | 0.01 |
| PEA 5.0wt% | 2.85 | 0.06 |
| PEA 20.0wt% | 2.89 | 0.02 |
Table 1: The relative viscosity (ηr) of PA6 blank and PA6/ PEA blends.
The thermal properties
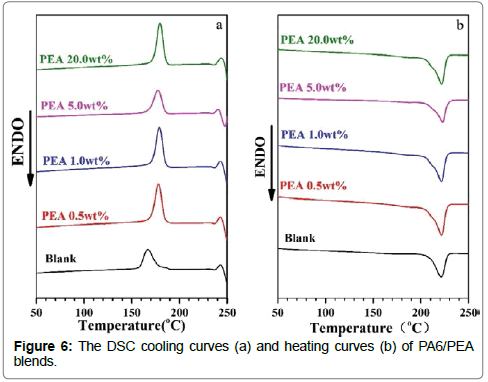
The thermal properties of PA6/PEA blends with PEA contents of 0.5-20wt% were evaluated with DSC. The DSC curves were plotted in Figure 6 and the results were summarized in the Table 2. The crystallization enthalpy ΔHc, the melting enthalpy ΔHm and the meltcrystallization temperature Tc of PA6 component in the blend were some higher than those of PA6 blank (Figure 6 and Table 2), which suggested that PEA enhanced the crystallization of PA6 component under the studied conditions. The enhanced crystallization may be due to that PEA improved the chain mobility of PA6. On the other hand, the melting temperature Tm of PA6 component in the entire blend is about 221°C, which hardly changed with PEA content and almost the same as that of PA6 blank (Figure 6 and Table 2). These results should also indicate that there are no obvious chemical reactions between PA6 and PEA.
| Sample | Tc (°C)a | ΔHc (J/g)a | Tm (°C)b | ΔHm (J/g)b |
|---|---|---|---|---|
| Blank | 167 | 40 | 221 | 43 |
| PEA 0.5wt% | 178 | 66 | 222 | 72 |
| PEA 1.0wt% | 179 | 66 | 221 | 68 |
| PEA 5.0wt% | 178 | 55 | 223 | 58 |
| PEA 20.0wt% | 180 | 48 | 220 | 51 |
a Determined by the cooling curves; b Determined by the heating curves.
Table 2: The thermal properties of PA6/PEA blends.
Mechanical properties
It is well known that the addition of low molecular organic additives usually depresses the mechanical strength. As to PEA, one may wonder the case is similar. Thus, the tensile properties of PEA1.0wt% blend was measured and listed in Table 3 to check whether the loading of PEA affected the strength of PA6. From Table 3, it was clear that the two samples had almost the same tensile properties, which indicated that an addition of PEA 1.0wt% almost didn’t affect the strength of PA6 under the investigated conditions. This result should be due to the following two facts: one was the low loading of PEA and another was the enhancement effect of PEA on PA6 crystallization as mentioned previously.
| Properties | Teat standard | Blank | PEA 1.0wt% |
|---|---|---|---|
| Thermal deformation temp. (℃) a | ASTM D648 | 62.5 | 62.5 |
| Tensile strength (MPa) b | ASTM D638 | 64.6 ± 1.2 | 62.8 ± 0.8 |
| Tensile modulus (GPa) b | ASTM D638 | 1.82 ± 0.04 | 1.82 ± 0.04 |
| Bending strength (MPa) c | ASTM D790 | 90.1 ± 0.7 | 88.5 ± 2.2 |
| Flexural modulus (GPa) c | ASTM D790 | 1.99 ± 0.08 | 2.07 ± 0.09 |
| Notched impact strength (J/m) d | ASTM D256 | 87 ± 2 | 77 ± 1 |
| Mold shrinkage (%) MD e | ASTM D955 | 2.2 | 2.2 |
| Mold shrinkage (%) TD e | ASTM D955 | 2.0 | 2.0 |
| Shore hardness | ASTM D2240 | 72 | 72 |
a Measured under a heating rate of 2℃/min and load of 1.8MPa; b Measured at 23℃ with a rate of 50mm/min; c Measured at 23℃ with a rate of 1.3mm/min; d Measured at 23℃; eMeasured at 23℃ after aging for 24h.
Table 3: The mechanical properties of PA6 blank and PEA 1.0wt%.
The rheology behavior
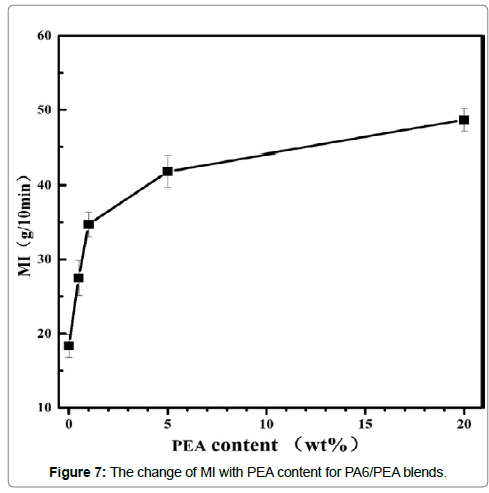
The effect of PEA on the rheology properties of PA6 was evaluated by melt indexer. The melt index (MI) of the blank was 18g/10min at 250°C under a load of 2.16kg. With the incorporation of PEA 0.5wt%, 1.0wt%, 5.0wt% and 20.0wt%, the MI increased to 28g/10min, 35g/10min, 42g/10min and 49g/10min (Figure 7), respectively. Obviously, the increase of MI was very fast at the beginning and then became slow with the increase of PEA content. The reason of this behavior is not clear in the present stage. One possible reason may be the aggregation of PEA in PA6 matrix for high loading of PEA. Anyway, the MI data unambiguously demonstrated that PEA significantly improved the melt flowability of PA6. As PEA form hydrogen bonds with the C=O groups in PA6 chains as suggested by FTIR results, some of the hydrogen bonds between PA6 chains should have been broken and the interaction between PA6 chains has been weaken with the introduction of PEA. As a result, the melt flowability of PA6 increased and MI increased with PEA content under the studied conditions.
Conclusions
Trimethylolpropane tris[poly(propylene glycol), amine terminated] ether (PEA) was incorporated into PA6 matrix by melt-mixing to modify its properties. FTIR, 1H-NMR and relative viscosity measuring results suggested that there is no obvious chemical reaction or degradation during the blending. However, DSC results revealed that PEA enhanced the crystallization while didn’t affect the melting point and crystal structure of PA6 component in the blends with PEA content lower than 20.0wt%. Furthermore, the incorporation of PEA can significantly improve the melt flowability of PA6 without the loss of mechanical properties as demonstrated by MI and Mechanical properties measurements. All the results suggested PEA was a very effective viscosity reducer for PA6.
Acknowledgements
This work was supported by the Fundamental Research Funds for the Central Universities (2232015A3-06, 2232015A3-01), and Shanghai Natural Science Foundation (15ZR1400100).
References
- Fei G, Liu Y, Wang Q (2008) Synergistic effects of novolac-based char former with magnesium hydroxide in flame retardant polyamide-6. Polym Degrad Stab 93: 1351-1356.
- Feinberg SC (2004) Ionomer/polyamide blends with improved flow and impact properties. US, US6756443.
- Fan Z, Jaehnichen K, Desbois P, Haeussler L, Vogel R, et al. (2009) Blends of different linear polyamides with hyperbranched aromatic AB2 and A2+B3 polyesters. J Polym Sci Part A: Polym Chem 47: 3558-3572.
- Huber T, Pötschke P, Pompe G, Häßler R, Voit B, et al. (2000) Blends of hyperbranched poly (ether amide) s and polyamide-6. Macromol Mater Eng 280: 33-40.
- Monticelli O, Oliva D, Russo S, Clausnitzer C, Pötschke P, et al. (2003) On blends of polyamide 6 and a hyperbranched aramid. Macromol Mater Eng 288: 318-325.
- Joachimi D, Büchner O (2013) Thermoplastics having improved flow. WO, EP2300537.
- Crevecoeur G, Borggreve R J M (1994) Polymer composition. EP, EP0624623.
- La Mantia F P, Valenza A, Paci M, Magagniniet P L (1989) Liquid crystal polymers (LCP) as processing aids and reinforcing agents. A study of nylon 6/LCP blends. J Appl Polym Sci 38: 583-589.
- La Mantia F P, Valenza A, Paci M, MagagniniP L (1990) Rheology-morphology relationships in nylon 6/liquid-crystalline polymer blends. Polym Eng Sci 30: 7-12.
- La Mantia F P, Saiu M, Valenza A, Paci M, Magagnini P L (1990) Relationships between mechanical properties and structure for blends of nylon-6 with a liquid crystal polymer. Eur Polym J 26: 323-327.
- La Mantia F P, Valenza A (1990) Processing and properties of blends with liquid-crystal polymers. Macromol Symp 38: 183-193.
- Wang X, Xiong Q (1992) Studies on blends of nylon 6 and a thermotropic liquid crystalline polyarylester (II). Morphology and rheology. Chem. Res. Chin Univ 8: 121-125.
- Wang C, Hu F, Yang K, Hu T, Wang W, et al. (2015) Synthesis and properties of star-branched nylon 6 with hexafunctional cyclotriphosphazene core. RSC Adv 5: 88382-88391.
- Fu P, Wang M, Liu M, Jing Q, Cai Y,et al.(2011) Preparation and characterization of star-shaped nylon 6 with high flowability. J Polym Res 18: 651-657.
- Arimoto H (1964) α–γ Transition of nylon 6.J Polym Sci Part A: Polym Chem 2:2283-2295.
- Arimoto H, Ishibashi M, Hirai M, ChataniY (1965) Crystal structure of the γ-form of nylon 6.J Polym Sci Part A: Polym Chem 3: 317-326.
- Galeski A, Argon A S, Cohen R (1991) Deconvolution of X-ray diffraction data to elucidate plastic deformation mechanisms in the uniaxial extension of bulk nylon 6. Macromolecules 24: 3945-3952.
- Holmes D R, Bunn C W, Smith D J (1955) The crystal structure of polycaproamide: Nylon 6. J Polym Sci Part A: Polym Chem 17: 159-177.
- Psarski M, Pracella M, Galeski A (2000) Crystal phase and crystallinity of polyamide 6/functionalized polyolefin blends. Polymer 41: 4923-4932.
- Jones N A, Atkins E D T, Hill M J, Cooper S J, Franco L (1997) Chain-folded lamellar crystals of aliphatic polyamides. Investigation of nylons 4 8, 4 10, 4 12, 6 10, 6 12, 6 18 and 8 12. Polymer38: 2689-2699.
 Spanish
  Chinese
  Russian
  German
  French
  Japanese
  Portuguese
  Hindi
Hindi 