Research Article, J Mar Biol Oceanogr Vol: 7 Issue: 1
Evaluation of Ruditapes spp. Clam Stock on the Western Coast of Cotentin (English Channel)
Olivier Basuyaux1*, Florence Beck2, Jean-Philippe Pezy2, Alexandrine Baffreau2, Yann Joncourt3, Xavier Tétard4 and Jean-Claude Dauvin2
1SMEL, Centre expérimental, ZAC Blainville-sur-Mer, 50560 Blainville-sur-Mer, France
2Normandie Uni., UNICAEN, UNIROUEN, Morphodynamique Continentale et Côtière, CNRS UMR 6143 M2C, 24 rue des Tilleuls, F-14000 Caen, France
3GEMEL Normandie, CREC, Station Marine, Université de Caen Normandie, 54 rue du Docteur Charcot, BP 49, 14530 Luc-sur-Mer, France
4Comité Régional des Pêches Maritimes de Normandie, 9 Quai Général Lawton Collins, 50100 Cherbourg-en-Cotentin, France
*Corresponding Author : Olivier Basuyaux
Synergie Mer Et Littoral, F-50560, Blainville sur mer, France
Tel: +33 2 33 76 57 71
Fax: +33 2 33 76 57 79
E-mail: obasuyaux@smel.fr
Received: December 27, 2017 Accepted: January 08, 2018 Published: January 15, 2018
Citation: Basuyaux O, Beck F, Jean-Philippe P, Baffreau A, Joncourt Y, et al. (2018) Evaluation of Ruditapes spp. Clam Stock on the Western Coast of Cotentin (English Channel). J Mar Biol Oceanogr 7:1. doi: 10.4172/2324-8661.1000186
Abstract
Evaluation of Ruditapes spp. Clam Stock on the Western Coast of Cotentin (English Channel)
The Manila clam Ruditapes philippinarum (Adam and Reeve 1850) was introduced into France in the 1970s and now dominates the European clam Ruditapes decusattus (Linnaeus 1758) in the intertidal zone of the western Cotentin (English Channel). While it has successfully colonized a large variety of sediment habitats, from muddy sand to gravel, the densities remain< 20 ind. m-2. In this extensive intertidal zone, it is difficult to estimate the density as well as the stock of such dispersed species of clam. Our study has three main objectives: i) to determine a better sampling strategy to estimate the density of Ruditapes spp. clam populations; ii) to assess the spatial distribution of clams at the scale of the western coast of Cotentin (30 km of coastline from North to South), and iii) to evaluate the stock and annual quantities of clams fished by recreational and professional fishing in this area. For the estimation of densities and stock of Ruditapes spp., it is better to continue using a quadrat area of 1 m² for a large number of random sampling points (≥ 400) to estimate with the greatest possible spatial precision the local and regional abundance of such low-density populations. Sampling techniques with smaller quadrats and more sampling points lead to higher standard deviation of the mean densities. The species are distributed in four main patches covering between 0.54 to 3.14 km² out of a total of 10.47 km² (~ 10% of the intertidal zone). The 2015 stock (Ruditapes> 40 mm, legal catch size) in these four patches is estimated as 382 t (fresh weight with shell) for a total of harvest of 122 t (32% of the adult stock), which corresponds to a catch of 8 t by professional fishers and 113 t by recreational fishers.
Keywords: Ruditapes decussatus; Ruditapes philippinarum; Sampling experimental strategy; Stock estimation; Harvesting
Introduction
There are almost two million recreational fishers in France and their numbers continue to rise. The practice is diversified and involves many fished target species, tools and techniques. It is an essential part of coastal tourism, in particular on the west coast of the Cotentin (western part of the English Channel) [1]. On this part of the coastline, the habitats are heterogeneous and include a wide intertidal zone with sandy to rocky shores, but which are rarely muddy due to the high-energy dynamics of the tidal current in an area where the tidal range can reach 12 m during spring tides [2,3]. Moreover, the extensive intertidal zone is also used for many activities such as sports, aquaculture (mussels, oysters, etc.) and fishing (professional and recreational). This environment is protected by regulations on the size and quotas of fished species as well as the gear used to ensure the sustainability of fishing activities [1].
The Manila (= Asari) introduced clam Ruditapes philippinarum and the native grooved carpet shell clam Ruditapes decussatus are among the main target species for recreational and professional fishing on the west coast of Cotentin.
Nevertheless, previous studies have shown that Ruditapes have low densities over the intertidal zone of the western coast of Cotentin (often< 10 individuals per m²), with a very heterogeneous pattern of distribution in relation to a wide variety of sediment habitats in this area [3,4,5].
It is relatively well established that the sampling method has a considerable impact on estimates of species richness and abundance [6]. Hence, a major concern in benthic ecology studies is the development of sampling designs to obtain estimates of macrobenthos density [7]. There is a large debate about the suggested benthos sampling design when dealing with contagious distribution patterns such as in the case of dominant bivalve species on tidal sand or mud flats [6-10]. A large variety of sampling strategies have been used, including random, stratified, systematic and sequential designs around the world, from small corers to large surfaces (Table 1). Moreover, most of these authors studied the spatial structure of bivalves by pooling several sampling surfaces to find the most suitable way of integrating the cost of such sampling strategies requiring long periods in the field. The following question arises: what unit surface must be chosen to obtain the best estimate of clam densities on the intertidal zone of the western coast of Cotentin taking into account the extensive area (> 100 km²), low clam densities and highly heterogeneous sediment and clam distribution.
| Site | Target species or group | Sampling design | Sampling size | Reference |
|---|---|---|---|---|
| Sand ï¬Â‚ats off Wiroa Island, in Manukau Harbour, New Zealand | Macomona liliana Iredale, 1915 Austrovenus stutchburyi (W. Wood, 1828) |
200 grid cells of 25 m × 25 m each from a global surface of 250 m × 500 m | 0.50 m × 0.5 m × 0.15 m depth for large bivalves and core sampler of 0.13 m diameter × 0.15 depth for juveniles | [8] |
| Intertidal mudflat in the upper Tagus estuary, Portugal | Macrobenthic infauna | Square area of 2.25 m on a side, divided into 225 small quadrats | 0.15 × 0.15 m square core sampler × 0.20 m depth in each quadrat for a 5.0625 m² total area sampled | [7] |
| Four eelgrass habitats from Willapa Bay, Washington, USA | Macrobenthic infauna | 4 sample unit areas: 0.005, 0.010, 0.015, and 0.020 m² | two depths : 0-0.05 and 0-0.10 m, and two sieve mesh sizes: 1.0 and 0.5 mm | [23] |
| Five intertidal soft-bottom areas in northwest Europe: Wadden Sea, Netherlands; Wash, UK; Mont-Saint-Michel Bay, France; Aiguillon Bay and Oleron, French Atlantic coast | Molluscs | Dense grid of stations per site : > 200 | One core (0.15 m diameter) covering 1/56 m² to a depth of 0.20-0.25 m at each station | [17] |
| Wadden Sea tidal flats, Netherlands | Bivalves | Long-term monitoring at numerous stations at various distances (0-10 km) from the shoreline. | Most of the sites comprised 1-km long transects including 50 core samples of nearly 0.02 m² taken at intervals of 20 m, making up a total sampled area of 0.95 m² per site. | [6] |
| Bourgneuf Bay, French Atlantic coast | R. philippinarum (Adams and Reeve, 1850) | 96 sampling points for a reference site and 89 stations for a site impacted by fishing. | 0.1 m² (0.4 × 0.25 m) at each point | [9] |
| Northern Brazilian mangrove, south-eastern Atlantic | Anomalocardia flexuosa (Linnaeus, 1767) | Two sites and delimited sampling zone of 200 m² for each site, samplings at several dates | 3 sampling units: 0.007854 m² corer (0.10 m diameter) × 0.20 m depth; 0.25 m² quadrat and 1 m² quadrat (the 0.25 m² being randomly placed in the 1 m²) × 0.20 m depth. | [10] |
| Western coast of Cotentin, English Channel, France | Ruditapes spp. and macrobenthic infauna | 3 sediment sites and 4 stations (10 m²) per site | Infauna sampled with a 0.20 m diameter hand corer (1/32 m²) to a depth of 0.15 m ; 8 replicates per station to a total sampling of 0.25 m² Ruditapes spp. sampled with a rake on 10 m² and 0.15 m depth |
[3] |
| Kneiss islands mudflats, Gulf of Gabès, Tunisia | Ruditapes decussatus (Linnaeus, 1758) | 8 fishing stations and 1 Control station without harvesting | 4 replicates using a 0.15 m diameter hand corer (0.018 m²) and a total surface-area of 0.072 m² per station × 0.3 m depth. | [22] |
| Western coast of Cotentin, English Channel, France | Ruditapes spp. | 4 target sites 30 km of intertidal zones × 2 km large | 4 sampling units per site: 16 × 1/32 m² (hand corer), 6 quadrates of 0.30 m; 6 replicates of 1 m², le replicates of 10 m² × 0.15 m depth 596 randomly points of 1 m² including 424 points for sediment analyses with a 0.05 m-diameter corer × 0.15 m depth |
This study |
Table 1: Sampling strategies used for the study of intertidal in fauna and bivalves around the world, from small corers to large surfaces.
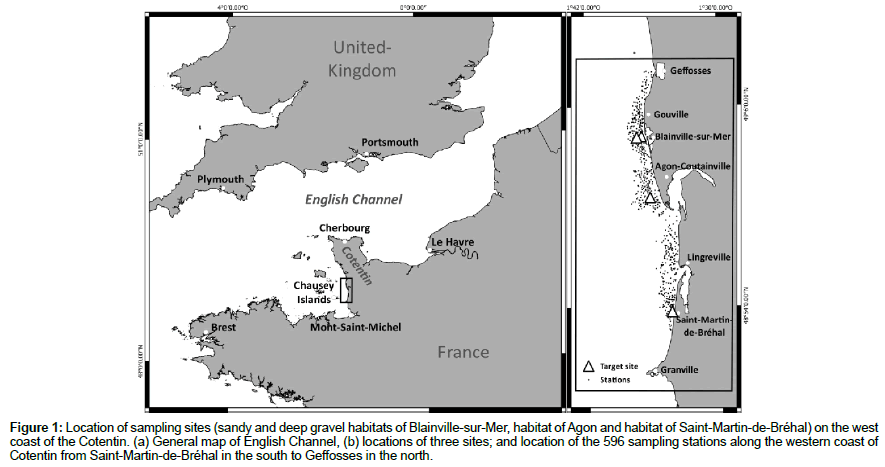
The present study on the clam populations along the western cost of Cotentin (Figure 1) has three main objectives: 1) to find an improved method to estimate the density of dispersed clam populations; 2) to assess the spatial distribution of clams at the scale of the western coast of Cotentin, and 3) to evaluate the annual quantities of clams fished by recreational and professional fishing in this area. The originality of our study comes mainly from method to map over a large area (~ 100 km²) for a heterogeneous habitat with low clam densities. Moreover, this is the first study in France which proposes a method for assessment of densities and biomasses with parallel assessment of the pressures of professional and recreational fishers.
Figure 1: Location of sampling sites (sandy and deep gravel habitats of Blainville-sur-Mer, habitat of Agon and habitat of Saint-Martin-de-Bréhal) on the west coast of the Cotentin. (a) General map of English Channel, (b) locations of three sites; and location of the 596 sampling stations along the western coast of Cotentin from Saint-Martin-de-Bréhal in the south to Geffosses in the north.
Material and Methods
Sampling site
Located in the Normano-Breton Gulf, the wide intertidal zone extending from Saint-Martin-de-Bréhal to Geffosses is located on the western coast of the Cotentin Peninsula (Figure 1). The upper shore face is composed mainly of sandy dunes undergoing intense erosion, along with sandy intertidal dunes and tidal flats subject to rapid displacements owing to high-energy hydrodynamics in a megatidal environment (tidal range reaching 12 m during equinoctial spring tides) [3]. The foreshore corresponds to a mixture of rocky and sandy areas, sometimes with soft-bottom patches included in the hard substratum providing habitats for bivalve species [2,3]. The sampling was carried out along the whole 30 km of the coastline from north to south, and then on four target sites, two at Blainville-sur-Mer, one at Agon-Coutainville and the last one at Saint-Martin-de-Bréhal (Figure 1).
Sampling strategy on four target sites
At each of the target sites, six randomly selected sampling stations of 10 m² (2 × 5 m) were raked in 2016 over their entire surface-area to a depth of 0.15 m depth. Three stations were raked on 26 February and the three others on 23 March for both of the sites at Blainvillesur- Mer, on Sand (BSMS) and Deep Gravelly habitats, in a mixed gravely and rocky habitat (BSMDG). For the sites at Agon (AGON) and Saint-Martin-de-Bréhal (SMDB), three stations were raked on 7 March and the three others on 6 April at AGON and on 8 March and 7 April (three at each occasion) at SMDB. To examine the particle-size distribution, the sediment was collected with a shovel, removing the surface layer to a depth of 0.15 m from each site and in each of the six largest quadrats (10 m²), and then stored in a freezer at –20°C until their analysis.
At each of the four target sites, on the first sampling date, six quadrats of 1 m² were selected at random (outside the stations of 10 m²) and raked to 0.15 m depth. Then, a stainless-steel hand corer (0.20 m diameter) was used to collect sixteen samples each covering an area of ~ 1/32 m², corresponding to a total sampled surface-area of 0.5 m² per site (Figure 2).
Furthermore, for each site, we also tested a sampling protocol proposed by the ‘Fédération Nationale des Pêcheurs Plaisanciers et Sportifs Français’ [11] to estimate the abundance of Ruditapes spp. populations at the scale of the French Atlantic seaboard and the English Channel coast (about 3,700 km of coastline). In a first step, we delimited an area of 100 m × 50 m and placed a sampling station at the each of its corners plus an intermediate station at 50 m on the long side of the rectangle (Figure 2). At each of the six selected stations, three random samples were collected from a 0.30 m quadrat to depth of 15 cm depth, corresponding to a total area of 0.27 m² per station and 1.62 m² per site.
In summary, we applied four sampling strategies at each site, corresponding to an area of 0.5 m² for core sampling, 1.62 m² for quadrat sampling, 6 m² for the 1-m² square and 60 m² for the of 10-m² rectangle (Figure 2). Then, all the clam abundance data were transformed to 1 m².
The target clam species were identified to species level (R. deccusatus and R. philippinarum) and their maximum length was measured using an automatic calliper with a precision of 0.05 mm.
Sampling strategy for total population
The sampling strategy used for Ruditapes spp. at the scale of the 30 km of coast is drawn from the approach of Bertignac et al. [12]. The coast from Saint-Martin-de Bréhal in the south to Gefosses in the north (Figure 1) is divided into sectors of 1 km of latitude. On each sector, the geographical coordinates of 10 points were chosen randomly for a theoretical number of 451 points. In reality, 27 points were not accessible in the field and a total of 424 points were sampled. The precise localisation of each point was carried out by a Global Positioning System (GPS). In a second step, 172 points were randomly added in those sectors where the clams showed the highest densities. The samples were collected from February to May 2015, making a total of 596 points available for estimating the density of clams in 2015. At each point, sampling was performed using a 1 m × 1 m square PVC quadrat, and the sediment was raked to a depth of 0.15 m depth and then sieved on a 5 mm mesh size to collect all the clams. A supplementary sediment sample was taken at each of the 424 points with a 0.05 m-diameter corer of to a depth of 0.15 m, and then stored in a freezer at –20°C until analysis.
The maximum length of Ruditapes spp., without distinction between R. decussatus and R. philippinarum, was measured in the field using a manual calliper with a precision of 0.1 mm.
Sediment analysis
In the laboratory, the sample was desalted with freshwater by successive washing for remove any trace of salt causing crystallisation in the grain aggregates. When the sediment contained a significant proportion of very fine particles (<63 μm), these latter were firstly separated from the rest of the sample. Then, the sample was dried in an oven at 60°C for 24 or 48 h and passed through a column of 8 sieves (mesh sizes from 2 mm to 63 μm) with mesh sizes based on the Wentworth [13] classification, using a vibrating sieve (frequency of 60 per min) for 15 min. In this way, four main categories of sediment can be defined: silt-clay< 63 μm; fine and medium sand: 63 to 500 μm; coarse sand and gravel 500 μm to 2 mm, and gravel> 2 mm. The Folk [14] diagram was used to define the sediment type at each site.
Statistical analyses
Before each ANOVA, Shapiro-Wilk normality test and Bartlett’s test for homogeneity of variances were performed to confirm whether the assumptions of ANOVA were met and if it was necessary to transform the data. Tukey’s Honestly Significant Difference (HSD) test was used to determine the difference between the sampling strategy, sites and the size structure at the four sites, as well as the substratum preference of clams.
Results
Estimation of Ruditapes spp. densities
The sediment is relatively homogenous at the scale of the four target sites and corresponds to sandy Gravel at BSMS, Gravel, sandy Gravel and muddy sandy Gravel at BSMDG, Gravel and sandy Gravel at AGON, and muddy sandy Gravel at SMDB.
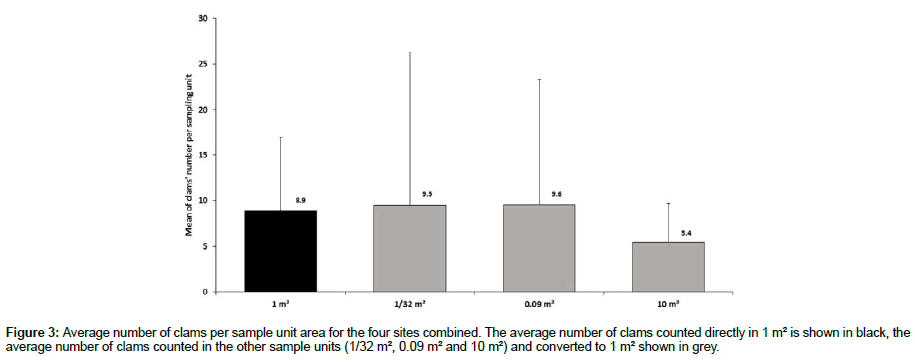
When the average numbers of sampled clams per sampling unit are combined for the four sites, we find a slight overestimation of the average clam density over areas of 1/32 m² and 0.09 m² when converted to 1 m², compared to the average clam density obtained directly from 1 m² sampling quadrats. However, there is a large variability in the number of clams per replicate for the same sampling unit (Figure 3). Nevertheless, we observe no statistical differences between densities estimated with the four sampling techniques (ANOVA, F3,180 = 0.62; p = 0.6) (Table 2).
| F | p-value | Tukey test | ||
|---|---|---|---|---|
| Different techniques | 1 m² | 10.31 | < 0.01 | BSMS different to AGON and SMDB |
| 1/32 m² | 1.45 | 0.24 | - | |
| 0.09 m² | 8.11 | < 0.01 | BSMS different to AGON, SMDB, and BSMDG | |
| 10 m² | 13.88 | < 0.01 | BSMS different to AGON and BSMDG | |
| Different sites | AGON | 2.60 | 0.06 | - |
| SMDB | 0.12 | 0.95 | - | |
| BSMS | 1.7 | 0.18 | - | |
| BSMDG | 0.54 | 0.66 | - |
Table 2: Results of ANOVA statistical tests.
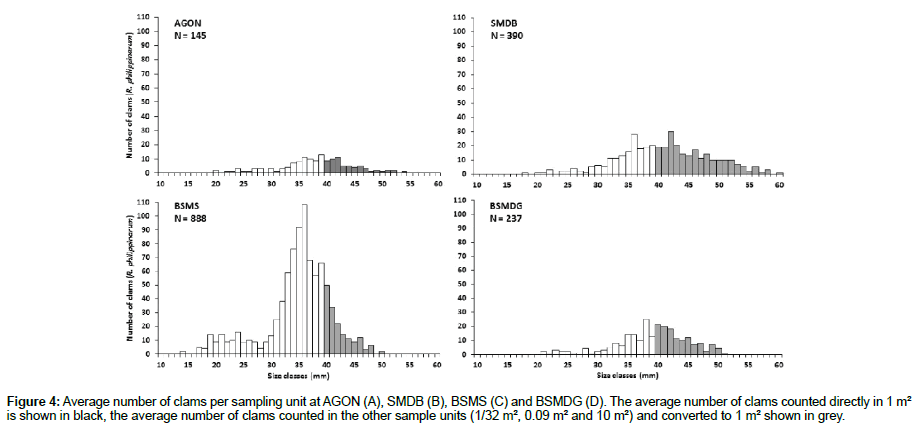
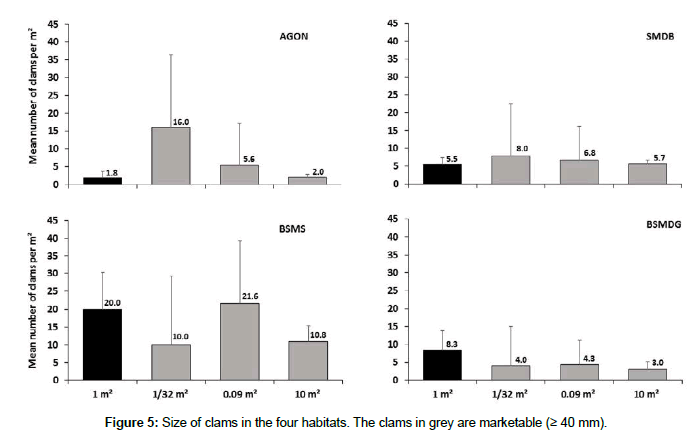
For AGON, where 145 clams (Ruditapes spp.) were fished, there is a clear overestimation when the average number of clams collected from an area of 1/32 m² is converted to 1 m², with almost 9 times more clams. When the average number of clams from the 0.09-m² quadrats is converted to 1 m², this leads to a threefold overestimation of the density. However, after conversion to 1 m², the average number of clams collected from the 10-m² quadrats differs only slightly from the results obtained directly from the 1-m² quadrats (Figure 4A). For SMDB, where 390 clams were harvested, the average number of clams found in 1/32 m² leads to a 1.5-fold overestimation of the density, after conversion to 1-m², compared with the results obtained from 1 m² quadrats. This difference is less marked when the average number of clams found in the 0.09-m² and 10-m² quadrats are converted to 1 m². Similarly, after conversion to 1 m², the average number of clams found in the 10-m² quadrats at AGON shows very little difference with the average number of clams found directly in 1 m² (Figure 4B). At BSMS, where 888 clams were harvested, converting the average number of clams from stations with replicates of 1/32 m² and 10 m² quadrats leads to a twofold underestimation the average number of clams counted directly in quadrats of 1 m². However, conversion of the average number of clams in the 0.09-m² quadrats yields values close to the average number of clams found in replicates of 1-m² quadrats (Figure 4C). At BSMDG, where 237 clams were fished, the average value is divided by a factor of two or three when the average number of clams per sampling unit is converted to 1 m² (Figure 4D).
Comparison of abundances and size structure of clams in the four target sites
A total of 1,296 clams were collected from the six stations, using 10-m² quadrats at each site, showing that the relative proportion of the European clam R. decussatus is very low in the four habitats: 2.1% of the clams fished at AGON, 1.9% at BSMS, 1.4% BSMDG and 0.3% at SMDB. The total clam (Ruditapes spp.) abundance ± standard variation is higher at BSMS (109 ± 45 ind. 10 m²) and SMDB (57 ± 12 ind. 10 m²) than at BSMDG (30 ± 22 ind. 10 m²) and AGON (20 ± 9 ind. 10 m²) (ANOVA, F3,20 = 13.88, p<0.01; Tukey test) (Table 3).
| Sector | Saint-Martin-de-Bréhal | Lingreville | Agon-Coutainville | Blainville- Gouville | Total |
|---|---|---|---|---|---|
| Sampling area in m² | 56 | 11 | 52 | 26 | 201 |
| Total area (km2) | 3.14 | 0.54 | 3.06 | 3.73 | 10.47 |
| Sampling effort (m²/km²) | 18 | 20 | 17 | 22 | 19 |
| Numbers of clams per m² | 2.34 ± 1.0a | 1.36 ± 0.8ac | 0.60 ± 0.23bc | 1.1 ± 0.4bc | 1.34 ± 0.3 |
| Average length in mm | 46.3 ± 1.4a | 44.1 ± 2.3ab | 45.3 ± 1.5ab | 44.9 ± 0.9ab | 45.3 ± 0.5 |
| Estimated individual average weight (fresh weight with shell in g) | 29.4 ± 2.6 | 25.4 ± 4.1 | 27.2 ± 2.4 | 26.5 ± 1.0 | 27.3 ± 1.0 |
| Estimated number of clams in millions | 7.3 ± 3.2 | 0.7 ± 0.5 | 1.7 ± 0.7 | 4.2 ± 1.5 | 14.0 ± 3.6 |
| Estimated biomass in t | 216 | 18 | 48 | 112 | 382 |
| Min-Max in t | 123-308 | 7-30 | 28-67 | 72-152 | 284-480 |
| Biomass caught per recreational fishermen | 74.7 | 7.5 | 1.5 | 29.2 | 112.9 |
| Biomass caught per professional fishermen | 0.03 | 0 | 0.12 | 7.89 | 8.04 |
Table 3: Sampled area, total area, sampling effort, number of clams (> 40 mm) and estimation of biomass in the six sectors in 2015. Numbers of clams per m² and average length in mm; values with the same superscript letters do not differ significantly (Tukey-test, p<0.001).
The minimum marketable size of clams is 40 mm (https://www.legifrance.gouv.fr). The size structure is given here only for the dominant species R. philippinarum (Figure 5). At AGON, 40 % of clams reach the minimum size to be harvested (≥ 40 mm); the smallest shell length is 19.3 mm and the largest 54.4 mm (mean size = 38.30 mm). At SMDB, 56.0 % of clams show a size ≥ 40 mm, with the smallest 18.2 mm and the largest 60.7 mm (mean size = 41.3 mm). At BSMS, only 18.1 % of clams reach 40 mm, while the smallest are 14.3 mm and the largest 50.9 mm (mean size 35.1 mm). At BSMDG, 46.5 % of clams have a size ≥ 40 mm, the smallest being 20.5 mm and the largest 51.4 mm (mean size 39.67 mm) (Figure 5).
Significant differences are observed in clam size (ANOVA, F3,1656=89.99, p<0.001). SMDB shows a population with a large proportion of marketable size compared to the other sites (Tukey test), whereas, at BSMS, the population is composed of a maximum of small individuals compared to the other sites (Tukey test).
Pattern of clam distribution and stock evaluation along the western coast of Cotentin
Clams are observed in 177 of the 596 1 m² quadrats (~30 % of the quadrats contain at least one Ruditapes spp.). The maximum number of clams per m² is 52, while, for the marketable clams (> 40 mm) this value falls to 23. Taking into account only the quadrats with clams, the mean density is 5.1 ± 7.0 clams.m² and 2.5 ± 2.9 clams.m² with a size> 40 mm. If all the 596 quadrats are considered, we obtain a mean density of 1.5 ± 4.5 clams.m² and 0.5 ± 1.6 clams.m² with a size> 40 mm.
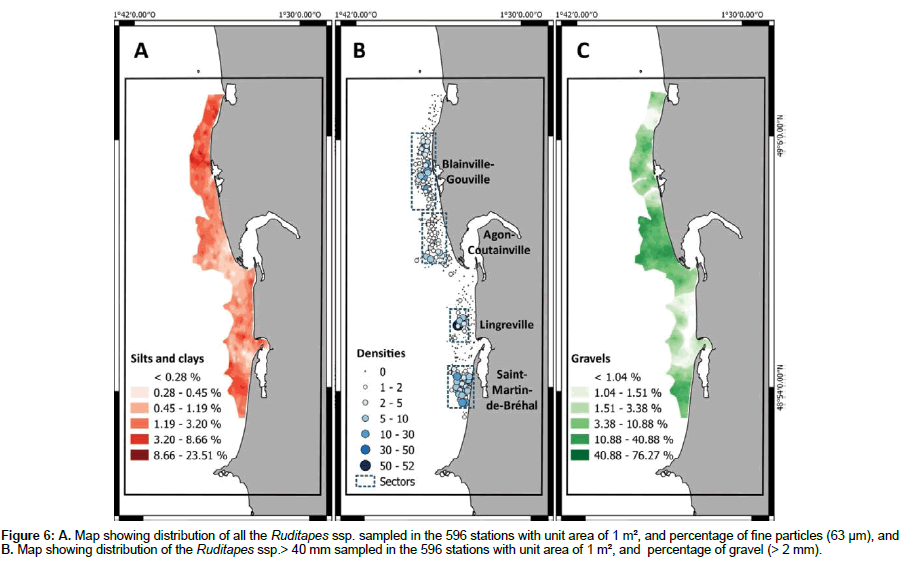
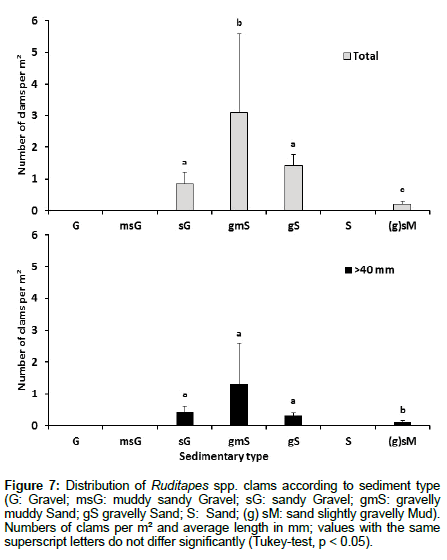
At the scale of the western coast of Cotentin, the distribution of clams is very heterogeneous. We can identify four main sectors with high densities, namely Saint-Martin-de-Bréhal, Lingreville, Agon-Coutainville and Blainville-Gouville (Figure 6). The sampled intertidal zone is mainly characterized by gravelly sand and sand (75% of the analyses) and contains very few points corresponding to mud, muddy sand or pure gravel sediment. Clams are predominantly found in gravelly muddy sands, gravelly sands and sandy gravels (Figure 6). The SMDB and Blainville-Gouville sectors with high densities of clams are characterized by high proportions (> 3%) of fine particles<63 μm, while the sectors of AGON and SMDB show high proportions (> 10%) of gravel (> 2 mm) (Figure 6). The proportions of mud, sand and gravel where the clam densities are highest are, respectively 6-7%, 75-85% and 20-25%, corresponding to gravelly muddy sand sediment. As shown in Figure 7, low proportions of fine particles and high proportions of gravel do not appear to favour the presence of clams. According to statistical analysis, clams are present in mainly three sedimentary types: sandy gravel, gravelly muddy sand and gravelly sand (Figure 7).
Figure 6: A. Map showing distribution of all the Ruditapes ssp. sampled in the 596 stations with unit area of 1 m², and percentage of fine particles (63 μm), and B. Map showing distribution of the Ruditapes ssp.> 40 mm sampled in the 596 stations with unit area of 1 m², and percentage of gravel (> 2 mm).
Figure 7: Distribution of Ruditapes spp. clams according to sediment type (G: Gravel; msG: muddy sandy Gravel; sG: sandy Gravel; gmS: gravelly muddy Sand; gS gravelly Sand; S: Sand; (g) sM: sand slightly gravelly Mud). Numbers of clams per m² and average length in mm; values with the same superscript letters do not differ significantly (Tukey-test, p < 0.05).
Table 3 summarizes the estimation of Ruditapes spp. stocks for the four main sectors of the western coast of Cotentin. The mean density of marketable clams is slightly higher than 1.3 ind. m²; the estimated biomass is 382 t (fresh weight with shell), with two main patches of biomass: Saint-Martin-de Bréhal (57% of the stock) and Blainville-Gouville (30% of the stock). Similarly to the sampling in the four target sites, the clams at SMDB show a higher average length than at the other sites.
Evaluation of catch by professional fishers
The activities of professional fishers are governed by a National Licence for on-foot fishing and a regional Licence for Ruditapes spp. clams. An operational ruling prefectural order (AP 42/2008) allows individual professional fishers to harvest 20 kg of clams per day (marketable clams> 40 mm). In Normandy, professional clam fishing is mainly a secondary activity; the maximum number of regional licences has been fixed at 105 since 2012 (AP 49/2016). Nevertheless, the actual number of licences is lower than the maximum allowed: i.e. 89 in 2015 and 85 in 2016. Each fisher must declare the daily capture as well the fishing sector. This professional activity takes place mainly from April to September, and is less practicable from October to March. In 2015, only 29 professional fishers were still active in 2015, declaring a total catch of 8.04 t mainly fish in the Blainville- Gouville sector (98%) (Table 3). The total catch of clams harvested by professional fishers along the Normandy coast is 17.74 t, so the sector of Blainville-Gouville sector represents 45% of the Normandy fishery (Data from the administrative fishing declaration file).
Evaluation of catch by recreational fishers
The number of recreational fishers is estimated according to the tidal coefficient (<70 at neap tide and>70 at spring tide) and for two seasons (October to March and April to September) based on LIFEPAP (Pêche à pied) surveys and counting carried out by the French Biodiversity Agency (http://www.aires-marines.fr/Partager/Projetseuropeens/LIFE-Peche-a-pied-de-loisir).
The average number of clams caught per day and per fisher is assessed from two surveys carried out in November 2015 and June 2016 during the LIFE-PAP project (Table 4). The activity is nonexistent during neap tides, low during medium tidal coefficients and high during spring tides (Table 4). Two of the four sectors show high recreational fishing activity, i.e. Saint-Martin de Bréhal and Blainville- Gouville, representing, respectively, 80% and 13% of the fishing effort during winter spring tides and 68% and 26% during summer spring tides. The estimated annual biomass caught by recreational fishers attains 112.9 t and 74.7 t for SMDB and 29.2 for Blainville-Gouville (Table 3).
| October to March | April to September | Number of clams | |||||
|---|---|---|---|---|---|---|---|
| Tidal coefficient | <70 | 70 to 95 | >95 | <70 | 70 to 95 | >95 | |
| Number of days | 84 | 70 | 28 | 82 | 77 | 24 | |
| Saint-Martin-de-Bréhal | 0 | 7 | 982 | 0 | 85 | 943 | 45 |
| Lingreville | 0 | 20 | 35 | 0 | 20 | 35 | 59 |
| Agon-Coutainville | 0 | 6 | 20 | 0 | 6 | 20 | 29 |
| Blainville/Gouville | 0 | 42 | 159 | 0 | 126 | 366 | 44 |
Table 4: Estimated number of recreational fishers according to tide and season based on LIFE-PAP counting and surveys at the French national level (http://www.aires-marines.fr/Partager/Projets-europeens/LIFE-Peche-a-pied-de-loisir), with average number of clams caught per day and per fishers according to two surveys (November 2015 and June 2016).
Discussion
Main characteristics of clam populations along the western coast of Cotentin
The Ruditapes populations of the western coast of Cotentin are mainly represented by the Non-Native Species R. philippinarum, which can be considered as an invasive species at the scale of the intertidal zone of the French Atlantic seaboard and western part of the English Channel. The success of R. philippinarum means that it has supplanted the European species R. decussatus in most of the colonized zones [15,16]. In the present study area, the Non-Native Species represents between 97.9 and 99.7% of the sampled clams, i.e. most of the clam population results from the deliberate introduction of species in the 1970s. Nevertheless, in spite of the extensive ecological niche allowing colonization of most of the heterogeneous sediment of this shore, the clam population density for the whole area remains low (<2 ind.m²). Considering only the sampling points with clams, the density reaches 5.1 ind.m², which represents ~ 30% of the total sampling points since 70% of the intertidal zone is devoid of clams (Figure 3, 4 and 6). The species are distributed in four mains patches covering between 0.54 and 3.14 km² out of a total area of 10.47 km² (~ 10% of the intertidal zone). In this study, the density estimates are of the same order of magnitude as those given by Bocher et al. [17]: 2.3 ind. m² for Ruditapes spp. in Mont-Saint-Michel Bay; Beck et al. [3] reports 4.1 and 4.7 ind. m² in BSMS and BSMDG, respectively, in 2014, but 10.9 and 3 for the same sampling sites in 2016. Along the Atlantic coast, Dang et al. [18] and Caill-Milly [19] estimate average densities of between 25 and 70 ind.m² for the Arcachon Basin. D’Hardvillé et al. [20] and Latrouite [21] obtain similar results for the northern part of the Bay of Biscay including the Morbihan Gulf. In the tidal flats of the Gulf of Gabès occupied by the eelgrass Zostera noltei, Mosbahi et al. [22] estimated the densities of Ruditapes spp. (mainly R. decussatus) as ranging between 71 to 128 individuals per m², with the densities of R. decussatus between 71 to 114 per m² for a mean value of 87.4 ± S.D. 18.1 ind.m2.
What is the most suitable sampling strategy to estimate the clam stock?
The use of several sample unit areas ranging from 1/32 m² to 10 m² to evaluate the clam density leads to overestimation or underestimation of the real number of clams when the values are converted to a sample unit area of 1-m² (Figures 3 and 4). However, there is no established rule in the four target sites. Thus, for both the sites with low clam abundances (AGON and BSMDG), converting the sampling units to 1 m² overestimates the average numbers of clams for the first site and underestimates this average for the second site. For AGON and SMDB, the conversion of 10 m² to 1 m² leads to similar average numbers of clams compared with the results obtained when using a 1-m² quadrat. For both of these sites, using a smaller sample unit size overestimates the number of clams. At BSMS, the conversion from 0.09 m² to 1 m² yields almost the same result as with the 1-m² quadrat estimation; other sample unit sizes underestimate the number of clams when converted to 1 m². At the last site (BSMDG), all the sample unit sizes underestimate the number of clams when converted to 1 m².
Sousa Da Silva et al. [10] have shown that bivalve abundances are overestimated by converting the numbers of individuals collected from 0.10-m diameter cores or 0.5 × 0.5 m quadrats to a sample unit area of 1 m². These authors stressed that, if the sampling unit is placed by chance in an area with either many or few individuals, the converted number will be either much higher or much lower, respectively, than the true number of individuals in the larger area. Many intertidal benthic studies assess macro-infaunal abundances in sediment cores with a variety of shapes (circular, rectangular or square) by expressing the densities in terms of a standard 1 × 1 m square. Although sample unit sizes even larger than 0.1 m2 might be useful for comparisons between different benthic macrofaunal studies [23], careful consideration should be given to the size of the sampling unit taking into account the type of fauna, spatial aggregation and habitat. Sousa Da Silva et al. [10] suggested that the adoption of a standard area of 1 m2 in studies of intertidal soft sediment macroinfaunal abundance may eliminate the need for density conversions and allow more reliable comparisons among similar studies in different locations.
For an adequate representation of low-density species, Beukema and Dekker [6] indicated that sample unit areas for macrobenthic animals should be sufficiently large, i.e. well over 1 m2. Similarly, Schoeman et al. [24] considered that a sample unit area of 4-5 m2 is an acceptable level of sampling effort for macrozoobenthos on sandy beaches. For macro- and mega-fauna mostly composed of large-bodied species occurring at densities of only a few per m2, large samples of several m2 appear to be indispensable to locate areas with maximal abundance [24].
So, there are a large diversity of sampling design of intertidal and mollusc fauna (Table 1). Nevertheless, the optimization of precision, accuracy and cost should be adapted in relation to the objectives of a given study [7]. Thus, an inadequate estimation of the density per m² can be a major source of error in the evaluation of bivalve stocks on an extensive intertidal zone [8].
Likewise, in the present study, we consider it is better to estimate dispersed clam populations using a sample unit area of 1 m² rather than smaller or larger areas such as 10 m² and then converting the numbers to 1 m². Small sample unit areas can overestimate or underestimate the real densities of bivalves. Larger sample unit areas such as those used in our study (10 m²) appear to be more efficient for collecting large specimens which are dispersed and which show low densities. However, for the smallest-sized and abundant populations, it will be better to select a 1 m² sample unit area, which remains compatible with the cost of the sampling effort on the intertidal zone. This protocol allows the sampling of an area of about 50 × 1 m² by a team of two persons during the period of a single low tide. In the future, we suggest that the densities and stock of Ruditapes spp. clam populations along the 30-km coastline of western Cotentin should be estimated using a unique sample unit area of 1 m² at a large number of random points (≥ 400). This would allow us to evaluate such lowdensity populations with the highest possible spatial precision.
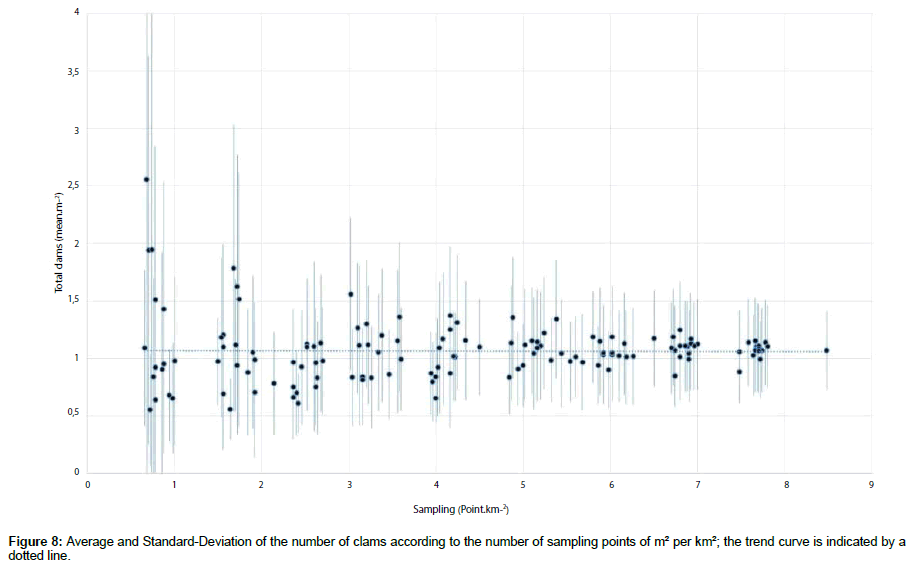
The series of data taken into account the total number of clams recorded in the 424 initial points (on the 50 km²) had been reduced by random draw. This approach permitted to obtain 15 sub-set of data according to a reduction of the number of points (10, 20, 30... 90% from the entire series). Figure 8 showed the change of the mean density and the standard-deviation average of the number of clam on the 50 km² in relation to the number of points per km². It appeared that a minimum of 6 m².km-2 is necessary to stay under a potential error of 20%. So, in the future the number of 1 m² replicates could be around 300 for the entire zone against more than 400 in the present study.
Estimation of the stock and catches by professional and recreational fishers
The clam stock of the western coast of Cotentin was estimated for the first time in 2015, yielding a figure of 382 t of marketable Ruditapes spp.> 40 mm. Since marketable clams represent ~ 40% of the population (Figure 5), and assuming an average weight of 15 g (fresh weight with shell) for clams<40 mm, the total stock should be ~ 600 t (218 t for the smallest clams and 382 t for the marketable clams).
The average number of clams fished during a period of low tide is lower than the authorized number per day (100), and ranges from 29 at Agon-Coutainville to 59 at Saint-Martin-de-Bréhal (Table 4). The total biomass caught per recreational fisher is estimated at 113 t (Table 3). For the same zones, the biomass caught per professional fisher is declared as 8 t. The total harvest per year is estimated as 122 t, which represents 31 % of the stock of marketable clams, with a ratio of 7 between the catches from recreational and professional fishing activity. In 2015, during the LIFE-PAP programme (http://www.aires.marines.fr/Partager/projets-europeeans/LIFE-Peche-a-pied-deloisir), the total clam harvest at French national level was estimated at 961 t for professional and 2,300 t for recreational fishers, with a ratio of 2.4 between recreational and professional activities. It is evident that the large number of recreational fishers and the intense harvesting associated with this activity along the western coast of Cotentin are used by economic actors as an attraction for tourists.
De Montaudouin et al. [16] estimated that current French production remains limited to 2-3,000 t per year, mainly based on professional fishing of R. philippinarum at two main sites (Arcachon and Morbihan Gulf). These authors pointed out that several environmental factors are responsible to low clam performances in France. Pathologies are identified as the key parameters to explain high mortalities. Moreover, the low condition index of clams in Arcachon Bay is among the lowest of values reported worldwide [15]; these authors explain this observation by the fact that the Perkinsosis disease is particularly prevalent, as well as the occurrence of Brown Muscle Disease, a pathology currently restricted to the Arcachon lagoon. Low chlorophyll a values in phytoplankton are also suggested as a cause of the low performance of Manila clams in such semi-enclosed areas with high production of the Japanese oyster Crassostrea gigas.
Bidegain and Juanes [25] have stressed that predation plays an important role in regulation of both R. decussatus and R. philippinatum in the Bay of Santander (southern Bay of Biscay, Spain), where both species coexist without any extreme predominance of the introduced species. Nevertheless, predation is more pronounced on the Manila clam due to its shallower burial depth in the sediment. There is a great diversity of macro-predators, including: moon snails (Euspira lewisi), sea stars (Pisaster spp.), many different birds, e.g. diving ducks (Aythya affinis), gulls (Family Laridae), crows (Family Corvidae), oystercatchers (Haematopus ostralegus ostralegus), scoters (Family Anatidae), crabs (Cancer pagurus) and bottom fish such as rays.
In the future, to assess the sustainability of clam stocks under intensive harvesting, our studies of Ruditapes populations will be focused on several topics, such as the estimation of settlement, growth and the presence of Perkinsosis disease, as well as predation by the native snail Ocenebra erinacea and the Non-Native snail Ocinebrelus inornatus. It is also important to maintain the mapping over the total area colonized by clams (~ 100 km²) and the assessment of clam stocks in parallel to the pressures of professional and recreational fishers.
Acknowledgements
This study was carried out in the Framework of the 3POC programme (Pêche à Pied à la Palourde sur la côte Ouest du Cotentin) supported by the Normandy Region and was implemented in 2014 to improve our knowledge of this resource, i.e. the distribution of species and their densities, as well as carry out an evaluation of stocks and fishing pressures. The organizations associated together in this programme are the SMEL (Synergie Mer Et Littoral), the GEMEL (Groupe d’Etudes des Milieux Estuariens et Littoraux) Normandie, the Comité Régional des Pêches Maritimes Basse-Normandie, and the UMR-CNRS laboratory « Morphodynamique continentale et côtière » of Caen University. The authors thank Florian Bargat, Claire Delecrin, Marine Martinez and Elise Plantive for their assistance during the sampling, Coralie Thouroude and Carole Brunaud for the sediment analyses and Michael Carpenter for the English revision.
References
- Sécula C (2011) Actors and coastal zone management. A social anthropology of the Mont-Saint-Michel bay. PhD Thesis National Museum of Natural History, Paris, France.
- Navon M, Dauvin JC (2013) The immediate impact of intertidal pebble fork harvesting on the warty venus Venus verrucosa benthic community. Cah Biol Mar 54: 385-392.
- Beck F, Pezy JP, Baffreau A, Dauvin JC (2015) Effects of clam rake harvesting on the intertidal Ruditapes habitat of the English Channel. ICES J Mar Sci 72: 2663-2673.
- Laspougeas C (2007) Study of natural deposits of bivalve molluscs accessible in foot fishing in Basse-Normandie, biological, fisheries and sanitary aspects. Report Financial Instrument for Fisheries Guidance, FIFG - AESN - SMEL - DDASS 50 - University of Caen, France.
- Beck F (2014) Impacts of rake fishing with clam. Effect on sediments, clams and accompanying benthic fauna. Report of Master 2, University of Littoral Opal Coast and University of Lille 1, France.
- Beukema JJ, Dekker R (2012) Estimating macrozoobenthic species richness along an environnemental gradient: sample size matters. Estuar. Coast Shelf Sci 111: 67-74.
- Cabral HC, Murta AG (2004) Effect of sampling design on abundances estimates of benthic invertebrates in environmental monitoring studies. Mar Ecol Progr Ser 276: 19-24.
- Legendre P, Thrush SF, Cummings VJ, Dayton PK, Grant J, et al. (1997) Spatial structure of bivalves in a sandflat: scale and generating processes. J Exp Mar Biol Ecol 216: 99-128.
- Beninger PG, Boldina I (2014) Fine-scale spatial distribution of the temperate bivalve Tapes (=Ruditapes) philippinarum (Adams and Reeve) on fished and unfished intertidal mudflats. J Exp Mar Biol Ecol 457: 128-134.
- Sousa Da Silva L, Tagliaro CH, Beasley CR (2014) How precise are estimates of intertidal macroinfaunal density and spatial dispersion when converted to larger areas? Pan-Amer J Aquat Sci 9: 112-125.
- Dérian F, Garnier P (2014) Protocol for participatory monitoring of the clam resource harvested by recreational fishing - version 02.1 5. National Federation of French Recreational and Sports Fishermen, France.
- Bertignac M, Auby I, Foucard J, Martin S, De Montaudouin X, et al. (2001) Assessment of the clam stock in the Arcachon basin - 2001 campaign. Ifremer internal report, DRV / RH / RST, France.
- Wentworth C K (1922) A Scale of Grade and Class Terms for Clastic Sediments. J Geol 30: 377-392.
- Folk RL (1954) The distinction between grain size and mineral composition in sedimentary rock nomenclature. J Geol 62: 344-359.
- de Montaudouin X, Lucia M, Binias C, Lassudrie M, et al. (2016) Why is Asari (= Manila) clam Ruditapes philippinarum fitness poor in Arcachon Bay: A meta-analysis to answer? Estuar Coast Shelf Sci 179: 226-235.
- de Montaudouin X, Arzul I, Caill-Milly N, Khayati A, Labrousse JM, et al. (2016) Asari clam (Ruditapes philippinarum) in France: history of an exotic species 1972-2015. Bull Fish Res Agen Japan 2: 35-42.
- Bocher P, Piersma T, Dekinga A, Kraan C, Yates MG et al. (2007) Site- and species distribution patterns of molluscs at five intertidal soft-bottom areas in northwest Europe during a single winter. Mar Biol 151: 577-594.
- Dang C, De Montaudouin X, Gam M, Paroissin C, Bru N, et al. (2010) The Manila clam population in Arcachon Bay (SW France): Can it be kept sustainable? J Sea Res 63: 108-118.
- Caill-Milly N (2012) Relationship between the state of a resource and its exploitation through the understanding and formalization of socio-ecosystem interactions. Application to the Japanese clam (Venerupis philippinarum) of the Arcachon basin. PhD Thesis University of Pau and Pays de l'Adour, Pau, France.
- D’Hardivillé C, Péronnet I, Bouché L (2008) Campagne d’évaluation du stock de palourdes dans le Golfe du Morbihan. Ifremer report, Plouzané, France.
- Ferraro SP, Cole FA (2004) Optimal benthic macrofauna sampling protocol for detecting diffrences among four habitats in Willapa Bay, Washington, USA. Estuaries 27: 1014-1025.
- Latrouite A (2011) Report of the direct assessment of the clam and hull stock of the Pont l'Abbé River deposit. Ifremer STH / LBH internal report, Plouzané, France.
- Mosbahi N, Pezy JP, Dauvin JC, Neifar L (2016) Immediate effect of clam harvesting on intertidal benthic communities in the mudflat zones of Kneiss Islands (Central Mediterranean Sea). J Aquac Res Develop 7: 1000454.
- Schoeman DS, Nel R, Soares AG (2008) Measuring species richness on sandy beach transects: extrapolative estimators and their implications for sampling effort. Mar Ecol 29: 134-149.
- Bidegain G, Juanes JA (2013) Does expansion of the introduced Manila clam Ruditapes philippinarum cause competitive displacement of the European native clam Ruditapes decussatus? J Exp Mar Biol Ecol 445: 44-52.
 Spanish
  Chinese
  Russian
  German
  French
  Japanese
  Portuguese
  Hindi
Hindi 