Spanish
  Chinese
  Russian
  German
  French
  Japanese
  Portuguese
  Hindi
Hindi Research Article, Res J Econ Vol: 2 Issue: 3
Foreign Direct Investment And Import-Export: The Case Of Pakistan
Yasir Khan1, Mingyi Wang2* and Taimoor Hassan3
1School of Economics and Management, Southeast University, China
2School of International Economics and Trade, Shandong University, China
3School of Economics & Management, Nanjing University Science & Technology, China
*Corresponding Author : Mingyi Wang
Professor, School of International Economics and Trade, Shandong University of Finance & Economics
E-mail: wangmingyi2005@sina.com
Received: May 29, 2018 Accepted: June 12, 2018 Published: June 19, 2018
Citation: Khan Y, Wang M, , Hassan T (2018) Foreign Direct Investment and Import-Export: The case of Pakistan. Res J Econ 2:3.
Abstract
The aim of this study to determine the relationship of foreign direct investment (FDI) with import and export in Pakistan with the help of annual time series data for the period of 1978-2016. Foreign direct investment is considered an important component and received significant attention not only developed but also developing countries during the last couple of decades. To understand the objectives of this study, first of all, we conduct statistical analysis to find out the relationship between foreign direct investment (FDI) and its impact on selected macroeconomic factors such as export and import. For data analysis, we use Vector Auto Regression Model (VAR) and (ARDL) for the short-run and long-run relationship. The results show that there is a long-term relationship between FDI and Export while short-term relationship indicated between FDI and import. To support the outcomes of VAR mode we did a few other post diagnostic tests where we concluded that the regressions have a normal distribution and show a strong correlation between the three variables.
Keywords: Foreign direct investment (FDI); Pakistan; Exports; Imports; Economic development; ARDL model
Introduction
The impact of foreign direct investment on export and import is a highly debated subject in academia. Flows of foreign direct investment (FDI) into developing countries have become increasingly concentrated, while FDI outflows from developing countries have increased dramatically. The role of foreign direct investment (FDI) in a host country’s export capability is significantly important, although exports have been viewed for a long time as an engine of economic growth. Many researches argued that the FDI promotes exports of host countries by the helping transfer of technology, facilitating access to new and large foreign markets, accumulating domestic capital for exports, providing training for the local work force and upgrading management and technical skills. On the other hand, sometimes it is suggested that FDI may transfer technology that is incorporate or low level for the host country’s factor proportions, decrease or replace domestic investment and savings, target the host country’s domestic market and result not increase exports and the expansion of indigenous firms that might become exporters. Foreign direct investment is a largest and stable component of capital flows.
Foreign direct investment in the case of Pakistan is significantly important for the survival of the country economy. Prolong unstable economic growth; political conflicts and the country war on terrorism significantly damage the economy. In 2015, The China- Pakistan economic cooperation which is $46 billion USD in different various projects including Infrastructure, Power generation, and to develop the Gwadar seaport to connect China with South-Central Asia and the Gulf states during the state visit of President Xi Jinping to Pakistan. The aim of China-Pakistan economic co-operation for Pakistan is to bring foreign capital and export commodities to the world’s second-largest economy. Foreign direct investment provides significant momentum to the Pakistan economy. Foreign Direct Investment (FDI) creates employment opportunities, enhancing knowledge and skills of labor through transferring of technology and managerial know-how. Additionally, it helps to integrate the domestic economy with the global economy and affects the Balance of Payment (BOP) of a country. The inflow of FDI into Pakistan is anticipated to increase productivity which will consequently have an impact on the increase in national income in the form of Gross Domestic Product (GDP). In Simple words-in order to improve international trade in Pakistan. Investment is significantly important. Moreover, it is also important to improve infrastructure construction and build industrial development to consolidate the competitiveness of national production (Figure 1).

Figure 1: Legend
The imbalance between export and import of Pakistan created a deficit trade balance. The reason for decreasing the export performance is followed by an increase in the number of import, specifically raw materials and capital goods. It has also an impact on the trade balance deficit. Foreign direct investment is more essential for developing countries to develop the internal structure of the economy [1]. The internal structure comprises with many important factors agriculture, industry, energy and many other sectors, which are the engine of any economy. Pakistan spends 18% on the trade, transportation, and communication sectors are 11%, 20% on services sectors, manufacturing is 20%, mining, electricity, construction, and gas are 7%. All these sectors comprise with education, defense, health, public administration etc. Transportation sector include communication storage and so on. Banking activity and finance activity contribute 6% of the overall economy (Table 1) [2]
| Product Export in 2016 | US $ | Total Percentage |
|---|---|---|
| Miscellaneous textiles, worn clothing | 3.8 Billion | 20.1 |
| Clothing, accessories (not knit or crochet) | 3 Billion | 16.1 |
| Knit or crochet clothing, accessories | 2.6 Billion | 13.8 |
| Cotton | 13.2 Billion | 13.2 |
| Cereals | 916.6 Million | 4.9 |
| Leather/animal gut articles | 700.6 Million | 3.7 |
| Mineral fuels including oil | 415.9 Million | 2.2 |
| Fruits, nuts | 388.2 Million | 2.1 |
| Manmade staple fibers | 367.3 Million | 2 |
| Optical, technical, medical apparatus | 334.6 Million | 1.8 |
Table 1: Pakistan exporting commodities for the year 2016.
Literature Review
Foreign direct investment of Pakistan is developing a strong relationship in a majority of the countries of all around the world. There are increasing numbers of different goods and services exported to the world and on the other hand increase numbers of goods and services are imported every year to fulfill the consumers’ requirement from all around the world. The recent position of Pakistan in terms of exporting goods such as industrial raw materials, agriculture goods, and machinery parts are not in stable position. This indicating us that the Pakistan rating the industry working underdeveloped in the year 2010 to 2013, their shares of imports are 75% [3]. The trade policies of Pakistan are to develop and promoting the trade direction all around the world. However, the Pakistan economic policy is to focus more on countries like Middle East, USA, West Europe and many other nations [4]. The main objective of this study is to focus on foreign direct investment plays a significant role in the development and increasing progress of the Pakistan economy. Helpman found that there is a significant impact of foreign direct investment on the export of host countries [5].
In the first aspect, FDI increases or decreases the export from the host county when it has vertical investment, that means the foreign firms invest abroad to produce intermediate input that will be used in final production in their home country [5]. Guisinger and Khilji suggest that positive trade shows the strong economy that is the flow of inward foreign direct investment [6]. Dunning and Safitriani stated that the relationship between FDI through international trade is complementary to each other [7,8]. Kojima [9] analyzed that FDI has two aspects of impact on the export of a host country. This view also supported by other researchers such as Pain and Wakelin [10].
Hejazi and Safarian found that Foreign Direct Investment (FDI) and trade both can improve and develop productivity of firms in host countries [11]. Their empirical analysis suggests that FDI’s contribution to production is comparatively stronger. Blomstr [12] analyzed that spillovers from FDI are the most important channel for the diffusion of modern and new technology. Liu suggests that while in some cases, transferring technology from one place to another place will be expensive and overall there could be a negative impact on the host country [13]. Meyer and Sinani have determined that the relationship between FDI and the level of economic development is not clear [14]. Lipsey revealed that the relationship between export and FDI is negative in some industries suggesting that export and FDI were substitutes [15].
Belderbos and Sleuwaegen concluded that similar outcomes [16]. Lipsey and Weiss, Rugman, Brainard, Pfaffermayr, Clausing found that FDI and exports to be complementary using firm level-data [17- 21]. De Mello Jr and Fukasaku revealed in their study the impact of FDI on trade in Southeast Asia and Latin America have a positive impact of FDI on trade is stronger in trade-oriented economies [22]. Moreover, FDI inflows are more sensitive to changes in exports in Southeast Asian countries comparatively their Latin American counterparts. Swenson found the interaction between trade and FDI and pointed out that a larger inflow of FDI leads of a higher volume of trade as well as other benefits such as the increase in the rate of total factor productivity growth [23]. Driffield and Love have concluded that FDI has contributed to productivity which can increase exports [24]. By using aggregated data of 44 host nations over the periods (1983-2003)
Xuan and Xing determined that relationship between FDI export growths in Vietnam [25]. The researcher found that a 1 percent increase in FDI can be expected to give rise to 0.13 percent increase in exports. Aizenman and Noy revealed a strong two-way linkage between FDI and manufacturing trade [26]. By using firmlevel data in the UK Ramirez, Griffiths and Sapsford revealed the rapid growth of both FDI and trade, the effects of FDI on exports and imports have not been extensively explored [27,28]. Chaisrisawatsuk and Chaisrisawatsuk found the relationship of trade and FDI of 6 Asian and 29 OECD nations during 1980-2004 [29]. The result indicates that FDI increases the export from the host country to other countries.
Majeed and Ahmad found that FDI increases the export of 49 developing countries during 1970-2004 [30]. Pupphavesa and Pussarungsri study the relationship between export and FDI in Thailand [31]. They applied Granger causality test and the result indicated that there is a positive relationship between FDI and export which means FDI enhances the export of Thailand. Tambunlertchai found the positive impact of FDI on export performance in Thailand [32]. She used the firm-level data to analyze factors determining the export decision of three industries, textiles and clothes, foods, and electronics and electrical appliances. One significant factor for a firm’s decision is FDI. The result indicates that foreign firms tend to export more and have better export performance than domestic firms. Mishal and Abulaila analyzed that there is bidirectional relationship exists between FDI and imports [33]. Chani et al. [34] the study indicated that there is a favor of bidirectional causality between imports and FDI in the case of Pakistan (Figure 2).

Figure 2: All variables are stationary at first difference.
Testing hypothesis
H1: There is a positive and significant relationship between the foreign direct investment and Export.
H2: There is a positive and significant relationship between the foreign direct investment imports.
H3: There is a positive and significant relationship between the exports of goods and services and Import.
Empirical analysis
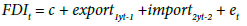
In this study, we use the Granger causality methodology to test for the relationship between FDI inflows and exports, and FDI inflows and imports. In a bivariate framework, the variable x is said to cause the variable y in the Granger sense if the forecast for y improves when lagged variables for x are taken into account in the equation, ceteris paribus. In other words, the standard Granger causality procedure is based on past changes in one variable explaining actual change in another variable.
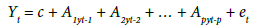 (1)
(1)
 (2)
(2)
Where yt represents, considering the ARDL model developed by Pesaran and Shin, an error-correction model for each of the four equations is derived:
 (3)
(3)
In equation 3, yt represent the predictable variable, εt denoted general originalities, coefficient of liner tendency. Lags length for yt and lags for k independent variables. xit for i=0 for …S respectively depicted. Additionally, optimal lag length selected on the basis of Akaike Information Criteria (AIC), Hannan-Quinn information criterion (HQ), Schwarz Information Criterion (SIC) the sequentially modified likelihood ratio test (LR) and the Final Prediction Error criteria (FPE) which is 2 for all variables.
The tests are carried out on annual data from 1978 to 2016. The data source is the World Development Indicators 2016. All variables are in real terms and are expressed in US dollars. In the first step, we analyzed statistical summary and pair-wise correlation for all the three variables. The statistical summary indicated that Jarque-Bera probability for foreign direct investment, export, and import are greater than 0.1 which suggest that data are normally distributed. Skewness test shows that probability for FDI, export, and import are near to zero, while Kurtosis should be close to 3. Moreover, the upper sated case is significantly perfect. Further discussion of the mean is the average of the given data set, which is defined as the sum of all observations divided by the number of given data set. Median is defined as the central value of series data. While maximum is the highest value in a given set of data. Minimum is the smallest or lowest value of data. Finally, the standard deviation is the dispersion of data around the mean and is denoted by sigma (Table 2).
| FDI | Export | Import | |
|---|---|---|---|
| Mean | 9.89E+08 | 1.26E+10 | 1.74E+10 |
| Median | 4.21E+08 | 9.16E+09 | 1.09E+10 |
| Maximum | 5.59E+09 | 3.14E+10 | 4.64E+10 |
| Minimum | 8220530 | 1.44E+09 | 2.58E+09 |
| Std. Dev. | 1.37E+09 | 9.83E+09 | 1.44 E+10 |
| Skewness | 2.148361 | 0.734193 | 1.042446 |
| Kurtosis | 7.131502 | 2.127023 | 2.510582 |
| Jarque-Bera | 61.40908 | 4.985339 | 7.834942 |
| Probability | 0.000000 | 0.082689 | 0.019891 |
Table 2: Statistical summary.
Unit root test
In time series data, first of all, it is important to determine whether variables are stationary or not. We use Augmented Dicky Fuller (ADF) test to examine the nature. For this hypothesis test, the null hypothesis is that series does not have unit root issue. On the other hand, we supposed that alternative hypothesis is that series do have a unit root problem. In our study, at the start all the variables having an issue of a unit root at a level, but we examined at first difference, all variables convert into stationary hence null hypothesis is accepted as series does not have a unit root problem (Table 3).
| At Level | At First Difference | ||||
|---|---|---|---|---|---|
| Variables | T-Test | Prob. | T-test | Prob. | |
| FDI | -1.65 | 0.09 | FDI | -4.15 | 0.001 |
| Export | 1.91 | 0.98 | Export | -4.99 | 0.000 |
| Import | 2.10 | 0.99 | Import | -5.28 | 0.000 |
Table 3: Augmented Dicky Fuller Test.
Augmented Dicky Fuller test was first introduced by Rajaguru argue that ADF test corrects for higher order serial correlations by adding differenced terms of the lagged variable on the right side. On the other hand, the PP test takes into account the serial correlations by making corrections to the t-statistics of the coefficient of the lagged variables from AR (1) regression. Moreover, Newey- West heteroskedasticity autocorrelation consistent estimates have been used for this purpose. They further state that the asymptotic distribution of the PP t-statistics is the same as the ADF t-statistic. McKinnon’s critical values have been used to test for the significance of the coefficients of the lagged variables.
ARDL model
In this study, we use autoregressive distributed lag (ARDL), model. First, we analyzed our variables such as foreign direct investment (FDI), export and import deeming lag 2 in the model. Pesaran designed ARDL bound test technique for scrutiny the robustness of outcomes for long- run and short-run. The use of ARDL model is very common and significantly important to investigate the time series data. The ARDL suggests us that there is a long-term relationship between foreign direct investment and export while short-term relationship found between foreign direct investment and import.
All diagnostics test will be practiced to authenticate the model for future prediction and results stability. Test for serial correlation, LM test, Correlogram-Q test, Ramsey reset test, Jarque-Bera test for normality, heteroscedasticity test and in the end CUSUM test for coefficients stability.
Result and Discussion
The result and discussion section, we concluded first Augmented Dicky Fuller Unit Root Test (ADF) to make our data stationary. Additionally, the Phillip Pasaran (PP) unit root test also indicated to ensure the stationarity of the data. The ARDL model analyzed that there is positive and statistically significant relationship existed between FDI, Export, and Import where the FDI and export shown the long-run relationship and short-run relationship. Various diagnostic tests outcomes illustrated that ARDL model for longrun as well short-run results for Pakistan foreign direct investment with export. Serial correlation under correlogram with insignificant value squared correlogram is of negligible value. Under the Jarque- Bera test, all the variables conventionally distributed the reason is the Jarque-Bera test is equally distributed, thus the rejection of nullhypothesis is not possible (Tables 4 and 5).
| Variable | Coefficient | Std. Error | t-Statistic | Prob.* |
|---|---|---|---|---|
| FDI (-1) | 0.454753 | 0.217213 | 2.093579 | 0.0475 |
| FDI (-2) | -0.271980 | 0.267309 | -1.017473 | 0.3195 |
| FDI (-3) | 0.633877 | 0.311773 | 2.033137 | 0.0537 |
| FDI (-4) | -0.677059 | 0.195752 | -3.458754 | 0.0021 |
| Import | 0.188501 | 0.040037 | 4.708200 | 0.0001 |
| Import (-1) | 0.071593 | 0.054860 | 1.305009 | 0.2048 |
| Import (-2) | -0.132217 | 0.068420 | -1.932440 | 0.0657 |
| Import (-3) | -0.171948 | 0.075097 | -2.289680 | 0.0315 |
| Export | 0.183038 | 0.078643 | 2.327446 | 0.0291 |
| Export (-1) | -0.372512 | 0.123224 | -3.023046 | 0.0061 |
| Export (-2) | -0.002762 | 0.138922 | -0.019883 | 0.9843 |
| Export (-3) | 0.054228 | 0.096671 | 0.560959 | 0.5802 |
| Export (-4) | 0.264156 | 0.093521 | 2.824554 | 0.0096 |
| C | -1.53E+08 | 1.29E+08 | -1.182549 | 0.2491 |
| R-squared | 0.967406 | Mean dependent var | 1.09E+09 | |
| Adjusted R2 | 0.948984 | S.D. dependent var | 1.40E+09 | |
| S.E. of regression | 3.16E+08 | Akaike info criterion | 42.26384 | |
| Sum squared resid | 2.30E+18 | Schwarz criterion | 42.87338 | |
| Log likelihood | -767.8810 | Hannan-Quinn criter. | 42.47873 | |
| F-statistic | 52.51216 | Durbin-Watson stat | 2.218018 | |
| Prob (F-statistic) | 0.000000 | |||
Table 4: ARDL Model Estimations.
| Variable | Coefficient | Std. Error | t-Statistic | Prob. |
|---|---|---|---|---|
| C | -1.53E+08 | 1.29E+08 | 0.000000 | 0.0000 |
| FDI (-1)* | -0.860409 | 0.152358 | -5.647304 | 0.0000 |
| EXPORT (-1) | 0.126148 | 0.045572 | 2.768086 | 0.0109 |
| IMPORT (-1) | -0.044070 | 0.034002 | -1.296094 | 0.2078 |
| D (FDI (-1)) | 0.315162 | 0.156129 | 2.018599 | 0.0553 |
| D (FDI (-2)) | 0.043182 | 0.190198 | 0.227038 | 0.8224 |
| D (FDI (-3)) | 0.677059 | 0.195752 | 3.458754 | 0.0021 |
| D (EXPORT) | 0.183038 | 0.078643 | 2.327446 | 0.0291 |
| D (EXPORT (-1)) | -0.315623 | 0.093776 | -3.365695 | 0.0027 |
| D (EXPORT (-2)) | -0.318385 | 0.122750 | -2.593760 | 0.0162 |
| D (EXPORT (-3)) | -0.264156 | 0.093521 | -2.824554 | 0.0096 |
| D (IMPORT) | 0.188501 | 0.040037 | 4.708200 | 0.0001 |
| D (IMPORT (-1)) | 0.304164 | 0.064970 | 4.681601 | 0.0001 |
| D (IMPORT (-2)) | 0.171948 | 0.075097 | 2.289680 | 0.0315 |
Table 5: Conditional Error Correction Regression for Long-Run.
The conditional error correction regression for long-term indicates that all variables are statistically significant with foreign direct investment (FDI), export and import respectively. Our study suggests that there is long-run relationship existed between foreign direct investment and export. When the inflow of (FDI) increase the export will be increase vice versa in the case of Pakistan (Table 6 and Figure 3).
| Variable | Coefficient | Std. Error | t-Statistic | Prob. |
|---|---|---|---|---|
| D (FDI (-1)) | 0.315162 | 0.130686 | 2.411597 | 0.0243 |
| D (FDI (-2)) | 0.043182 | 0.161085 | 0.268071 | 0.7910 |
| D (FDI (-3)) | 0.677059 | 0.180024 | 3.760949 | 0.0010 |
| D (EXPORT) | 0.183038 | 0.061207 | 2.990465 | 0.0065 |
| D (EXPORT (-1)) | -0.315623 | 0.068886 | -4.581796 | 0.0001 |
| D (EXPORT (-2)) | -0.318385 | 0.104337 | -3.051514 | 0.0057 |
| D (EXPORT (-3)) | -0.264156 | 0.085145 | -3.102441 | 0.0050 |
| D (IMPORT) | 0.188501 | 0.035461 | 5.315664 | 0.0000 |
| D (IMPORT (-1)) | 0.304164 | 0.057064 | 5.330216 | 0.0000 |
| D (IMPORT (-2)) | 0.171948 | 0.065131 | 2.640016 | 0.0146 |
| CointEq (-1)* | -0.860409 | 0.124536 | -6.908893 | 0.0000 |
Table 6: ECM Regression for Short-Time.

Figure 3: Stability Coefficients CUSUM test.
CUSUM graph shows the results of mean and variance of coefficient stability. In the study, we examined that variance of the coefficient is stable as the mean is within the straight bound lines. Therefore, all our models are perfect and reliable. Our final model is vector error correction model. The reason to choose vector error correction model that because we did not find co-integration in our data. In this study, the value of R2 indicates that 77% of our explanatory variables justified our response variable FDI. The adjusted R2 value is 75% while the value of F-statistic is 40.83 a strong correlation has existed between FDI and export (Table 7).
| FDI | Export | Import | |
|---|---|---|---|
| FDI (-1) | 0.819826 (0.10627) [7.71455] |
0.301344 (0.21877) [1.37745] |
0.356270 (0.35217) [1.01165] |
| Export (-1) | 0.089796 (0.05078) [1.76833] |
1.307623 (0.10454) [12.5087] |
0.774583 (0.16828) [4.60291] |
| Import (-1) | -0.054639 (0.03526) [-1.54963] |
-0.240643 (0.07259) [-3.31531] |
0.467938 (0.11685) [ 4.00473] |
| C | 41156188 (1.8E+08) [0.23260] |
5.90E+08 (3.6E+08) [1.61905] |
92990597 (5.9E+08) [0.15859] |
| R-squared | 0.772879 | 0.981024 | 0.977355 |
| Adj. R-squared | 0.753952 | 0.979442 | 0.975468 |
| Sum sq. resids | 1.67E+19 | 7.10E+19 | 1.84E+20 |
| S.E. equation | 6.82E+08 | 1.40E+09 | 2.26E+09 |
| F-statistic | 40.83521 | 620.3670 | 517.9222 |
| Log likelihood | -868.2709 | -897.1521 | -916.1960 |
| Akaike AIC | 43.61355 | 45.05760 | 46.00980 |
| Schwarz SC | 43.78244 | 45.22649 | 46.17869 |
| Mean dependent | 1.01E+09 | 1.29E+10 | 1.77E+10 |
| S.D. dependent | 1.37E+09 | 9.79E+09 | 1.44E+10 |
Table 7: Vector Auto regression Estimates.
Conclusion
In this study, we investigated the relationship between Foreign Direct Investment (FDI), export and import for Pakistan. The country has long been the facing industrial shortage, energy crises, and lack of foreign direct investment, advanced technology, and skillful labor. We found that there is a positive and long-run relationship between FDI and export. When FDI inflow increases the export is increase and visa versa. On the other hand, we found that there is a positive relationship as well between FDI inflow and import but in the short-run. the ARDL model showed that the coefficient of FDI, export, and import have significant at 5% significance level concerning FDI indicating a strong and positive relationship between these variables.
Additionally, the government could do more to develop these sectors and create a friendly and secure environment so the private sectors including domestic and overseas can then come forward. Another important aspect of development plan is to maintain an economic and political stability. Previous studies have shown that the country internal security, improvement of infrastructure and establishment of an investment-friendly environment play an insignificant role in attracting foreign capital and investment. Further research on Pakistan’s foreign direct investment inflow and export and economic stability, we leave this gap for the future researchers to study this critical and important relationship.
References
- Asiedu E (2002) On the determinants of foreign direct investment to developing countries: is Africa different? World Dev 30: 107-119.
- Hanson GH (2009) Should Countries Promote Foreign Direct Investment? USA.
- Alfaro L, Chanda A, Kalemli-Ozcan S, Sayek S (2004) FDI and economic growth: the role of local financial markets. J Int Econ 64: 89-112.
- Yang Y (2006) China's Integration into the World Economy: implications for developing countries. Asian Pac Econ Lit 20: 40-56.
- Helpman E (1984) A simple theory of international trade with multinational corporations. J Pol Econ 92: 451-471.
- Guisinger S, Khilji NM (1997) The Effects of the Foreign Direct Investment Liberalisation on Pakistan [with Comments]. Pakistan Dev Rev 36: 403-418.
- Dunning JH (1997) The European internal market programme and inbound foreign direct investment. JCMS 35: 189-223.
- Safitriani S (2014) Perdagangan internasional dan foreign direct investment di Indonesia. B Ilmiah Litbang Perdagangan 8: 93-116.
- Kojima K (1973) A macroeconomic approach to foreign direct investment. Hitotsub J Econ 14: 1-21.
- Pain N, Wakelin K (1998) Export performance and the role of foreign direct investment. The Manch Sch 66: 62-88.
- Hejazi W, Safarian AE (1999) Trade, foreign direct investment, and R&D spillovers. J Int Bus Stud 30: 491-511.
- Blomström M (1986) Foreign investment and productive efficiency: the case of Mexico. J Ind Econ 1: 97-110.
- Liu Z (2008) Foreign direct investment and technology spillovers: Theory and evidence. J Dev Econ 85: 176-193.
- Meyer KE, Sinani E (2009) When and where does foreign direct investment generate positive spillovers? A meta-analysis. J Int Bus Stud 40: 1075-1094.
- Lipsey RE (1991) Foreign direct investment in the United States and US trade. Ann Am Acad Polit Ss 516: 76-90.
- Belderbos R, Sleuwaegen L (1998) Tariff jumping DFI and export substitution: Japanese electronics firms in Europe. Int J Ind Org 16: 601-638.
- Lipsey RE, Weiss MY (1984) Foreign production and exports of individual firms. Rev Econ Stat 1: 304-308.
- Rugman AM (1990) Multinationals and Canada-United States Free Trade. University of South Carolina, USA.
- Brainard SL (1993) An empirical assessment of the factor proportions explanation of multi-national sales. Nat Bureau Econ Res.
- Pfaffermayr M (1996) Foreign outward direct investment and exports in Austrian manufacturing: substitutes or complements?. Weltwirtschaftliches Archiv 132: 501-522.
- Clausing KA (2000) Does multinational activity displace trade?. Economic Inquiry 38: 190-205.
- De Mello Jr LR, Fukasaku K (2000) Trade and foreign direct investment in Latin America and Southeast Asia: temporal causality analysis. J Int Dev 12: 903.
- Swenson DL (2004) Foreign investment and the mediation of trade flows. Rev Int Econ 12: 609-629.
- Driffield N, Love JH (2007) Linking FDI motivation and host economy productivity effects: conceptual and empirical analysis. J Int Bus Stud 38: 460-473.
- Xuan NT, Xing Y (2008) Foreign direct investment and exports The experiences of Vietnam. Econ Trans 16: 183-197.
- Aizenman J, Noy I (2006) FDI and trade—Two-way linkages?. Quart Rev Econ Fin 46: 317-337.
- Ramirez M (2000) Foreign direct investment in Mexico: a cointegration analysis. J Dev Stud 37: 138-162.
- Griffiths D, Sapsford D (2004) Foreign Direct Investment in Mexico. New Horiz Int Bus 4: 103-127.
- Chaisrisawatsuk S, Chaisrisawatsuk W (2007) Imports, exports and foreign direct investment interactions and their effects. Asia-Pacific Research and Training Network on Trade Working Paper Series.
- Majeed MT, Ahmad E (2007). Exports and FDI in developing countries: Subtitutes or compliments. International Conference of The Impact of FDI on Growth and Employment in the New EU Member States.
- Pupphavesa W, Pussarungsri B (1994) FDI in Thailand, Thailand Development Research Institute Foundation, Thailand.
- Tambunlertchai S (2009) Foreign direct investment and export performance in Thailand. Thailand.
- Mishal Z, Abulaila Z (2007) The impact of foreign direct investment and imports on economic growth: The case of Jordan. J Econ Admin Sci 23: 1-31.
- Chani MI, Azam M, Younas A (2014) The Causal Relationship between Foreign Direct Investment, Imports and Exports in Pakistan. B Bus Econ 3: 142-149.