 Spanish
  Chinese
  Russian
  German
  French
  Japanese
  Portuguese
  Hindi
Hindi Research Article, Vegetos Vol: 31 Issue: 1
Genetic Analysis of the Transpiration Control in Sunflower (Helianthus Annuus L) Subjected to Drought
Afifuddin Latif Adiredjo1*, Pierre Casadebaig2, Nicolas Langlade3,4, Thierry Lamaze5 and Philippe Grieu6
1Brawijaya University, Faculty of Agriculture, Department of Agronomy, Plant Breeding Laboratory, Malang, Indonesia
2UMR1248 AGIR (INPT-INRA), Castanet-Tolosan, France
3INRA, Laboratoire des Interactions Plantes-Microorganismes (LIPM), UMR441, Castanet-Tolosan, France
4CNRS, Laboratoire des Interactions Plantes-Microorganismes (LIPM), UMR2594, Castanet-Tolosan, France
5Université de Toulouse, UPS-Toulouse III, UMR5126 CESBIO, Toulouse Cedex 9, France
6AGIR, Université de Toulouse, INRA, Castanet-Tolosan, France
*Corresponding Author : Afifuddin Latif Adiredjo
Faculty of Agriculture, Brawijaya University, Indonesia
Tel: +62(00)341551611, +62 81213423516
E-mail: al.adiredjo@ub.ac.id
Received: December 04, 2017 Accepted: December 14, 2017 Published: January 02, 2018
Citation: Adiredjo AL, Casadebaig P, Langlade N, Lamaze T, Grieu P (2018) Genetic Analysis of the Transpiration Control in Sunflower (Helianthus Annuus L) Subjected to Drought. Vegetos 31:1. doi:10.4172/2229-4473.1000368
Abstract
Stomatal control of transpiration was implied as the major strategies by which plants cope with water stress. Here we did investigate the genetic control of this process using the following trait: Fraction of Transpirable Soil Water threshold (FTSWt) representing the threshold of soil water content at which the stomatal control of transpiration started. We conducted a progressive water deficit experiment using recombinant inbred lines (RILs) of sunflower and we analyzed the variation of FTSWt. Quantitative trait loci (QTL) mapping was then performed to determine the loci involved and to identify the genetic control. This work has shown, for the first time, QTL mapping for FTSWt in crops. In this work QTL mapping was made in sunflower.
Keywords: Sunflower, drought, transpiration control, QTL
Introduction
Soil water availability is the major factor limiting plant productivity [1]. The expansion of cropping into water limited environments gives more urgency to developing crop genotypes that use water more efficiently [2]. The water status of a plant is directly related to the difference between the flow of water through the roots and leaves in the same time [3]. Drought experienced by the plant is defined, at every moment, by water conditions at the terminals of the plant, soil and air [4]. Different plants subjected to the same water stress do not respond to this stress in the same way. A wide range of mechanisms has been summarized by Tardieu and Tuberosa [5]. In addition, a significant genotypic variability of these mechanisms has been studied in many crops [6,7].
The plant can reduce transpiration by closing its stomata that reduces stomatal conductance (gs) that determines gas exchange (CO2 and H2O). Ritchie [8] proposed that there might be a response function that is common to most soils. He found that plants initiate a linear decline in transpiration rate once the fraction of transpirable soil water (FTSW) has decreased to about one-third of the total transpirable soil water. After reaching that threshold (FTSWt), transpiration rate decreased linearly with further soil drying [9]. Afterwards, variability of FTSWt have been reported in a wide range of crop species and environmental conditions [10-17].
In this study, we used sunflower recombinant inbred lines (RILs) as a crop model for quantitative trait loci (QTL) mapping. This crop is often reported as a drought-tolerant crop [18-20]. Nevertheless, sunflower genotypes are not homogeneously fitted in the use of water availability. That is why, in this paper, we study the plant-water relation trait, i.e. transpiration control (FTSWt), of sunflower under drought by analyzing its variability and mapping the genomic regions that are responsible for this trait through QTL analysis. QTL analysis provides the opportunity to compare whether different traits have a common genetic basis [21]. Besides, an understanding of the sources of genetic variation and physiological mechanisms involving facilitates the development of an appropriate strategy to breed drought-tolerant cultivars [2].
The genetic control of FTSWt remains poorly understood. To our knowledge, to date, there have been no reports of determination of genetic regions responsible for FTSWt. Marguerit et al. [22] reported the results QTL analysis for acclimation of transpiration rate to water deficit in grapevines for different range of FTSW 60%, 40% and 20%. Therefore, the objective of this paper was to investigate the patterns of genetic variation of control of transpiration (FTSWt), as well as their genetic control.
Materials and Methods
Plant sources
One hundred and forty eight F8 recombinant inbred lines (RILs) and their parents, XRQ and PSC8, were used in the experiment. XRQ and PSC8 are parental lines of the “INEDI” RIL population developed by INRA [23] and both XRQ and PSC8 behaved differently in response to water deprivation [24].
Experimental setup and progressive drought stress treatment
A randomized complete block design with three replicates was used for the progressive drought stress treatment (three replicates X 150 genotypes = 450 plants; called ws). There was another replicate (150 plants) that was considered as a well-watered treatment, called ww. In total, there were 600 plants. The plants were sown in two-liter pots that contained a mixture of 50% soil (collected from the field), 30% organic matter and 20% sand. The research was conducted in a greenhouse at the INRA Auzeville station, Toulouse, France (43°31’46,94” N; 1°29’59,71” E), in spring 2011.
Greenhouse air temperature was set at 25/18 + 2°C (day/night) and relative humidity was 55-75%. The pots were arranged on 100 scales [25] with six pots per balance. Each pot was covered with a 3 mm layer of polystyrene sheet to prevent the evaporation of water from the soil surface.
Seventeen days after sowing, when the plants reached the stage of 2 leaves fully developed (L2FD), all 600 pots were watered to field capacity, by fully irrigating each pot and then allowing the water to drain for 24 h. At field capacity, the mean soil water content (SWC)fc in the pots was 39.5%. The 600 pots were then kept without irrigation for 17 days. Starting at 17 L2FD, we maintained the ww treatment (150 plants) at 30% of SWC (well-watered conditions but not saturation) by daily irrigation. The SWC was determined by the gravimetric method described by Lambe and Whitman [26]. The ws treatment (450 plants) was kept without irrigation until harvest, when the permanent wilting point was reached and the SWC was measured (SWCwp). The permanent wilting point was reached on the same date for all genotypes (at 32 L2FD + 1 day).
Trait measurement
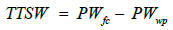
Threshold of fraction of transpirable soil water (FTSWt): Throughout the experiments, the amounts of water in the pots were determined by weighing the pots every day. This weighing recorded the amount of daily water loss, corresponding to the daily transpiration of the plants. For each pot, at the end of the experiment, total transpirable soil water (TTSW) was calculated as follows.
 (1)
(1)
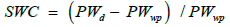
where PWfc was the initial pot weight at field capacity and PWwp was the final pot weight at wilting point. From these data, the soil water status in the pots for each plant can be determined each day using the weight of the pot on a given day (PWd), by calculating the soil water content (SWC) as follows.
 (2)
(2)
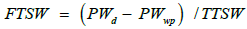
In this study, we normalized SWC by using fraction of transpirable soil water (FTSW), as proposed by Sinclair and Ludlow [10]. The daily value of FTSW was calculated as the ratio of the amount of transpirable soil water remaining in the pot to TTSW:
 (3)
(3)
Transpiration of ws and ww plants was used to determine normalized transpiration ratio (NTR). Firstly, transpiration rate was calculated per unit leaf area by dividing the daily transpiration rate by the leaf area (LA). Secondly, the transpiration rate was normalized by dividing each transpiration rate of a ws plant (for each replicate) by the transpiration rate of a ww plant. This second normalization gave NTR, which accounted for plant-to-plant variation in transpiration within each genotype. Due to the large number of plants in the experiment, we estimated LA of the plants by using a computer image analysis system, winFOLIA (Regent Instruments, Quebec, Canada). The leaf images were obtained with a digital camera (Canon EOS400d), pictures were taken from above by using a camera tripod.
The measurement of plant response to water deficit (traits related to the control of transpiration) used as a regression approach to model individual plant response. The parameters from these models were used as quantitative traits in the association analysis. Two traits were estimated by using break-linear models: (i) FTSWt, the threshold of transpirable soil water (FTSW) at which the plant transpiration rate (NTR) began to decline, Equation 4, and (ii) SWCt, the value of soil water content (SWC) when the plant transpiration rate (NTR) started to decline, Equation 5 and 6.
(i)
If x<a, 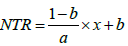
else, NTR = 1 (4)
where x was FTSW, and a was FTSWt.
(ii)
If x<a, 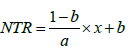
else, NTR =1 (5)
where x is SWC, a is SWCt,
and the x-intercept was computed as:
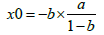 (6)
(6)
Genetic map construction: The genetic map consisted of 2610 markers located on the 17 LG for a total genetic distance of 1863.1 cM and grouped on 999 different loci [27]. The gDNA from the INEDI RILs population obtained from the cross between XRQ and PSC8 lines (210 samples) were genotyped with the Infinium array. All genotyping experiments were performed by Integragen (IntegraGen SA, Genopole Campus 1 - Genavenir 8, 5 rue Henri Desbruères, 91000 Evry, France.) and the genotypic data were obtained with the Genome Studio software (Illumina) with automatic and manual calling. A set of 9832 SNPs were used to produce an Infinium HD iSelect BeadChip (Infinium). These SNPs were selected from either genomic re-sequencing or transcriptomic experiments. From the 9832 SNPs, 2576 were polymorphic between XRQ and PSC8. We used CarthaGène v1.3 [28] to build the genetic maps. We added the genotypic data of markers from a consensus map [29] to assign the Infinium SNPs to the appropriate LG.
Statistical Analysis and QTL Mapping
The software of statistical package PASW statistics 18 (IBM, New York, USA) was used to analyze genotype and replicate effects by analysis of variance (ANOVA) and to estimate phenotypic correlation by Pearson’s correlation. Means of the traits were compared using a Student-Newman-Keuls (SNK) test (P<0.05). For the FTSW and SWC threshold (FTSWt and SWCt) analysis, R software (R Development Core Team, 2012) was used. Each NTR value was plotted against corresponding FTSW and SWC values. FTSWt and SWCt where NTR initiated its decline were determined using a plateau regression.
QTL mapping was carried out using MCQTL, software for QTL analysis (http://carlit.toulouse.inra.fr/MCQTL/). The MCQTL package is comprised of three software applications. The first component, TranslateData reads data from MAPMAKER - like files. The second component, ProbaPop computes QTL genotype probabilities given marker information at each chromosome location for each family and stores them in XML formatted files. The last component, Multipop builds the pooled model using the genotype probabilities, computes Fisher tests and estimates the model parameters [30]. Significant thresholds (P<0.05) for QTL detection were calculated for each dataset using 1000 permutations [31] and a genome-wide error rate of 0.01 (Type I error). The corresponding type I error rate at the whole-genome level was calculated as a function of the overall number of markers in the map and the number of markers in each linkage group.
Results
Phenotypic analysis for FTSWt-related traits
We examined the response of NTR to soil drying decreasing FTSW. The overall response for all genotypes in transpiration rate to soil drying fitted the general pattern represented by two linear slopes (Figure 1). In 2 cases, for the RILs 64 and 107, normalized transpiration ratio (NTR) response to fraction of transpirable soil water (FTSW) were not determined using the model : these two data were not taken into account. NTR at high FTSW was defined by a plateau, and at FTSW below a threshold (FTSWt), NTR decreased linearly with further decreases in FTSW. The pearson correlation between relationship between NTR vs. FTSW and SWC for XRQ and PSC8 (Figure 2) shows that there was variability in the threshold for the decline in NTR between genotypes. These two genotypes represent two contrasting examples in the FTSWt and SWCt values between 0.35 and 0.44, and between 0.22 and 0.25 for FTSWt and SWCt, respectively (Figure 1). Statistics explaining phenotypic variability of all traits and the mean square of genotype from the analysis of variance (ANOVA) test are given in Table 1. Results of the ANOVA test showed the large effects of genotypes (P<0.001) for FTSWt. We provide distributions of RILs means for FTSWt and SWCt that are following a normal law (Fig. 2). RILs extremes for the traits were commonly exceeded by either parent, indicating transgressive segregation for FTSWt. Therefore, in terms of phenotypic variability control of the transpiration trait, FTSWt varied more than SWCt.

Figure 1: NTR response to the FTSW (a,b) and SWC (c,d) of parental genotypes (PSC8 and XRQ). Dot symbols are mean of measured data and curves represent the results of linear regression. FTSWt and SWCt at which NTR began to decrease are shown.

Figure 2: Genotype distribution for FTSWt (a), SWCt (b) of 150 genotypes (148 RILs and two parental lines). Parental means are indicated in each genotype distribution of the trait.
| Traits | Minimum | Maximum | Mean | Std.deviation | MSg |
|---|---|---|---|---|---|
| FTSWt | 0.15 | 0.47 | 0.31 | 0.05 | 0.009*** |
| SWCt | 0.16 | 0.34 | 0.21 | 0.02 | 0.003*** |
Table 1: Phenotypic variability of FTSWt and SWCt. Significant at P < 0.001. FTSWt, threshold of the fraction of transpirable soil water; SWCt, threshold of the soil water content;. MSg, mean square of genotypes that calculated by analysis of variance, anova.
Quantitative trait loci (QTL) identification
One QTL was identified for FTSWt in the present study (Table 2). The phenotypic variance explained by the QTL (R2) reached 6%. The position of the QTL and the likelihood odds ratio (LOD) profiles generated using MCQTL are given in Figure 3. No QTL were detected for SWCt.

Figure 3: Locations of QTL for FTSWt (A) and Likelihood odds ratio (LOD) positions (B) on the genetic map of linkage groups (LG)14. On the LG14 indicate the marker position (distance in centimorgan, cM) at the top, before-middle, middle, after-middle, and bottom of LG (from lower position at the top LG and upper position at the bottom LG). QTL for biomass is also indicated [27].
| Traitx | Chromosome | QTL name | QTL position (cM) | Nearest marker | R2a (%) | Additive effectb |
|---|---|---|---|---|---|---|
| FTSWt | LG14 | ftswt | 27.9 (0-107.7) | ORS1079 | 6 | +0.006 |
Table 2: Significant quantitative trait loci (QTL) detected for FTSWt. xThe abbreviations of the traits can be seen in Table 1; aPhenotypic variance explained by QTL effect; bAdditive effect estimated as one-half the difference in homozygotes carrying either allele of parents (XRQ or PSC8), positive values indicate that XRQ allele increases the trait value, while negative values indicate that PSC8 allele increases the trait value.
Discussion
FTSWt-related traits and phenotypic variability
Genotypic behavior of sunflower subjected to water deficit is particularly variable. It results from a combination of several forms of physiological behavior, such as the sensitivity of stomatal closure to SWC, the capability to extract water from the soil and the tolerance of the plant to dehydration. To our knowledge, using a large number of genotypes to explore genotypic behavior of sunflower under drought has not been reported in literature.
In our experiment, two-segment plateau regression was used to determine a breakpoint, the FTSW threshold (FTSWt), where NTR began to decline (Figure 2). FTSWt reflects the point at which stomata begin to close and then photosynthesis begins to decline [32]. FTSWt has been reported for crop plants [33], and specifically for sunflower [11,15] in a small number of genotypes. From our results, two main and extreme forms of genotypic behavior are highlighted: (i) a “conservative” strategy, where the plants react to drought stress by closing their stomata when FTSW is still relatively high, and (ii) a “productive” strategy, whereby the crop keeps transpiring despite increasing drought [34]. Between these two extreme forms, genotypes had a wide range of thresholds (from 0.15 to 0.47). PSC8, with FTSWt of 0.44 was a typical conservative genotype, while XRQ with FTSWt of 0.35 was intermediate between conservative and productive genotypes (Figure 1a,b). The higher FTSWt value for PSC8 rather than XRQ in this study was in agreement with Rengel et al. [24].
The phenotypic variability of transpiration control by sunflower RILs in this study was not in accordance with the anisohydric behavior which is usually attributed to this species [35]. Anisohydric species typically display less sensitivity to stomatal closure in drying soil, which is represented by low FTSWt values, than isohydric ones [1]. Nevertheless, we observed that the maximum FTSWt value in our RILs population was slightly smaller than the maximum FTSWt value of Casadebaig et al. [15] using other sunflower genotypes (including commercial hybrids). They reported that the highest FTSWt value reached was 0.63 for a sunflower commercial hybrid, thus making it closer to isohydric behavior. Our results and those of Casadebaig et al. [15] indicated that the investigated genetic variability in our experiment covers both anisohydric and isohydric behaviors. This was in accordance with an argument of Schultz [36] and Jones [37] that different genotypes within a crop species, and even the same genotypes grown in different environments, can exhibit both the response types.
Genetic control of FTSWt-related traits
In the present study, transgressive segregation was detected in the mapping population. It was mainly observed for FTSWt whose minimum and maximum values were extremely and significantly different from those of the parental lines (Figure 1a). Genetically, transgressive segregation can result from the expression of rare recessive alleles [38] or from complementary gene action [39]. Since we used RILs population in our work, the transgressive segregation had to be due to complementary gene action.
We compared the QTL position identified in the present study with the results obtained by [40,41] for leaf water status-related traits using a different mapping population under well-watered and water-stressed conditions. This suggests that multiple populations are needed for a wide range QTL detections and genotypic distinction among breeding materials [42,43].
Lastly, we also observed a partly common genetic basis for plant responses to soil water deficit, productivity (biomass) and water use efficiency by comparing the QTL mapping results in this paper with our previous study [27]. From our previous study, QTL for biomass was identified on chromosome LG14. In the present study, the QTL for FTSWt was identified on this chromosome. These findings suggest that the genetic control of FTSWt is dependent on biomass. Therefore, detailed characterization of these genomic regions may lead to an improved understanding of drought resistance and might set the stage for the positional cloning of drought resistance genes [41].
Conclusion
This is the first QTL mapping of transpiration control in crop plants since QTL controlling FTSWt has never been reported in the literature. Our results highlight a link between genetic control and genetic variability of FTSWt in sunflower genotypes. This work also suggests new avenues to investigate the genetic controls over FTSWt, thus narrow the range of candidate genes underlying a QTL.
This paper complements the study of casadebaig et al. [15] that analyzed genotypic behavior of sunflower genotypes by using transpiration control trait, as well as the study of Adiredjo et al. [27] that used the INEDI RIL population in exploiting genetic variation of some important physiological traits. The results will enable agronomist and plant breeder to establish strategies for sunflower improvement program subjected to drought stress and open a way in enhancing the productivity of sunflower by considering FTSWt as a valuable trait.
Acknowledgment
We wish to thank the team of Laboratoire des Interactions Plantes- Microorganismes (LIPM), INRA of Toulouse for providing sunflower materials. We gratefully acknowledge Dr. Stephane Muños for providing a genetic map. In addition, the authors sincerely thank Michel Labarrere for his contribution during the experiments.
References
- Jones HG (2014) Plants and microclimate. A Quantitative approach to environmental plant physiology. Igarss.
- Sinclair TR (2011) Challenges in breeding for yield increase for drought. Trends Plant Sci Elsevier Ltd 16: 289-293.
- Comstock JP (2002) Hydraulic and chemical signaling in the control of stomatal conductance and transpiration. J Exp Bot 53: 195-200.
- Blum A (1996) Crop responses to drought and the interpretation of adaptation. Plant Growth Regul 20: 135-148.
- Tardieu F, Tuberosa R (2010) Dissection and modelling of abiotic stress tolerance in plants. Curr Opin Plant Biol 13: 206-212.
- Sinclair TR, Hammond LC, Harrison J (1998) Extractable soil water and transpiration rate of soybean on sandy soils. Agron J 90: 363-368.
- Kiani SP, Grieu P, Maury P, Hewezi T, Gentzbittel L, et al. (2007) Genetic variability for physiological traits under drought conditions and differential expression of water stress-associated genes in sunflower (helianthus annuus L). Theor Appl Genet 114: 193-207.
- Ritchie JT (1981) Soil water availability. Plant Soil 58: 327-338.
- Devi JM, Sinclair TR, Vadez V, Krishnamurthy L (2009) Peanut genotypic variation in transpiration efficiency and decreased transpiration during progressive soil drying. F Crop Res 114: 280-285.
- Sinclair TR, Ludlow MM (1986) Influence of soil water supply on the plant water balance of four tropical grain legumes. Aust J Plant Physiol 13: 329.
- Sadras VO, Milroy SP (1996) Soil-water thresholds for the responses of leaf expansion and gas exchange: A review. F Crop Res 47: 253-266.
- Lacape JM, Wery J, Annerose D (1998) Relationships between plant and soil water status in five field-grown cotton (gossypium hirsutum L) cultivars. F Crop Res 57: 29-43.
- Lebon E, Vincent D, Pieri P, Schultz HR (2003) Modelling the seasonal dynamics of the soil water balance of vineyards. Funct Plant Biol 30: 699.
- Masinde PW, Stetzel H, Agong SG, Fricke A (2006) Plant growth, water relations and transpiration of two species of african nightshade (solanum villosum Mill ssp miniatum (Bernh ex Willd) edmonds and s sarrachoides sendtn) under water-limited conditions. Sci Hortic (Amsterdam) 110: 7-15.
- Casadebaig P, Debaeke P, Lecoeur J (2008) Thresholds for leaf expansion and transpiration response to soil water deficit in a range of sunflower genotypes. Eur J Agron 28: 646-654.
- Kholova J, Hash CT, Kakkera A, Koova M, Vadez V (2010) Constitutive water-conserving mechanisms are correlated with the terminal drought tolerance of pearl millet [pennisetum glaucum (L) R Br]. J Exp Bot 61: 369-377.
- Gholipoor M, Sinclair TR, Raza MAS, Cooper M, Messina CD, et al. (2013) Maize hybrid variability for transpiration decrease with progressive soil drying. J Agron Crop Sci 199: 23-29.
- Merrien A, Blanchet R, Gelfi N (1981) Relationships between water supply leaf area development and survival, and production in sunflower (helianthus annuus L). Agronomie 1: 917-922.
- Connor DJ, Jones TR, Palta JA (1985) Response of sunflower to strategies of irrigation. 1. Growth, yield and the efficiency of water use. F Crop Res 10: 15-36.
- Connor DJ, Hall AJ (1997) Sunflower technology and production [internet]. Sunflower technology and production. american society of agronomy, crop science society of america, soil science society of America.
- Tanksley SD (1993) Mapping polygenes. Annu Rev Genet Annual Reviews 4139 El Camino Way, P.O. Box 10139, Palo Alto, CA 94303-0139, USA, 27: 205-233.
- Marguerit E, Brendel O, Lebon E, Van Leeuwen C, Ollat N (2012) Rootstock control of scion transpiration and its acclimation to water deficit are controlled by different genes. New Phytol 194: 416-429.
- Vincourt P, As-sadi F, Bordat A, Langlade NB, Gouzy J, et al. (2012) Consensus mapping of major resistance genes and independent QTL for quantitative resistance to sunflower downy mildew. Theor Appl Genet. 125: 909-920.
- Rengel D, Arribat S, Maury P, Martin-Magniette ML, Hourlier T, et al. (2012) A Gene-phenotype network based on genetic variability for drought responses reveals key physiological processes in controlled and natural environments. PLoS One 7.
- Adiredjo AL, Navaud O, Lamaze T, Grieu P (2014) Leaf carbon isotope discrimination as an accurate indicator of water-use efficiency in sunflower genotypes subjected to five stable soil water contents. J Agron Crop Sci 200: 416-424.
- Lambe TW, Whitman RV (1969) Soil mechanics [internet].
- Adiredjo AL, Navaud O, Munos S, Langlade NB, Lamaze T, et al. (2014) Genetic control of water use efficiency and leaf carbon isotope discrimination in sunflower (helianthus annuus L) subjected to two drought scenarios. PLoS One 9.
- De Givry S, Bouchez M, Chabrier P, Milan D, Schiex T (2005) Carthagene: Multipopulation integrated genetic and radiation hybrid mapping. Bioinformatics 21: 1703-1704.
- Cadic E, Coque M, Vear F, Grezes-Besset B, Pauquet J, Piquemal J, et al. (2013) Combined linkage and association mapping of flowering time in Sunflower (Helianthus annuus L). Theor Appl Genet 126: 1337-1356.
- Jourjon MF, Jasson S, Marcel J, Ngom B, Mangin B (2005) MCQTL: Multi-allelic QTL mapping in multi-cross design. Bioinformatics 21: 128-130.
- Churchill GA, Doerge RW (1994) Empirical threshold values for quantitative trait mapping. Genetics 138: 963-971.
- Miller GL (2000) Physiological response of bermuda grass grown in soil amendments during drought stress. Hort Science 35: 213-216.
- Sinclair TR, Leilah AA, Schreffler AK (1995) Peanut nitrogen fixation (C 2 H 2 Reduction) response to soil dehydration. Peanut Sci American Peanut Research and Education Society 22: 162-166.
- Sinclair TR, Muchow RC (2001) System analysis of plant traits to increase grain yield on limited water supplies. Agron J American Society of Agronomy 93: 263.
- Tardieu F, Simonneau T (1998) Variability among species of stomatal control under fluctuating soil water status and evaporative demand: modelling isohydric and anisohydric behaviours. J Exp Bot 49: 419-432.
- Schultz HR (2003) Differences in hydraulic architecture account for near-isohydric and anisohydric behaviour of two field-grown vitis vinifera L cultivars during drought. Plant Cell Environ 26: 1393-1405.
- Jones HG (2007) Monitoring plant and soil water status: Established and novel methods revisited and their relevance to studies of drought tolerance. J Exp Bot 58: 119-130.
- Rick CM, Smith PG (2014) The University of Chicago Novel Variation in Tomato Species Hybrids. The American Naturalist. 87: 359-373.
- Vega U, Frey KJ (1980) Transgressive segregation in inter and intraspecific crosses of barley. Euphytica. 29: 585-594.
- Kiani SP, Talia P, Maury P, Grieu P, Heinz R, et al. (2007) Genetic analysis of plant water status and osmotic adjustment in recombinant inbred lines of sunflower under two water treatments. Plant Sci 172: 773-787.
- Kiani SP, Maury P, Nouri L, Ykhlef N, Grieu P, et al. (2009) QTL analysis of yield-related traits in sunflower under different water treatments. Plant Breed 128: 363-373.
- Hao Z, Liu X, Li X, Xie C, Li M, et al. (2009) Identification of quantitative trait loci for drought tolerance at seedling stage by screening a large number of introgression lines in maize. Plant Breed128: 337-341.
- Xing G, Zhou B, Wang Y, Zhao T, Yu D, et al. (2012) Genetic components and major QTL confer resistance to bean pyralid (lamprosema indicata fabricius) under multiple environments in four RIL populations of soybean. Theor Appl Genet 125: 859-875.