Spanish
  Chinese
  Russian
  German
  French
  Japanese
  Portuguese
  Hindi
Hindi Review Article, Res J Econ Vol: 6 Issue: 6
Impact of Marketing Strategy on the Market Performance of Selected Manufacturing Companies in Nigeria
Ibeh JI1*, Nnabuko JO2 and Nwajimeje Joel3
1Department of Production/Entrepreneurship Unit, Ahmadu Bello University, Zaria, Nigeria
2Department of Marketing, University of Nigeria Enugu Campus, Enugu, Nigeia
3Department of Marketing, Delta State Polytechnic, Delta State Polytechnic, Ogwashi Uku, Nigeria
*Corresponding Author: Ibeh JI
Department of Production/Entrepreneurship Unit,
Ahmadu Bello University,
Zaria,
Nigeria,
Tel: +08037514624;
E-mail: jeremiahify4real@gmail.com
Received date: 30 May 2022, Manuscript No. RJE-22-65429; Editor assigned date: 02 June 2022, PreQC No. RJE-22-65429 (PQ); Reviewed date: 16 June 2022, QC No. RJE-22-65429; Revised date: 02 August 2022, Manuscript No. RJE-22-65429 (R); Published date: 19 August 2022, DOI: 10.4172/RJE.1000125
Citation: Ibeh JI, Nnabuko JO, Joel N (2022) Impact of Marketing Strategy on the Market Performance of Selected Manufacturing Companies in Nigeria. Res J Econ 6:6.
Abstract
Evaluate the effect of product branding on market performance improvement. Marketing practitioners have long been concerned about improving market performance owing to the difficulties of adequately measuring the influence of marketing techniques on sales return. The research intended to evaluate the effect of pricing strategy on market performance and the degree of market demand and supply. The research population included 7,870 individuals, from which a sample size of 364 was calculated using Krejcie and Morgan's method at a 5% error tolerance and a 95% level of confidence. The study used a descriptive survey research approach. The primary instruments utilized to gather data were questionnaires and interviews. The Spearman rank correlation coefficient was used to test the hypotheses. The data reveal that pricing strategy has a considerable beneficial effect on market demand and supply levels, hence increasing the rate of sales growth. Product branding had a significant influence on consumer awareness, increasing market presence. According to the report, marketing strategies should include goods and services to address client demands. Additionally, the research recommends that branding help businesses get awareness; if a brand is consistent and straightforward to recognize, it can make individuals feel more secure while buying. Organizations should exercise caution when pricing their products since the amount they charge will influence how customers perceive their product and whether they will buy it.
Keywords: Marketing; Strategies; Implementation; Performance; Sales
Marketing; Strategies; Implementation; Performance; Sales
Introduction
For an organization to be successful in the long term, it must have a marketing strategy that prioritizes the allocation of finite resources for the benefit of customers and other stakeholders. There is a perception in the business world that marketing strategy is equal to, or even superior to, that of other organizations in the market. When it comes to developing a strategic plan, Vencil explains that it is all about connecting consumer requirements (needs, wants, desires and preferences, and buying patterns) to an organization's capabilities (skills and resources), which results in the problem of core competency [1]. In each of the target markets, a company's value proposition is established when products are based on these key capabilities. The company's strategy must be able to provide it an edge over its competitors in the market. Logan states that marketing strategy specifies what, how, and to whom a company should say certain things in an effort to boost sales. "Strategy is concerned with the basic method in which a corporation seeks to optimize its advantage in its marketing environment," Logan said. The existence of a company is a direct result of its pricing and branding efforts.
As a result, it seems that prior studies on many facets of environmental strategy performance have taught us a lot. An integrated framework for predicting performance outcomes based on environmental conditions and optimum strategy alternatives is needed. Which company's management will perform best when they use price and branding marketing strategies?
Organizations have had a difficult time finding a way to get the most out of their efforts. Companies in a number of marketplaces with a wide range of products are using a variety of marketing strategies in an effort to win or gain market share. A well-thought-out strategy is critical to establishing a common goal. Everyone in the company can understand and connect to the marketing factors, which are anticipated to play a critical role in achieving the firm's goals and objectives. To put it another way, strategic managers want to know and understand where to put their money in order to get the greatest possible gain in performance while spending the least amount of money possible.
Competition among manufacturing organizations is becoming more intense as globalization leads to a decrease in customer demand, which necessitates the production of higher quality goods and the availability of these goods in our consumer markets so that consumers can be served effectively at an agreed sum of money. These companies would be able to manufacture more desired items with a better pricing strategy and product branding in order to halt the uncomfortable development of a lack of demand for their products. As mentioned earlier, this study focuses on how price and branding strategy may increase market performance. The study's primary goal is to determine how marketing methods affect a company's ability to compete in the market. Additionally, this study's specific aims include the following:
• To ascertain the influence of pricing strategy and market demand and supply level on improving the market performance.
• To evaluate the impact of product branding on consumers to improve market performance.
Literature Review
Conceptual review
Marketing strategy: The fundamental purpose of a marketing strategy is to effectively allocate and coordinate marketing resources and activities to fulfill the firm's objectives in a certain product market. Market momentum (i.e. extrapolation of previous performance into the future) is determined by marketing objectives, customer and competition views, and product/market momentum (i.e. marketing strategy). Decisions concerning the scope of an advertising plan include the specification of the target market segments and the product line. Competitive advantage and synergy are sought by enterprises, creating a properly integrated marketing mix program.
In the opinion of Joyce, provide a roadmap to the desired future based on the analysis and selection of marketing tactics. Authors Kotler and Armstrong: The choice of target groups, marketing mix and amounts of marketing investment. It is the marketing department's plan to increase sales profitably via the use of the marketing mix. For a firm, marketing strategy is a long-term approach to accomplishing its goals.
A company's profitability and customer happiness may both be enhanced via the use of pricing strategies. It is a topic that's important to both the seller and the buyer since it has the potential to boost sales and profits while also attracting and keeping customers. Consumers should expect prices to stay constant and fair and not be exploited. Due to rising manufacturing and marketing expenses, Nigerian prices tend to fluctuate often, notably due to the steady rise in pump prices of petroleum products. The ability of businesses in developed economies to thrive in the marketplace is attributed in part to a customer focused approach to pricing, as stated by Ruiliang [2]. In a customer oriented pricing model, the fundamental aspect that a consumer pays for a product is the perceived value, at least in the customer's eyes.
The pricing method that marketing scholars and practitioners have developed in consonance with this philosophy is perceived value pricing. The emphasis is not on whether a price is high or low. Instead, it is on whether the price matches the customer's perceived value of the product. A firm's pricing is vital because of the Price to customers in their purchase decisions and the direct impact of prices on profits. According to George and Kostis, price is what the buyer gives up to receive a bundle of utilities in exchange [3]. Kotler posits that price goes by many names; fairs, fees, charges, tuitions, rent, assessments, and plain old price. According to John, Price is defined as the amount of money at which sellers and buyers agree to trade goods or services [4]. Consequently, an equitable transaction is where benefits equal costs. That is, the benefit is greater than the cost. Hence a transaction is acceptable only when this condition is primarily met or improved upon firms use branding as a marketing tactic to set their goods apart from those of their competitors. Small business owners that lack the advertising budgets of their larger counterparts must use it. It is much simpler for customers to locate a product with a distinctive brand, look, and image in a crowded market. Consumers may be influenced by solid brand identity and reinforce their purchasing patterns [5].
Empirical review
Changed air and Tshepiso studied the effect of packaging, price, and brand awareness on brand loyalty in Manila. A quantitative survey was done at a restaurant as part of the study's methodology. For this research, 212 persons who purchased paint from various brands were polled. The impact of packaging and price on consumer loyalty was studied using one-way ANOVA and regression analysis. Brand loyalty was shown to be strongly linked to packaging, price, and brand awareness, indicating that these factors have a considerable predictive influence on brand loyalty. A company's marketing performance is dependent on its ability to constantly create the packaging of its goods with competitive price and techniques to raise awareness of the branding. Management should employ proper packaging, price, and brand recognition to enhance consumer loyalty to the company's products.
Andrew and Sandra conducted an in-depth analysis of the impact of media on brand awareness and consumer behavior in Nigeria (A Case Study of Fast Food Restaurants) [6].
This study examines the importance of the four dimensions of customer built brand equity (awareness of brand, loyalty to brand, image of brand, and consumer behavior). Brand loyalty and consumer based brand image are thought to impact customer perceptions of the brand. Whether there are any discrepancies between fast food restaurants and other kinds of restaurants in consumers' beliefs of brand equity, it will be examined to see if there are differences in brand recognition, image, consumer behavior and brand loyalty. It was decided to segregate brand awareness from other factors due to the variations in size and the medium and kinds of media that affect customer behavior. A well-structured survey was created to meet the study question. One hundred and fifteen questionnaires were sent to the participants in this study, all of which inquired about the many conveniences offered by modern society and technology. Consumer based brand equity was assessed by the researcher in four ways: brand awareness (awareness), brand image (perception), and brand loyalty. Customers tend to place less importance on brand loyalty than on the other two criteria. But this study also provides an answer to brand awareness via media store sellers that may help sellers advertise their wares in light of consumer behavior, despite the fact that the dimension seems to impact customer impressions of the brand. A study by Dudu and Agwu looked at the impact of pricing tactics on purchasing consumer products [7]. This study also investigates the impact of the internet (online presence) on an informed buying choice. Customers' perceptions of organizations' value based pricing concepts and the degree to which online pricing influences their purchasing decisions were examined as part of this study. The researcher used both a descriptive and historical approach to gather information, mainly relying on secondary sources. According to the statistics gathered, people believe that the Price of a company's product reflects its worth. It also demonstrates the impact of rivals' prices on firm product purchases and the influence of internet pricing on purchasing decisions. There are several challenges related to pricing tactics and the purchasing selection process that this research addresses. According to the findings, companies should concentrate on expressing value to consumers via pricing and monitor the prices of their competitors to see how this influences customers' decisions to buy their goods.
Methodology
Only 364 people were selected for the study's population of 7,870. 3.1 The researcher adopted a descriptive research design using survey techniques. The researcher used descriptive statistical tools such as tables, figures, and simple percentages to represent what was derived from the questionnaire issued. The spearman rank correlation coefficient was used to test assumptions about the connection between the variables of interest. This metric captures how observations are correlated based on their respective rankings.
Methods of data presentation and analysis
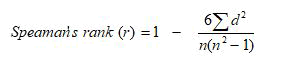
The importance of the analyses was, among other things, to extract, elicit and obtain meanings and findings that helped to solve the research problem that informed the study. In order to describe the results of the survey, the researcher employed descriptive statistical techniques such as tables, figures, and simple percentages. The spearman rank correlation coefficient was used to test assumptions about the connection between the variables of interest. Measures how closely observations' relative ranks are related. Neideen and Brasel state that spearman rank coefficients are used to assess how two variables inside a single data point are statistically related [8]. As a result, it is based on the sum of the values for both variables and must be presented as a ranking. Even when dealing with continuous data, rankings must be generated. Then, the differences between the two observations were ranked. The formula below was used to obtain the correlation coefficient using spearman rank order:
Data presentation and analysis
Benith is concerned with presenting and analyzing data gathered from the field to describe the phenomenon of interest and test the propositions.
Table 1 shows that 364 (91%) of the copies of the questionnaire distributed were returned, while 32 (9%) were not returned and were not used.
| Options | No Distributed | % | No Returned | % | No not Returned | % |
|---|---|---|---|---|---|---|
| Number of firms managers | 364 | 100 | 332 | 91 | 32 | 9 |
Source: Researcher field survey 2020
Table 1: Distribution and return of the questionnaire.
Item 1 of Table 2 indicates that 124 (37.35%) of the respondents said that setting prices below always direct competition. 185 (55.72%) of the respondents said setting price often direct competition, 12 (3.62%) of the respondents said seldom, while 11 (3.31%) of the respondents said setting Price below never a direct competition. Item 2 of Table 2 states that cutting prices increases market share. 140 (42.17%) of the respondents said always, 118 (35.54%) of the respondents said often cutting price increase market share, 58 (17.47%) of the respondents seldom said, while 16 (4.82%) of the respondents never accept that cutting t prices to increase market share [9].
| S/No | Statement | Always % | Often % | Seldom % | Never % | Total |
|---|---|---|---|---|---|---|
| 1 | Set price below the direct competition | 124 (37.35%) | 185 (55.72%) | 12 (3.62%) | 11 (3.31%) | 332 |
| 2 | Cut prices to increase market share | 140 (42.17%) | 118 (35.54%) | 58 (17.47%) | 16 (4.82%) | 332 |
| 3 | Used cost control system to monitor | 257 (77.41%) | 70 (21.08%) | 3 (0.9%) | 2 (0.6%) | 332 |
| 4 | Said no to programs not suitable for product/services | 201 (60.54%) | 107 (32.23%) | 15 (4.52%) | 9 (2.71%) | 332 |
| 5 | Make sure products/services with distinctive competitive advantages receive extra resources | 285 (85.84%) | 38 (11.45%) | 5 (1.51%) | 4 (1.2%) | 332 |
| 6 | Your satisfaction with the pricing strategy | 183 (55.12%) | 116 (34.94%) | 18 (5.42%) | 15 (4.52%) | 332 |
Source: Field Survey (2020)
Table 2: Pricing strategy.
In item 3 of Table 2, 257 (77.41%) of the respondents said they always use the cost control system to monitor their pricing strategy, 70 (21.08%) of the respondents said they often used it, 3 (0.90%) of the respondents seldom said. In comparison, 2 (0.60%) of the respondents said they never used a cost control system to monitor prices strategy.
In item 4 of Table 2, 201 (60.54%) of the respondents said they always said no to programs not suitable for product/services, 107 (32.23%) of the respondents said they do that often, 15 (4.52%) of the respondents seldom said. In comparison, 9 (2.71%) of the respondents said they never Said no to programs not suitable for product/services [10].
In item 5 of Table 2, 285 (85.84%) of the respondents said they always Made sure products/services with distinctive competitive advantages received extra resources, 38 (11.45%) of the respondents said they often do that, 5 (1.51%) of the respondent said seldom. While 4 (1.20%) of the respondent said they never Made sure products/services with distinctive competitive advantages received extra resources. In item 6 of Table 2, 183 (55.12%) of the respondents said they always ensure satisfaction with the pricing strategy, 116 (34.94%) of the respondents often said they do that, 18 (5.42%) of the respondents said seldom about the statement. In comparison, 15 (4.52%) respondents said they never always ensure satisfaction with the pricing strategy [11].
Item 1 of Table 3 Indicates that 179 (53.92%) of the respondents said changes in their market share relative to pricing strategy. 140 (42.17%) of the respondents said it often happens, 7 (2.11%) of the respondents said that it seldom, while 6 (1.80%) of the respondents said changes in your market share never relative to pricing strategy. Item 2 of Table 3 states an Increase in sales growth rate relative to the direct competition. 258 (77.71%) of the respondents said always with the statement, 56 (16.87%) of the respondents said often with the statement, and 5 (1.51%) of the respondents' said seldom. In comparison, 13 (3.92%) of the respondents said never an Increase in sales growth rate relative to the direct competition. In item 3 of the Table 4, 270 (81.33%) of the respondents said they always increase in net profit position relative to direct competition, 56 (16.86%) of the respondents said often with the statement, 5 (1.51%) of the respondents said seldom. In comparison, 10 (3.01%) of the respondents never when there is an increase in net profit position relative to direct competition [12].
| S/No | Statement | Always % | Often % | Seldom % | Never % | Total |
|---|---|---|---|---|---|---|
| 1 | Changes in your market share relative to pricing strategy | 179 (53.92%) | 140 (42.17%) | 7 (2.11%) | 6 (1.8%) | 332 |
| 2 | Increase in sales growth rate relative to the direct competition | 258 (77.71%) | 56 (16.87%) | 5 (1.51%) | 13 (-3.92) | 332 |
| 3 | Increase in net profit position relative to direct competition | 270 (81.33%) | 56 (16.86%) | 5 (1.51%) | 1 (0.3%) | 332 |
| 4 | Allow any form of discount to your customers | 116 (34.94%) | 165 (49.69%) | 41 (12.35%) | 10 (3.01%) | 332 |
Source: Field Survey (2020)
Table 3: Level of market demand and supply in improving market performance.
In item 4 of Table 3, 116 (34.94%) of the respondents said that they always allow any form of discount to their customers, 165 (49.69%) of the respondents often said they allow any form of discount to their customers, 41 (12.35%) of the respondents said seldom. In comparison, 10 (3.01%) of the respondents said they never allow discounts to their customers.
Item 1 of Table 4 indicates that 290 (87.35%) of the respondents said extremely high in their brand communicates what you are and convey the highest value you deliver, 34 (10.24%) of the respondents said high, 6 (1.81%) of the respondents said low. In comparison, 2 (0.60%) of the respondents said extremely low their brand communicates what you are and convey the highest value you deliver. Item 2 of Table 4 states that your brand effectively differentiates you from every other supplier in your marketplace. 198 (59.64%) extremely high with the statement, 130 (39.16%) of the respondents said high, 3 (0.90%) of the respondents said low, while 1 (0.30%) of the respondents said extremely low that your brand effectively differentiates you from every other supplier in your market place.
| S/No | Statement | EH % | H % | L % | El % | Total |
|---|---|---|---|---|---|---|
| 1 | Your brand communicates what you are and convey the highest value you deliver | 290 (87.35%) | 34 (10.24%) | 6 (1.81%) | 2 (0.6%) | 332 |
| 2 | Your brand effectively differentiates you from every other supplier in your marketplace | 198 (59.64%) | 130 (39.16%) | 3 (0.9%) | 1 (0.3%) | 332 |
| 3 | Your brand promise is well understood and consistently executed at all levels of your organization | 204 (61.45%) | 122 (36.75%) | 5 (1.5%) | 1 (0.3%) | 332 |
| 4 | You deliver a high-value product | 190 (57.23%) | 134 (40.36%) | 6 (1.81%) | 2 (0.6%) | 332 |
| 5 | You need new tools to educate prospects about your products | 280 (8.43%) | 45 (13.55%) | 3 (0.9%) | 4 1.2% | 332 |
| 6 | Your sales tools are integrated with your brand and your marketing campaign | 200 (60.24%) | 126 (37.95%) | 4 (1.2%) | 2 (0.6%) | 332 |
Source: Field Survey (2020)
Table 4: Product Branding.
In response to question 3, 4.4,364 (72.5 percent) respondents strongly agreed that they meet with clients to discuss their current intelligence requirements and assist them in defining them; 128 (25.5%) respondents agreed, 5 (1.0%) respondents were unsure, and 1 (0.2%) respondents disagreed. Only four respondents (0.8%) strongly disagreed that I meet with customers to assist them in determining their intelligence requirements and discussing the current condition of their business requirements. In Table 4, item 4, 298 (59.4%), 194 (38.6%), and 6 (1.2 percent) of respondents strongly agreed that our business maintains service reliability and reduces transaction errors, respectively, whereas 2 (0.4 percent) were doubtful. In comparison, just two respondents (or 0.4%) agreed or strongly disagreed that our organization guarantees service reliability and minimizes transaction errors [13].
Respondents to the survey strongly agreed with item 5 in the table, which states that enhancing service quality motivates clients to return. 210 (41.8%) agreed, three were undecided, and one (0.2%) disapproved. In comparison, just four persons (or 0.8%) said that offering better service leads in improved customer loyalty. When asked if our firm delivers an exceptional level of service that results in customer retention, 4.9.300 respondents (or 59.8%) highly agreed; 189 respondents (or 37.6%) agreed; 5.0 percent were unsure; and 1.0 percent disagreed. 3 (0.6%) strongly disagreed with the assertion that our organization delivers superior customer service, resulting in client retention.
Item 1 of Table 5 indicates that 263 (79.2%) of the respondents said that their brand identity is known in all segments to be extremely high. 66 (19.9%) of the respondents said to a great extent it does, 1 (0.3%) of the respondents said low extent, while 2 (0.6%) of the respondents said low extreme their brand identity is known in all segments. Item 2 of the Table 4 152 (45.8%) of the respondents state that actively selling products and services to their current customers are exceptionally high. 177 (53.3%) of the respondents said to a high extent, 2 (0.6%) of the respondents said it is low, while 1 (0.3%) of the respondents said extremely low they actively sell products and services to your current customers [14].
| S/No | Statement | EH % | H % | L % | EL % | Total |
|---|---|---|---|---|---|---|
| 1 | Your brand identity is known in all segments | 263 (79.2%) | 66 (19.9%) | 1 (0.3%) | 2 | 332 (0.6%) |
| 3 | You actively sell products and services to your current customers | 152 (45.8%) | 177 (53.3%) | 2 (0.6%) | 1 (0.3%) | 332 |
| 3 | You understand the factors buyers consider when selecting your product or service | 168 (50.6%) | 153 (46.1%) | 11 (3.3%) | - | 332 |
| 4 | Your customer change the way they find, buy or use your product or service | 148 (44.6%) | 165 (49.7%) | 14 (4.2%) | 5 (1.5%) | 332 |
Source: Field Survey (2020)
Table 5: Customer awareness in improving market performance.
In item 3 of Table 5, 168 (50.6%) of the respondents said that they understand the factors buyers consider when selecting their product or service, 152 (30.2%) of the respondents said to a high extent they do, 11 (3.3%) of the respondents said to the low extent they understand the factors buyers consider when selecting your product or service. In item 4 of the table, 148 (44.6%) of the respondents said that their customers change the way they find, buy or use your product or service, 165 (49.7%) of the respondents said that customers change the way they find, buy or use your product or service, 14 (4.2%) of the respondents said to a low extent, while 5 (1.5%) of the respondents said to low extreme their customer change the way they find, buy or use your product or service.
Test of hypotheses
The work adopts the following statistical tool, Spearman's product moment correlation coefficient, and simple linear regression, aided by a Microsoft computer Special Package for Social Sciences (SPSS) to test the hypotheses listed in chapter one.
Hypothesis one
• Ho: There is no significant positive relationship between pricing strategy and levels of market demand and supply in improving market presence.
• Hi: There is a significant positive relationship between pricing strategy and market demand and supply levels in improving the sales growth rate.
The Pearson correlation coefficient for pricing strategy and levels of market demand and supply is shown in Table 6. The coefficient of association is 0.795. “According to the 0.05 threshold of significance (2-tailed), the association between pricing strategy and the market demand and supply levels (r=.795) is significant. Table value r=0.195 is larger than the estimated correlations coefficient (r=.795) with 332 degrees of freedom at alpha level for two-tailed test (df.=n-2) (r=0.795) at alpha level. However, as the calculated r=.795 is higher than the table value of 0.195, we reject the null hypothesis and conclude there is a substantial positive link between pricing strategy and levels of market demand and supply in enhancing market presence (r=.795, P<.05) (Tables 7-9).
| Pricing strategy | Levels of market demand and supply in improving market presence. | |||
|---|---|---|---|---|
| Spearman's rho | Pricing strategy | Correlation Coefficient | 1 | .795** |
| Sig. (2-tailed) | 0 | |||
| N | 332 | 332 | ||
| Levels of market demand and supply in improving market presence. | Correlation Coefficient | .795** | 1 | |
| Sig. (2-tailed) | 0 | |||
| N | 332 | 332 | ||
**. Correlation is significant at the 0.01 level (2-tailed).
Source: SPSS Version, 20.00
Table 6: Correlations.
| Model | R | R Square | Adjusted R Square | Std. Error of the Estimate | Durbin-Watson |
|---|---|---|---|---|---|
| 1 | .870a | 0.756 | 0.755 | 0.38924 | 0.548 |
Table 7: Model summary.
| S. No | Model | Sum of Squares | df | Mean Square | F | Sig. |
|---|---|---|---|---|---|---|
| 1 | Regression | 154.999 | 1 | 154.999 | 1023.033 | .000b |
| 2 | Residual | 49.998 | 330 | 0.152 | ||
| Total | 204.997 | 331 |
Table 8: ANOVA.
| Model | Unstandardized Coefficients | Standardized Coefficients | t | Sig. | |
|---|---|---|---|---|---|
| B | Std. Error | Beta | |||
| (Constant) | 0.302 | 0.043 | 7.004 | 0 | |
| product branding | 0.769 | 0.024 | 0.87 | 31.985 | 0 |
Table 9: Coefficients.
Hypothesis two
Ho: Product branding does not significantly impact customer awareness in improving market presence.
Hi: Product branding significantly impacts customer awareness in improving market presence.
Interpretation
Models explain more variance in a dependent variable than the residual sum of squares, which is why the regression sum of squares is larger than the residual sum of squares (49.998). A p-value of less than 0.05 indicates that the model's variance is not attributable to random variation. Customers are more likely to be aware of a product's brand if its correlation coefficient is 0.870. In the R square, the model accounts for 75.6% of the variance in customer awareness. The estimated error in the linear regression model is 0.38924. According to Durbin Watson's 0.548 statistics, which do not follow the trend of 2, autocorrelation does not occur [15].
The coefficient of product branding of 0.870 suggests a positive correlation between product branding and consumer awareness, which is statistically significant (t=31.985). As a result, the null hypothesis should be rejected, and the alternative hypothesis should be accepted appropriately. Thus product branding significantly impacts customer awareness in improving market presence.
Discussion
The Spearman correlation coefficient was used to determine the link between pricing strategy and the degree of demand and supply to enhance market presence. The findings indicated a substantial positive link between pricing strategy and market demand and supply levels in terms of enhancing market presence (r=0.795, P=0.05). This finding corroborated Dudu and Agwu's assertion that customers' perceptions of value are reflected in the pricing of enterprises' goods. Additionally, research demonstrates that rivals' prices influence firm product purchases and that internet pricing both informs and influences buying decisions.
The second hypothesis was investigated using basic linear regression to determine the effect of product branding on customer awareness and market presence. The findings indicates that product branding has a substantial effect on increasing consumer awareness and market presence (r=0.870; t=31.985; F=1023.033; p=0.05). This study corroborated Manilall, Chengedzai, and Tshepiso's assertion that packaging, pricing, and brand awareness all had significant positive associations with brand loyalty, implying that they have a predictive effect on brand loyalty. The findings imply that management should develop and execute effective packaging, Price, and brand awareness initiatives to increase customers' brand loyalty to the company's goods.
Summary of findings
The findings at the end of this study include the following
• There is a significant positive relationship between pricing strategy and market demand and supply levels in improving sales growth rate (r=0.795, P<0.05).
• Product branding significantly impact on customer awareness in improving market presence (r=0.870; t=31.985; F=1023.033; p<0.05).
Conclusion
This research shows that marketing strategy provides a framework for a company to allocate its resources and interact with its environment in order to accomplish a corporate goal of generating economic value and keeping the company ahead of its competition. The efficiency and cost structure of a company are directly affected by the marketing methods used. Firms use marketing strategies to respond to market and market factors, as well as external and internal influences that affect their business, so that they may reach their goal market objectives.
References
- Vencil RF (2015) Strategic planning in diversified companies. Harv Bus Rev 53:81-93.
- Ruiliang Y (2009) Pricing Strategies and Firm Performance under Alliance Brand. J Prod Brand Manag 18:226-232.
- Geoege A, Kostis P (2011) New Industrial Service Pricing Strategies and their antecedents. J Bus Ind Mark 26:26-33.
- John W (2010) Service Level, Pricing Strategy and Firm Performance in a duct Manufacturing Organisation. J Prod Brand Manag 18:226-232.
- Shirazi A, Mazidi AK (2013) Investigating the Effects of Brand Identity on Customer Loyalty from Social Identity Perspective. Iran J Manag Stud 6:153-78.
- Andrew J, Sandra F (2014) Marketing performance Maesuresment Ability and firms performance. J Mark 3:72-84.
- Dudu OF, Agwu ME (2014) A Review of The Effect of Pricing Strategies on The Purchase of Consumer Goods. Int J Res Manage Sci Technol 2:15.
- Neideen T, Brasel K (2007) Understanding Statistical Tests. J Surg Educ 64:93-96.
- Adam SM (2014) Evolutionary process in competitive markets: Beyond the product life cycle. Eur J Mark 97:4-20.
- Kelven L (2013) Conceptualizing, Measuring and Managing Customer-Based Brand Equity J Mark 57:1-22.
- Dhurup M, Mafini C, Dumasi T (2014) The impact of packaging, price and brand awareness on brand loyalty: evidence from the paint retailing industry. Acta Commercii 14:1-9.
- Paul T, Van L (2013) Relating Price Strategy and Price-Setting Practice. Eur J Mark 47:27-48.
- Krejcie RV, Morgan BW (1970) Determining Sample Size for Research Activities. J Educ Psychol 30:607-617.
- Roymond RB, Charles PA (2013) Upper Echelons: The Organizations as a Reflection of its Top Manager. Acad Manage Rev 9:3-6.
- Vikas V (2011) Pros and Cons of Penetration Pricing Strategy. J Mark Manag 30:301-314.