Research Article, J Nucl Ene Sci Power Generat Technol Vol: 11 Issue: 4
Over the Bay of Bengal and the Central Equatorial Indian Ocean, There are Relationships between Sea Surface Temperature, Wind Speed, and Chlorophyll-A Concentration
Vivek Kumar Pandey* and Yaduvendra Singh
Department of Environmental Studies, University of Allahabad, Prayagraj, India
*Corresponding Author: Vivek Kumar Pandey, Department of Environmental Studies, University of Allahabad, Prayagraj, India, Tel: 9490303888; E-mail: vivekbhuoa @gmail.com
Received date: 22 December, 2021, Manuscript No. JMBO-22-50463;Editor assigned date: 23 December, 2021, PreQC No. JMBO-22-50463;Reviewed date: 06 January, 2022, QC No. JMBO-22-50463;Revised date: 22 February, 2022, Manuscript No. JMBO-22-50463;Published date: 08 March, 2022, DOI: 10.4172/jmbo.1000235
Citation: Vivek KP, Yaduvendra S(2022) Over the Bay of Bengal and the Central Equatorial Indian Ocean, There are Relationships between Sea Surface Wind Speed, and Chlorophyll-A Concentration. J Nucl Ene Sci Power Generat Technol 11:4.
Abstract
The present study focuses at the interaction between SST, Chlorophyll-a concentration, and wind speed in the Bay of Bengal (BoB) and the Central Equatorial Indian Ocean (CEIO) through 2003 to 2018. MODIS AQUA monthly chlorophyll-a concentration and SST, along with NCEP wind speed, were used. In the Bay of Bengal, the lowest average Chlorophyll-a concentration was detected in June 2010 whereas the highest average Chlorophyll-a concentration was recorded in August 2006. In the CEIO, the lowest average Chlorophyll-a concentration were found in April 2016 whereas the highest average Chlorophyll-a concentration were found in December 2010. In the BOB, the lowest average SST was observed in January 2007 and the highest average SST was reported in May 2016, whereas in the CEIO, the lowest average SST was observed in January 2011 and the highest average SST were recorded in April 2016. The highest average wind speed in the BoB was recorded in September 2009, and the lowest average wind speed was recorded in October 2011. The CEIO records the highest average wind speed in July 2004 and the lowest average wind speed in March 2017. In the BoB and CEIO, we also found a rising trend in SST and a declining trend in Chlorophyll-a concentration. This data implies that Chlorophyll-a concentration and SST have a negative association, but Chlorophyll-a concentration and wind speed have a positive relationship. This work, on the other hand, adds to our understanding of phytoplankton in tropical oceans. The effects of wind speed, SST, and Chlorophyll-a concentration on each other are discussed.
Keywords: Bay of Bengal, Central equatorial Indian ocean, Chlorophyll-a concentration, Sea surface temperature, Wind speed, Correlation, Ocean colour, Phytoplankton
Introduction
The ocean spans 70% of the Earth's surface and comprises over 90% of the planet's habitable space. This area is rich in biodiversity, with the ocean accounting for 90% of the planet's biomass. Climate conditions are heavily influenced by the ocean. The physical, chemical, and biological processes of the ocean are intricately linked. The ocean acts as a heat distribution unit, transporting warm water and air to the poles and cold water and air to the tropics [1]. The Indian Ocean is the world's third-largest body of water, covering 20% of the planet's surface. Australia and the Sunda Islands border the Indian Ocean on the east, Southern Asia on the north, and the Arabian Peninsula and Africa on the west. The Asian monsoon cycle controls the majority of ocean circulation in the Indian Ocean. The Equatorial Indian Ocean, like the surface, is active and enigmatic. In compared to the Equatorial Atlantic and Pacific Oceans, the Equatorial Indian Ocean (EIO) will have distinct features. The semiannual reversal wind pattern across the equatorial Indian Ocean distinguishes it from other equatorial portions of the global oceans. Upwelling is not as common in the EIO as it is in the Equatorial Pacific Ocean and the Atlantic Ocean. As a result, biological productivity is higher in the Pacific and Atlantic Oceans than in the Equatorial Indian Ocean. Seasonal reversing monsoon winds occur in the EIO. Wyrtki jets were used to study the distribution of heat, salt, and other ocean characteristics closer to the equator and in the off-equatorial basin [2-5]. Due to anomalous wind forcing, Wyrtki jets exhibit higher interannual variability near the Equator. The Bay of Bengal is the world's biggest bay, located in the northeastern region of the Indian Ocean. The BoB's maritime habitats and effluents were varied. The Sea of Bengal's productivity was increased by river drainage into the north of the bay, as well as a large number of wetlands, marshes, and mangroves. During the International Indian Ocean Expedition in 1960-65, a research of the BoB was undertaken, and information about the BoB was gathered. Winter monsoon current, summer monsoon current, gyres, fronts, and other elements of the BoB circulation are all affected by low-frequency wave activity [6]. The reversing East India Coastal Current (EICC) and the Southwest/Northeast monsoon current are the key features of circulation in the western BoB, while the eastern side of the BoB is characterized by sluggish circulation. SST is a key geophysical measure in weather forecasting, as well as in the study of marine ecosystems. SST has a substantial influence on climate and monsoon precipitation over landmasses in the BoB [7].
Phytoplankton is crucial for the ocean since it regulates the world's biological processes. The biological process results in a decrease in carbon dioxide and a rise in oxygen in the sea surface, indicating an abundance of fish. The presence of phytoplankton intercepts short-wave radiation absorption, resulting in an increase in SST [8]. Chlorophyll -a concentration and photosynthetic pigments are found in phytoplankton, which absorb more blue and red light than green light, and the spectrum of back scattered sunlight in ocean water turns green hue as phytoplankton grows. The amount of phytoplankton in the ocean is determined by the chlorophyll-a concentration content. Phytoplankton populations are influenced by climatic elements such as sea surface temperatures, salinity, and winds. We attempted to investigate the temporal and space variability of biological parameters like as chlorophyll-a concentration, SST and wind speed in the BoB and CEIO over 2003-2018 in this study.
Data and Methods
Ocean Color data
We used monthly Aqua MODIS composite Level-3 data at 4 km spatial resolution from the National Aeronautics and Space Administration (NASA) Ocean Color data source for the period 2003-2018. The OC2 algorithm is used to calculate Chlorophyll-a values from observed radiance in Aqua MODIS Chlorophyll-a concentrations (Table 1).
| MODIS Data Type | Satellite Platform | Parameter | Spatial Resolution | Time Period | Data format |
|---|---|---|---|---|---|
| Level-3 | Aqua Satellite | Chl-a | 4 km | Monthly | NetCDF |
Table 1: Ocean color data.
Sea surface temperature
We used Aqua MODIS 4 km resolution satellite data from the National Aeronautics and Space Administration (NASA) Ocean Color for the period 2003-2018 (Table 2).
| MODIS Data Type | Satellite Platform | Parameter | Spatial Resolution | Spectra band | Time Period | Day/Night | Data format |
|---|---|---|---|---|---|---|---|
| Level-3 | Aqua Satellite | SST | 4 km | 11 μm | Monthly | Day | NetCDF |
Table 2: Sea surface temperature.
Wind speed data
We used 0.25 resolution wind speed reanalysis data from the National Centers for Environmental Prediction for the period 2003-2018. (NCEP).
Results and Discussions
Bay of Bengal
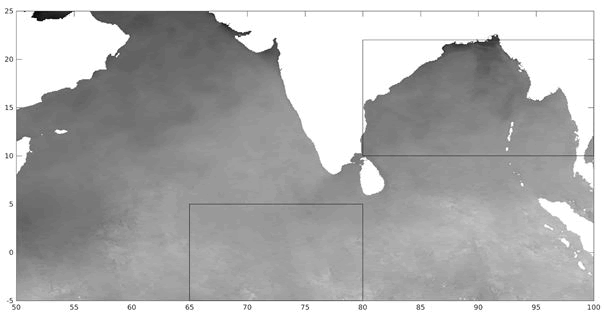
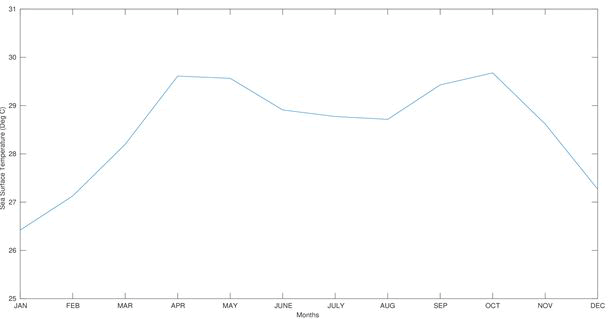
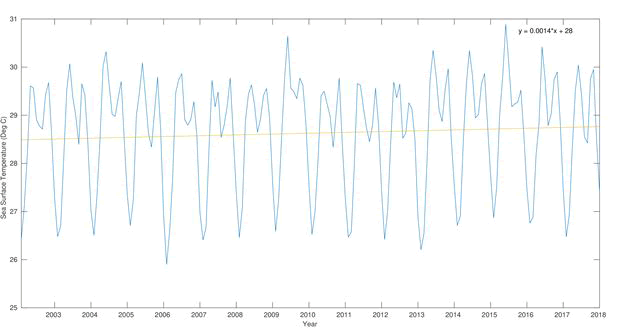
Variability in SST: The presence of three-sided landing on the BoB has a significant impact on SST. According to our research, the water's SST fluctuates from 25.9°C to 30.89°C during the BoB study. The lowest temperature was 25.9°C in January, and the maximum temperature was 30.89°C in April (Figure 1). Despite the fact that the highest temperature was recorded in 2016 and the lowest temperature was recorded in 2007, (Figure 2). During the period 2003-2018, sea surface temperature in the BoB showed a rising tendency. A long-term rising trend in the SST may be seen in Figure 3. The estimator's slope shows a monthly rise of 0.0014°C.
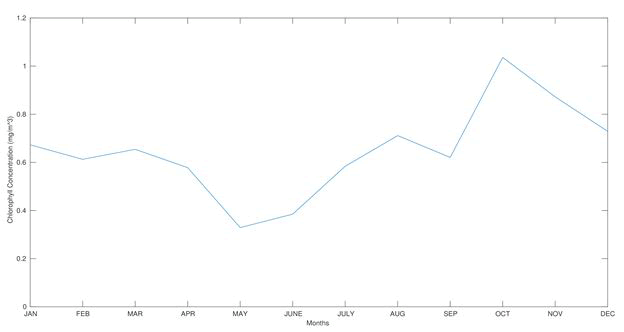
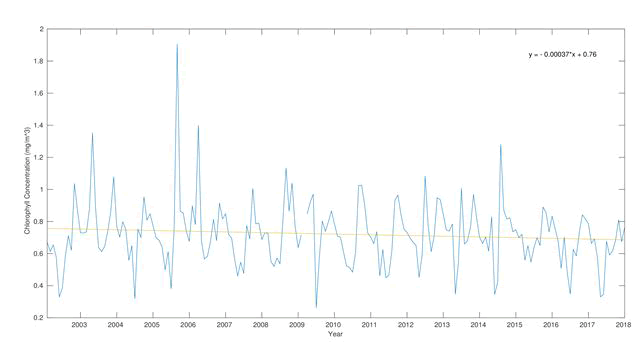
Variability in Chlorophyll –a Concentration: In coastal water, chlorophyll-a concentration is a measure of phytoplankton abundance and biomass. The amount of chlorophyll-a concentration in the environment changes with the seasons. During the month of June, the average Chlorophyll -a concentration in the area is at its lowest. Chlorophyll-a concentration will be in the medium range in January, but will climb in August and fluctuation medium to high from July to October, with Chlorophyll -a concentration dropping in November and Early December before returning to the usual range at the end of the year, as shown in Figure 4. The highest concentration of chlorophyll-a will be in 2006, and the lowest will be in 2010 (Figure 5). The concentration of chlorophyll -a will be dispersed over the northern and eastern regions of the BoB, with a high concentration near the Malacca straits. In the BoB, a huge flow of freshwater from the river causes increased stratification, which prevents upwelling and wind mixing, resulting in nutrient enrichment of the surface water. These nutrients encourage diatom bloom, which boosts chlorophyll-a concentration production and concentration along the shore. Water flow was calculated using the EICC chlorophyll-a concentration. It flows northward during the spring inter-monsoon season and southward during the fall inter-monsoon period. The northward-flowing spring intermonsoon will encourage upwelling and raise chlorophyll-a concentration along the Indian coast [9-10]. Chlorophyll-a concentration data for February 2010 was absent from the linear trend of monthly Chlorophyll-a concentration. The Chlorophyll-a concentration during the research period shows a downward trend with a monthly slope of 0.00037 mg m 3 (Figure 5).
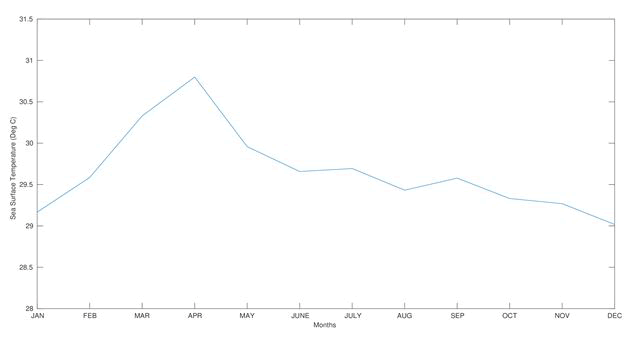
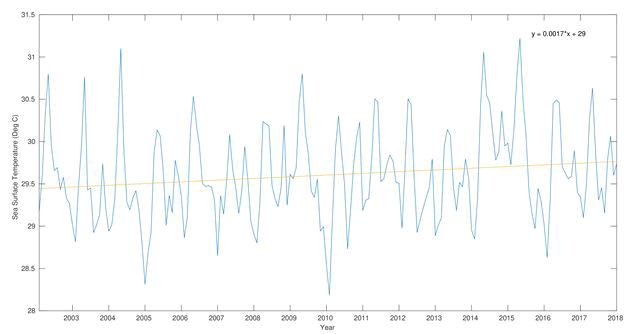
Central Equatorial Indian Ocean Variability in SST: SST in the CEIO reaches a minimum of 28.19°C in January and reaches a maximum of 31.22°C in April. In August, it drops to 29.43°C, and then remains steady in September, October, and November before dropping SST at the end of the year (Figure 6). The highest SST will be recorded in 2016, while the lowest SST will be observed in January (Figure 7). SST is a significant factor in vertical mixing, but it has remained constant for several years, indicating that there is little evidence of upwelling or winter mixing in this area. Because of the mixing of deeper water, the SST drops, supplying nutrients to the top surface and promoting production. When the deeper water combines with the top water, the SST decreases. These nutrients are derived from surface water and help to boost productivity and Chlorophyll-a concentration levels. The SST value in the CEIO is declining, with a monthly slope of 0.0017°C (Figure 7).
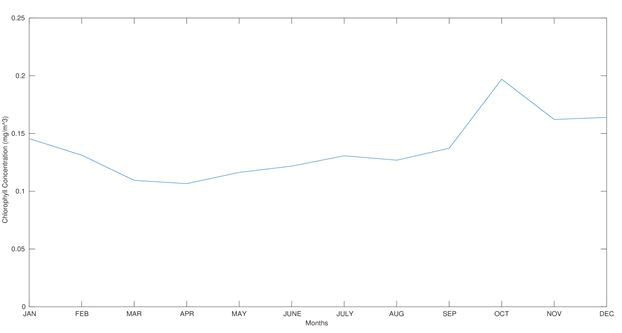
Variability in Chlorophyll-a concentration Concentrations: In the CEIO, the lowest Chlorophyll-a concentration is 0.09086 mg m-3 in April, and the highest Chlorophyll-a concentration is 0.2141 mg m-3 in December. From January to April, the concentration of chlorophyll-a concentration decreases, and from August to October, it rises. High Chlorophyll-a concentrations peaked in October 2003, 0.211 mg m-3 in December 2005, 0.2141 mg m-3 in December 2010, and 0.1956 mg m-3 in January 2017 (Figure 8). Chlorophyll-a concentrations will be at their highest from October through December, as can be observed. Observational data of Chlorophyll-a concentration could not be obtained throughout the JJAS period due to cloud cover, as stated by previous studies. At the Equator, the Wyrtki jet plays a critical role in the zonal redistribution of mass, heat, salt, and other water qualities [11]. Because of the triggering of horizontal advection development near the Maldives Island, which supports biological production across the EIO from the north, chlorophyll-a concentrations in the CEIO are high between October-December. Biological output is boosted by the development of Wyrtki jets in the fall, which extends eastward from the Maldives to 80.5°E from October to December. Wyrtki jets and wind disturb the surface of EIO, bringing a mixed layer of rich nutrients to the surface and fortifying it with chilly thermocline water. The concentration of surface chlorophyll -a concentration rises as a result of this cooling event. During the southwest monsoon season in the Eastward Equatorial Indian Ocean, chlorophyll-a concentrations are low. Permanent upwelling does not occur in the eastern section of the equatorial Indian Ocean due to the lack of consistent equatorial easterlies. Kelvin waves encourage upwelling in the Equatorial Indian Ocean when easterlies blow, according to recent studies. The upwelling in the EIO is also aided by ENSO and IOD. Because to the westerly Equatorial Indian Ocean's blow, which creates a downwelling Kelvin signal due to poor nutrition on the top surface, chlorophyll -a concentration decreases. Chlorophyll-a concentration data for February 2010 were absent from the linear trend of monthly Chlorophyll-a concentration. In the Somali coast, chlorophyll -a concentrations increased from 1998 to 2003 before declining after 2003 [12-15], as shown in Figure 9.
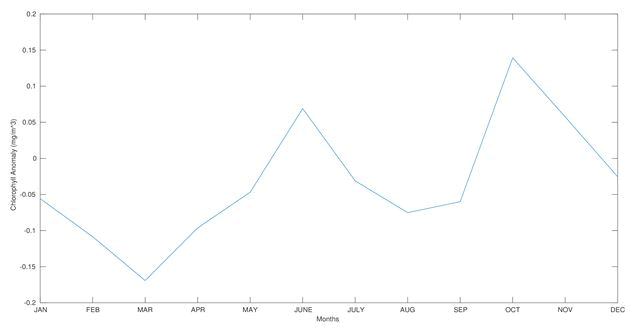
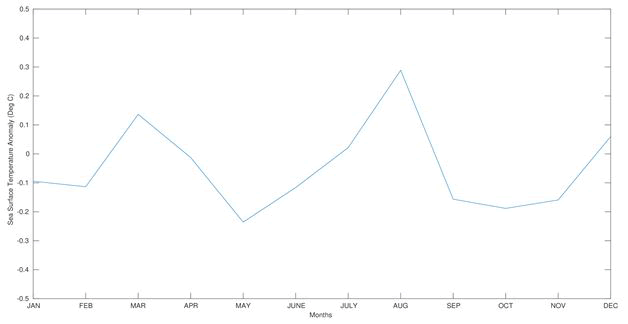
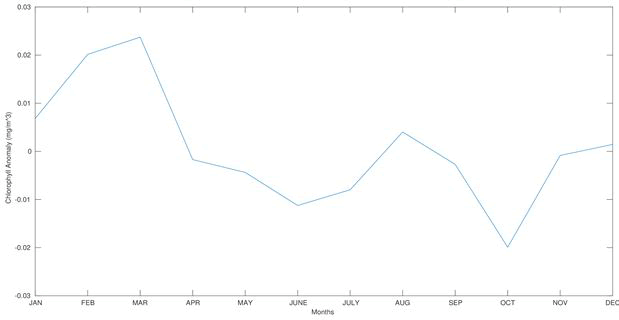
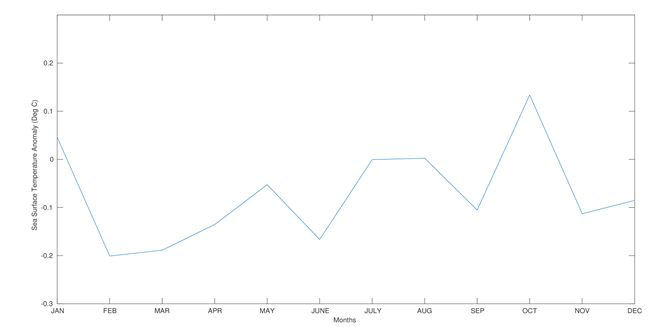
Relationship between SST and Chlorophyll -a concentration: In the ocean, SST is the most important medium for Chlorophyll-a dispersion. In the BoB, we discovered that Chlorophyll-a concentration and SST had a negative association. SST is greater and Chlorophyll-a concentration content is lower in the months of April, May, and June. SST is lower and Chlorophyll-a concentration content is greater in December, January, and February. SST is greater during the post-monsoon season due to the creation of cyclones in the BoB, and cyclones also assist in the production of eddies, which result in a high concentration of chlorophyll-a concentration in the BoB. From March through May, the concentration of chlorophyll-a concentration in the CEIO will decrease, while SST will increase. In comparison to other months, January and February have greater chlorophyll-a concentrations and lower SST. Figures 10-13 depicts the SST and Chlorophyll-a concentration anomaly in the BOB (a). Figure 10 shows a positive anomaly in the BoB Chlorophyll-a concentration in July, October, and November, and a negative anomaly in all other months except July, October, and November. In March, July, August, and December, SST exhibits a positive anomaly, but in January, February, March to June, and September to November, it shows a negative anomaly (Figure 11). This demonstrates that when SST exhibits a positive anomaly, chlorophyll-a concentration reacts in the opposite way. Chlorophyll-a concentrations in CEIO exhibit a positive anomaly in January, February, March, August, and December, but a negative anomaly in April to July, and September to November (Figure 12). In the months of January, August, and October, SST shows a positive anomaly; in all other months, SST shows a negative anomaly (Figure 13).
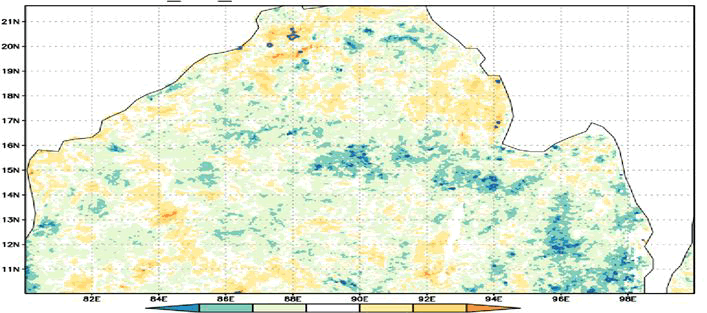
Correlation between SST and Chlorophyll-a concentration in the Bay of Bengal: To get a better understanding of the link between Chlorophyll-a concentration and sea surface temperature. The link between chlorophyll-a concentration and sea surface temperature was investigated. Near the northern coastal region, as well as the western and eastern coastal regions (16°N-19°N, 92°E-94°E), the BoB shows a modest positive association. In the central region of the BoB (88°E-95°E,14°N-16°N) and the eastern portion of the BoB (95°E-98°E,10°N-14°N), there is a moderate negative correlation, as well as a significant negative correlation in patches (Figure 14). The nutrients from river mouths cause a larger level of Chlorophyll -a concentration in coastal locations. Chlorophyll-a concentration is also influenced by the amount of solar radiation available, which is necessary for photosynthesis and phytoplankton development [15-17].
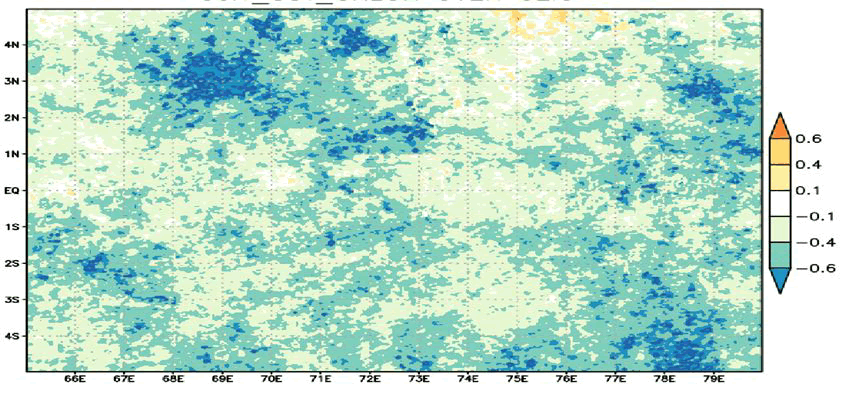
Correlation between SST and Chlorophyll-a concentration in the CEIO: The Northern Central Indian Ocean (2°N-5°N,68°E-70°E) and the South Eastern Indian Ocean (4°S-5°S,78°E-79°E),(2°N-3°N,79°E-80°E) both exhibit a substantial negative association in the CEIO. SST and Chlorophyll-a concentration have a Negative Correlation in CEIO (Figure 15). This shows that raising the SST in our research region causes the Chlorophyll-a concentration to decrease. Wind has a crucial impact in the increase of Chlorophyll-a concentration in the CEIO. They may cause down welling or upwelling signals depending on the wind direction. Because the wind is typically westerly in the CEIO, the concentration of chlorophyll -a concentration is low because the westerly wind causes a down welling Kelvin signal [18].
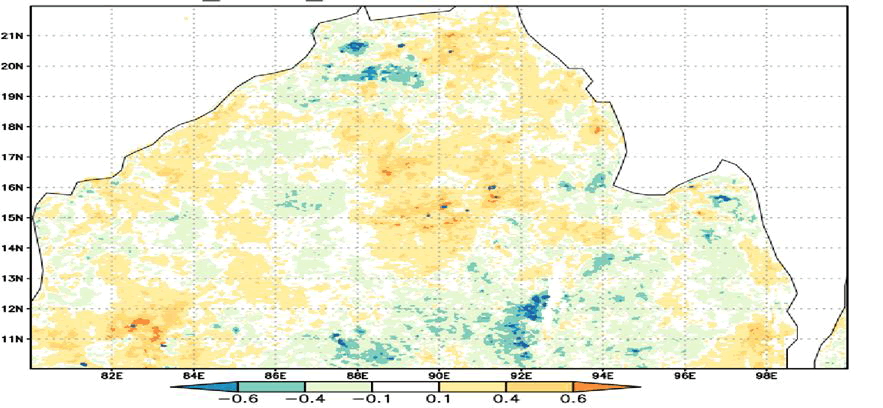
Correlation between wind speed and Chlorophyll-a concentration in the Bay of Bengal: The availability of light and nutrients affects chlorophyll -a concentration content and biological production. Light levels are high on the ocean's surface. Upwelling and vertical migration to the upper ocean are also governed by wind speed. We found a link between Chlorophyll-a concentration content and Wind Speed in the BoB. At the eastern end of the Bay of Bengal (90°E-94°E, 18°N-22°N), there is a positive association (Figure 16). A favorable association was also detected in the middle BoB (88°E-92°E, 13°N-18°N). In western BoB coastline region (82°E-86°E, 15°N-19°N). The negative association was seen at the southern BoB (91°E-93°E, 10°N-13°N). At the northern BoB, there is likewise a negative correlation [19].
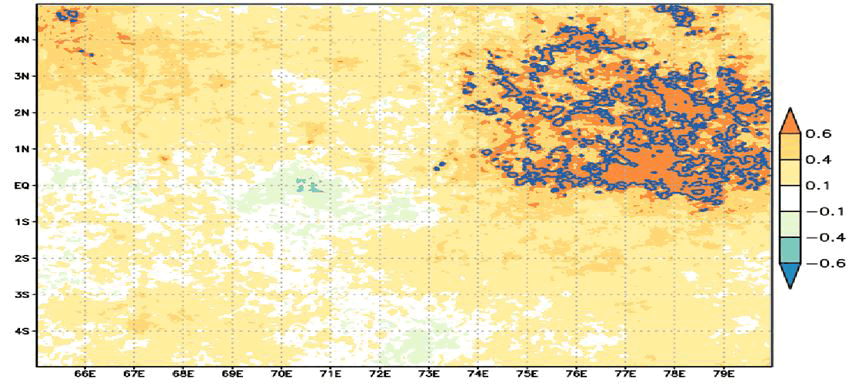
Correlation between Wind Speed and Chlorophyll-a concentration in the Equatorial Indian Ocean: The Eastern Equatorial Indian Ocean (75°E-80°E, 4°N-1°S) has a high positive correlation in the CEIO (Figure 17). A moderate positive association was seen in the northern Equatorial Indian Ocean (74°E-80°E, 5°S-1°S), as well as a moderate positive correlation in the eastern Equatorial Indian Ocean (74°E-80°E, 5°S-1°S). A high positive connection in the Eastern Equatorial Indian Ocean shows that it is due to the influence of wind upwelling and its controlling power on vertical mixing. It's also been discovered that increasing the depth of the mixed layer pushes more nutrients into the ocean surface. The mixed layer is deepened by strong winds, and vice versa [20]. There is a negative correlation in the Indian Ocean's Equatorial area. The westerly wind direction in the equatorial zone supports largely down welling Kelvin signal.
Conclusion
The link between SST, Wind Speed, and Chlorophyll-a concentration has been detected in the BOB and CEIO. The BOB and CEIO indicate an overall declining trend in chlorophyll-a concentration, whereas the BOB and CEIO show a generally increasing trend in SST. The influence of Wyrtki jets and wind stirring causes chlorophyll-a concentrations to rise in the CEIO from October to December. In the Bay of Bengal, the concentration of chlorophyll -a concentration similarly rises from October to November. Chlorophyll-a concentration raises in the winter months as deeper water mixes with surface water, lowering the SST and supplying nutrients to the ocean surface, increasing productivity and hence Chlorophyll-a concentration. We also discovered a positive link between SST and Chlorophyll-a concentration across the BOB's coastline region, as well as a negative correlation in the BOB's middle and eastern regions. However, we discovered a negative association between Chlorophyll -a concentration and SST in the CEIO. Wind speed and Chlorophyll-a concentration were shown to have a positive link in the Eastern Bay of Bengal, Central Bay of Bengal, and coastal region of the Western Bay of Bengal, and a negative correlation in the southern Eastern and northern regions of the Bay of Bengal. We discovered a positive association between wind speed and chlorophyll-a concentration in the CEIO. CEIO discovered a substantial link between Wind Speed and Chlorophyll -a concentration in the Eastern. This implies that increasing wind speed aids in the accumulation of nutrients at the ocean's surface, indicating a positive relationship. We discovered in this study that an increase in the SST might be the primary source of Chlorophyll-a concentration reductions in the CEIO. The increased Chlorophyll-a concentration in the BOB and CEIO may be due to the deepening mixed layer depth and lowering SST. We also discovered that when wind speed increases, the concentration of Chlorophyll-a concentration in the BOB and CEIO increases. We discovered a direct association between wind speed and chlorophyll-a concentration content, as well as an inverse relationship between wind speed and SST.
References
- Reppin J, Schott FA, Fischer J, Quadfasel D (1999) Equatorial currents and transports in the upper central Indian Ocean: Annual cycle and interannual variability. J Geophysic Res Ocean 104:15495-15514
- Sharma GS (1968) Some inferences on the Equatorial Undercurrent in the Indian Ocean based on the physical properties of the waters. J Marin Biolog Associat Ind 10:224-236
- Düing W (2021) The monsoon regime of the currents in the Indian Ocean. University HawaiPress 1:1-67
- Li T, Y Zhang, CP Chang, B Wang (2001) On the relationship between Indian Ocean SST and Asian summer monsoon. Geophys Res Letter 28:2843-2846
- Shenoi SSC, D Shankar, SR Shetye (2002) Differences in heat budgets of the near-surface Arabian Sea and Bay of Bengal: Implications for the summer monsoon. J Geophysic Res 107:3052
- Chelton DB, MG Schlax, RM Samelson, RA de Szoeke (2007) Global observations of westward energy propagation in the ocean: Rossby waves or nonlinear eddies? Geophysic Res Letters 34:L15606
- Wyrtki K (1973) An equatorial jet in the Indian Ocean. Sci J 181:262-264
- Madhupratap M, Gauns M, Ramaiah N, Kumar SP, Muraleedharan PM, et al. (2003) Biogeochemistry of the Bay of Bengal: physical, chemical and primary productivity characteristics of the central and western Bay of Bengal during summer monsoon 2001. Deep Sea Res Topical Stud Oceanograp 50:881-896
- do Rosário Gomes H, Goes JI, Matondkar SP, Buskey EJ, Subhajit B, et al. (2014) Massive outbreaks of Noctiluca scintillans blooms in the Arabian Sea due to spread of hypoxia. Nature Communicat 5:1-8
- Hood RR, Beckley LE, Wiggert JD (2017) Biogeochemical and ecological impacts of boundary currents in the Indian Ocean. Progres Oceanograp 156:290-325
- Yentsch CS (1960) The influence of phytoplankton pigments on the colour of the seawater. Deep-Sea Res 7:1-9
- Sathyendranath S, Gouveia AD, Shetye SR, Ravindranath P, Platt T (1991) Biological control of surface temperature in the Arabian Sea. Nature 349:54-56
- Behrenfeld MJ, Falkowski PG (1997) Photosynthetic rates derived from satellite-based chlorophyll -a concentration concentration. Limnolog Oceanograp 42:1–20
- Sasamal SK (2007) Island wake circulation off Maldives during boreal winter, as visualised with MODIS derived chlorophyll-a data and other satellite measurements. Int J Rem Sens 28:891-903
- Vinayachandran PN, Saji NH (2008) Mechanisms of south Indian Ocean intraseasonal cooling. Geophysic Res Letter 35:L23607
- Prakash P, Prakash S, Rahaman H, Ravichandran M, Nayak S (2012) Is the trend in chlorophyll-a in the Arabian Sea decreasing? Geophysic Res Letter 39:L23605
- Schlüter L, Mohlenberg F, Havskum H, Larsen S (2000) The use of phytoplankton pigments for identifying and quantifying phytoplankton groups in coastal areas: testing the influence of light and nutrients on pigment/chlorophyll a ratios. Marine Ecolog pro ser 192:49-63
- Cullen JJ, Franks PJ, Karl DM, Longhurst A (2002) Physical Influences on Marine Ecosystem Dynamics. The Sea 12:297–336
- d'Ortenzio F, Lavigne H, Besson F, Claustre H, Coppola L, et al. (2014) Observing mixed layer depth, nitrate and chlorophyll concentrations in the northwestern Mediterranean: A combined satellite and NO3 profiling floats experiment. Geophysic Res Letter 41:6443-6451
- Kumar GS, SatyaPrakash M, Ravichandran AC Narayana, 2016. Trends and relationship between chlorophyll -a concentration-a and SST in the CEIO, Remote Sensing Letters 7:1093-1101
 Spanish
  Chinese
  Russian
  German
  French
  Japanese
  Portuguese
  Hindi
Hindi 