Research Article, Res J Econ Vol: 3 Issue: 1
Physical growth trend on the fringe of the dhaka south city: a case study of saddam market area, kadamtali
1Department of Geography and Environment, University of Dhaka, Dhaka, Bangladesh
2Remote Sensing Division, Center for Environmental and Geographic Information Services (CEGIS), Dhaka, Bangladesh
3GIS Division, Center for Environmental and Geographic Information Services (CEGIS), Dhaka, Bangladesh
*Corresponding Author : Rahman M
Department of Geography and Environment, University of Dhaka, Dhaka, Bangladesh
Tel: +8801520102107
E-mail: mahbubmra@gmail.com
Received: September 09, 2019 Accepted: September 24, 2019 Published: October 01, 2019
Citation: Rahman M, Karim KHR (2019) Physical Growth Trend on the Fringe of the Dhaka South City: A Case Study of Saddam Market Area, Kadamtali. Res J Econ 3:1.
Abstract
This paper may be considered as a complete sketch that is
based on remote sensing data and field work carried out in
Saddam market area located in Kadamtali Thana, Dhaka South
City Corporation. Uneven land reform and entangled land-use
regulations are extensively regarded as the key to urban
growth in large cities in Bangladesh. Although the significance
of land issues has been substantially recognized, conflicts
regarding land finance seem to be a generally under-evaluated
factor in explaining the phenomenon of urban growth. This
study conducted an extensive literature research and proposed
a conceptual framework to demonstrate the effects of land use
incentives on urban growth in Bangladesh.
Urban growth in Bangladesh manifests in multiple forms, such
as unplanned building structure, high density residential
communities that are continuous from existing urban centers,
and chaotic peripheral-urban informal development. These
forms of urban growth may be closely associated with failures
in government and market forces under the land financial
incentives. The causes of urban growth were highlighted from
the inherent impulses and conflicts of land finance. In the
recent past this area was rural type but with the progression of
time and the facilities of the transportation systems this area
has become a sprawl of the city.
This report tries to find how the urban growth of the Dhaka city
has been followed by this peripheral city area and how this
impacts on the social, economic political and environmental
sectors. From the summary findings it will assume the
reduction in agricultural and vegetation area and increase in
structural settlements and other structural developments.
Keywords: Remote sensing; Geographic Information Systems(GIS); Land Use and Land Cover (LULC) change; Urban physical growth
Introduction
This area is on the periphery of Dhaka city and stands by Dhaka- Chittagong road highway. In last 10-15 years there have been a lot of changes and developments. Most of the developments are infrastructural. Normally this area is residential but there is a little number of industrial growths also as well. Once vacant areas are now being used as bus garages and construction place. Once arable lands are almost vanished by newly build residential buildings as well as educational institutions. Wetlands are filled up and high raised buildings are built. As the house rent here is comparatively low thus people from different parts of the city choose Saddam Market area to live. The serenity of the green nature exists here. Most of the dwellers here are middle to low income people. Income of the local people has been changed gradually with the urban growth. All these aspects are described by the study with remotely sensed data and with field visit collected data.
Dhaka is fast growing city. In between last ten-twenty years this city has been emerged with constructions and losing its natural elements like agriculture and vegetation. Thus study on this rapid change is very important to identify the growing rate and its impact so the prediction may help in the near future how to plan the city and how to contribute to the development as well as the beautification of the city. Thus this report has been made with a view to reviewing the land cover change though remote sensing process and its impact on the socio-economic, political and environmental sectors through field data collection.
This study will help to identify the land cover change of the Saddam Market Area of Dhaka city and the impact of the land use change on the different sectors of life. It is also very important to do research in micro level. The peripheral areas of the Dhaka city like Saddam market area; Kadamtali is such an area that has full element to work on. So this type of unplanned over populated areas can be considered as model area to detect the problems and find the solution with prediction. This chapter finds the growth trend of the periphery of the Dhaka city. Saddam Market area is on the periphery area which has been monitored by remote sensing and GIS based photography and data. In last decades or so there have been huge changes in the land use of this area. There have been a lot of fluctuations in the land cover area of the Saddam market area, Kadamtali which we took as a model of the peripheral area of the Dhaka city which has been located in the Dhaka South City Corporation. Road networks were very few ten fifteen years back and gradually increased with the progression of time. Also the building structure increased with huge percentage where on the contrary all other land covers like water body, agricultural lands, vacant areas and vegetation coverage have been declining with concerning rate. All these statistical data have been represented graphically and other important data have been shown as table in this chapter.
The area of Dhaka city is almost 306.38 km2. Being the capital, this city is growing enlarge every year on the periphery. Government republic of Bangladesh has divided the city corporation into two parts- Dhaka North City Corporation and Dhaka South City Corporation to make the operational work smoother and has increased the range of the city by including more peripheral areas into the city. With the physical growth and the impacts over the socio-economic, environmental and political sectors of this suggest that this area has changed a lot than the recent past times and growing in to be an urban sprawling catchment of the Dhaka city. This newly grown urban like area is not well planned and not much with the urban facilities. Though the government and the other authorized sectors trying to overcome the entire drawbacks and regroup the facilities that will somehow satisfy the dwellers of this area. Some of the advantages and disadvantages of this physical growth trend of Saddam Market area are briefly pointed out.
Urban growth in Dhaka city is highly concentric and unplanned and very much dependent on the commuting facilities. This unplanned growth is sometimes criticized by different scholars. Various studies show that this growth rate is so fast and its impact on different sectors of lives are not very much convincing. Also the land use has been changed quite drastically. Urban growth describes the expansion of human populations away from central urban areas into low-density, mono-functional and usually car dependent communities, in a process called suburbanization. In addition to describing a particular form of urbanization, the term also relates to the social and environmental consequences associated with this development. In Continental Europe the term "peri-urbanisation" is often used to denote similar dynamics and phenomena. It is highly politicized, and almost always has negative connotations. It is criticized for causing environmental degradation, and intensifying segregation and undermining the vitality of existing urban areas and attacked on aesthetic grounds. Due to the pejorative meaning of the term, few openly support urban sprawl as such. The term has become a rallying cry for managing urban growth [1]. The spatial configuration and the dynamics of urban growth are important topics of analysis in the contemporary urban studies. Several studies have addressed these issues which have dealt with diverse range of themes [2], the increase (relative or absolute) in the number of people who live in towns and cities. The pace of urban population growth depends on the natural increase of the urban population and the population gained by urban areas through both net rural-urban migration and the reclassification of rural settlements into cities and towns (SOWC 2012).
Study Area
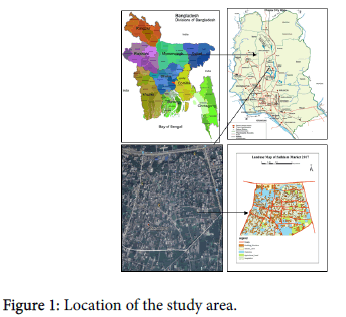
Saddam market area is located in Kadamtali Thana, Dhaka South City Corporation. Saddam market is geographically located latitude 23°41’34’’ to 23°41’11’’ North and longitude 91°28’’50’ to 91°28’53 E. Saddam Market area is alongside with the Dhaka-Chittagong road highway. This highway is so important because it connects at least 32 districts of the southern part of Bangladesh. So everyday thousands of people have to use this road. Saddam market area is on the periphery and the connectivity is very easy with the capital (Figure 1).
Aim and Objectives of the Study
This study aims to find the development of the peripheral area of the Dhaka city. Saddam market is such an area on the periphery of the Dhaka city that is located at the south eastern peripheral part of the Dhaka city.
The aim of the this study is to produce a land use/land cover map of Saddam market area at different years in order to detect changes that have taken place particularly in the built-up land and subsequently to analyze the urban physical growth trend of the different time period and to predict the population growth and urban area growth in the same zone over a given period (2005-2017).
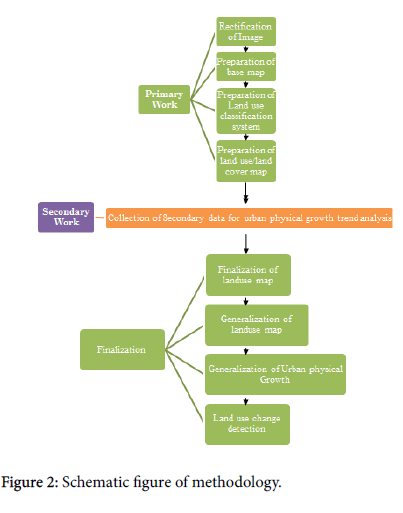
The objectives of the study are to analyze the urban physical growth of Saddam market area at Kadamtali thana in Dhaka city. To examine land use change between years 2005 to 2017 (Figure 2).
Methodology
Primary work
Pre field work comprises of rectification of image that is primarily collected from Google earth. A base map was selected for the digitization of the land use map after setting up the classification of the land use. This segment is finalized with the preparation of the land use map of Saddam Market Area, Kadamtali Thana.
Secondary work
Primary data are collected from field work on the study area by questionnaire survey to find out the impacts of the physical growth that had occurred from 2005 to 2017. Secondary data are collected to prepare the land use map.
Finalization
Post field works are Finalization and generalization of the land use map. Detection of the land use change from 2005 to 2017. Finally the interpretation of the questionnaire survey data to find the impacts of this physical growth of the city on the people living in the study area.
Land Use Categories
Land Use is defined as the observed (bio)-physical cover of the earth’s surface.
Land use involves the management and modification of natural environment or wilderness into built environment such as settlements and semi-natural habitats such as arable fields, pastures and managed woods. It also has been defined as the total of arrangements, activities, and inputs that people undertake in a certain land cover type.
Land use of the Saddam market area, Kadamtali has been divided into six specific divisions. Thus the land cover is clearer to identify and the use are very common. This report tries to keep things simple and authentic and that’s why remote sensing data are analyzed and GIS tools have been used. As the raw image taken was clear so no supervised or unsupervised classification were needed. The classification is as follows:
• Roads
• Building Structure
• Agricultural land
• Vegetation
• Water body/wetlands
• Vacant area
Roads
Road is the most important land use of an area. So for classification of the land use road is taken with priority. The given area Saddam market, Kadamtali has very well connected road network. It stands by the Dhaka Chittagong road highway and so many interconnecting roads in the local area. In between ten to fifteen years the numbers of roads has been increased and the condition of the road has also been improved.
Building structure
Building structure is a land use classification of a built up area. It is a major sign of land use that indicates the development of an area. Thus this study took building structure as a major land cover classification. There is a certain change in the building structure in the last decades in the Saddam market area, Kadamtali.
Agricultural land
Land use of an area basically needs to start with the agricultural land if a study tries to identify a change from rural to urban progression. More agricultural land is suggests more rural environment. This study finds that ten-fifteen years back Saddam Market area, Kadamtali had mostly covered by Agricultural land. But at present it is densely populated and built up area.
Vegetation
Naturally green covered area is known as vegetation area and can be classified as very important land use. In general the arid areas don’t have vegetation to classify as land cover. But this study of the peripheral area of the Dhaka especially in Saddam market the vegetation percentage as land cover is so high thus this has been taken as a land use.
Water body
Water body covers a certain portion of land cover. Though water body covers three fourth of the earth’s land cover but it is not seen in every area. Wetland or water body is thus very important land use. Saddam market area, Kadamtali has a great coverage of wetlands.
Vacant area
Unoccupied or fallen lands are classified as vacant area. In the concern for urban peripheral area there have been seen some vacant lands that have been occupied by different uses gradually with time elapsed. Vacant areas of Saddam Market, Kadamtali were so many and with the progression of time they have been used variously thus this classification is taken with priority as a land use.
Growth Trend
Saddam Market has been growing with urban flavor, growing in population and infrastructure. An observation of the satellite imagery on the Saddam Market area shows that this area has a sudden change in number of house and decrease in the area of agricultural land and vegetation cover as well as water body.
We took satellite imagery of 2005, 2010 and 2017 of about 4.13 square kilometer of area of Saddam Market to observe how much it has been changed to grow in number of infrastructure and comparatively lessen the vegetation and agricultural land area by the influence of urban growth.
We found a huge progression in the number of building structures and comparatively fall in the area of the other fields. This unplanned growth is somehow not positive. This has a miscellaneous effect on the people and their surrounding environment.
There is huge damage in vegetation and decreasing in the agricultural land. None of these have good impact on the land use of this peripheral study area. In the following chapters we will find the fact that how this growth effects on the down town area of Saddam market and its impact on the socio-economic, political and environmental aspects.
Land use of Saddam Market area, Kadamtali Thana (2005)
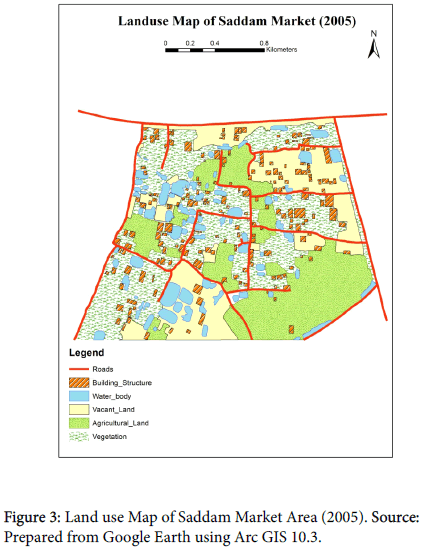
In 2005, on about 4.13 square kilometer of area, there were 206 infrastructures which covered 0.33 square kilometer of area, 1.8 square kilometer area was covered by vegetations; 1.0 square kilometer covered by agriculture 0.65 square kilometer area was vacant land and 0.35 square kilometer was aquifers.
Thus the percentage of building structure was 7.99%, vegetation was 43.58%, agriculture was 24.21%, vacant land was 15.73% and aquifers was 8.47%. The digitized map beside shows the landuse map of Saddam market of year 2005. The map includes the Dhaka Chittagong Road highway on the northern part and the local roads and shows the vegetation with light green and agricultural land by deep green (Figure 3). The number of building structures was not so high and the area was rich in vegetation and agriculture. There were several aquifers and vacant land (Table 1). The area was more like rural environment. Mostly agricultural based activities were seen there [3].
| Land Cover Area of Saddam Market with Percentage (Year 2005) | ||
|---|---|---|
| Land cover field | Area(sq km) | Percentage of land use |
| Building structure | 0.33 | 7.99 |
| Vegetation | 1.8 | 43.58 |
| Agriculture | 1 | 24.21 |
| Vacant land | 0.65 | 15.74 |
| Water body | 0.35 | 8.48 |
Table 1: Land cover area of Saddam Market with percentage (Year 2005). Source: Data Acquired from Prepared Land Use Map by Using Arc GIS 10.3.
Land use of Saddam Market area, Kadamtali Thana (2010)
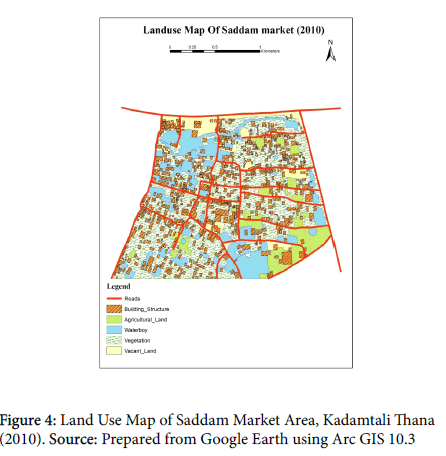
In 2010 on about 4.13 square kilometer of area, there were 841 infrastructures which covered 1.01 square kilometer of area, 1.30 square kilometer area was covered by vegetation’s; 0.95 square kilometer covered by agriculture 0.35 square kilometer area was vacant land and 0.52 square kilometer was aquifers. Thus the percentage of building structure was 25.45%, vegetation was 31.00%, agriculture was 23%, vacant land was 8.01% and aquifers were 12.54% (Figure 4).
The increasing rate of the infrastructure was too high. People tend to come here because of low price of land and good road network connectivity. The greener scenario was gradually decreasing then. The total development was based on infrastructures. Damage was done to agriculture and water body hugely. Most of the buildings were then semi pucca or tin Shed building (Table 2). People from different parts of the country tend to buy plots here and build tin shed buildings to keep the land to their possessions [4].
| Land Cover Area of Saddam Market with Percentage | ||
|---|---|---|
| Land cover field | Area (sq km) | Percentage of land use |
| Building structure | 1.01 | 25.45 |
| Vegetation | 1.3 | 31 |
| Agriculture | 0.95 | 23 |
| Vacant land | 0.35 | 8.01 |
| Water body | 0.52 | 12.54 |
Table 2: Land Cover Area of Saddam Market with Percentage (Year 2010). Source: Data Acquired from Prepared Land Use Map by Using Arc GIS 10.3
Land use of Saddam Market area, Kadamtali Thana (2017)
In 2017 on about 4.13 square kilometer of area, there were 914 infrastructures which covered 1.11 square kilometer of area, 1.23 square kilometer area was covered by vegetations; 0.92 square kilometer covered by agriculture 0.37 square kilometer area was vacant land and 0.50 square kilometer was aquifers (Figure 5). Thus the percentage of building structure was 26.87%, vegetation was 29.78%, agriculture was 22.28%, vacant land was 18.96% and aquifers was 12.11%. The digitized map beside shows the land use map of Saddam market of year 2017 [5].
The map includes the Dhaka Chittagong Road highway on the northern part and the local roads and shows the vegetation with light green and agricultural land by deep green. The number of building structures was very high and the area was rich in vegetation and agriculture (Table 3). There are less aquifers and vacant land. The area is now more like urban environment but not well planned. As the area has been built up without any plan of the government or any other concerning housing society thus it is an earth quake disaster prone area because buildings are congested and unplanned.
| Land cover area of Saddam Market with percentage (Year 2017) | ||
|---|---|---|
| Land cover filed | Area(sq km) | Percentage of land use |
| Building structure | 1.33 | 31.87 |
| Vegetation | 1.11 | 30.78 |
| Agriculture | 0.9 | 19.28 |
| Vacant land | 0.31 | 7.6 |
| Water body | 0.48 | 11.1 |
Table 3: Land Cover Area of Saddam Market with Percentage (Year 2017). Source: Data acquired from prepared land use map by using Arc GIS 10.3
The area of agricultural land decreased 1.0 square kilometer to 0.92 square kilometer from 2005 to 2017. Vegetation cover area decreased to 1.8 square kilometer to 1.23 square kilometer; vacant land area decreased 0.65 square kilometer to 0.37 square kilometer, the wetland area increased 0.35 square kilometer to 0.52 square kilometer from 2005 to 2010 but decrease to 0.50 square kilometer in 2017. But the roads have been increased and well-connected from 2005 to 2017 (Table 4).
| Land Use Field | Land Use Percent 2005 | Land Use Percent 2017 | Change in Land Use area Percentage From 2005 to 2017 |
|---|---|---|---|
| Building structure | 7.99 | 31.87 | 298.87% Increase |
| Vegetation | 43.58 | 30.78 | 29.37% Decrease |
| Agriculture | 24.21 | 19.28 | 20.36% Decrease |
| Vacant Area | 15.74 | 7.60 | 51.71% Decrease |
| Water body | 8.48 | 11.10 | 30.89% Increase |
Table 4: Comparative Analysis of Land Use Percentage from 2005 to 2017. Source: Analysis of Acquired Data from Prepared Land Use Map
Comparative Analysis and Discussion
In 2005 the number of building structures was 206 and in 2010 the number went up to 841. At the end of 2017 almost 914 building structures were seen. Land use by building structure jumped 31.87 percent from 7.99 percent from 2005 to 2017. So the increasing rate from 2005 to 2017 is 298.87 percent. This is really huge [6].
Analysis shows unplanned activities had happened on the study area. The buildings are not serially or disciplined wise built. They used most of the vacant areas and even on the agricultural land and water bodies. This has great negative impact on the people living in the study area [7-10].
Conclusion
There have been a lot of infrastructural changes in the periphery of the Dhaka city in between 2005 to 2017. This chapter shows all the comparative analysis with graphical presentation with the data mining. All these data and information show that this peripheral areas growth is at concerning level. This flow cannot go further as the same progress to keep a gentle urban model city. So proper steps must be taken from here for planning the peripheral city area.
The land use of the periphery of Dhaka City is hugely influenced by the impact of infrastructure development which leads to environmental degradation. Agriculture, settlements are the main land use. The growth trend is so fast and thus it is almost unplanned. Agricultural land is decreasing because of intensity of increasing of new settlements on arable land. New Infrastructure seizes arable and fallow land to build up. New dimension land use like new industry, new road network, car garaging industry that occupy land and lead to economic progress as well as environmental degradation and political influences.
• As an unplanned development have occurred on the Saddam market area located in Kadamtali Thana, thus these developments are not all useful in all the sectors of lives of the people of the study area. This trend of growth on the peripheral city area used most of the agricultural and vacant land uses. Land use by building structure jumped to 31.87 percent in 2017 from 7.99 percent in 2005. This has immense effect on the previous rural natural environment and the serenity of the study area. In the previous time this area produced lots of agricultural products mostly rice and vegetable and had great contribution to the food system of the local and surrounding area’s people.
• Vacant lands which were used as play grounds and other purposes are almost vanished at present times. Most of the vacant land areas are occupied by building structures at present times. The rate of decrease is 51%. So this is not good sign for this peripheral urban area to grow as a planned developed urban area. There is no space for children.
• Water bodies have been increased interestingly. A new canal has been dug after 2005. Some permanent water logging is seen here. So the increasing rate is 30.89% Increase. As drainage system is not proper and this area is a low land and even in the DND barrage, thus this kind of water logging has increased the quantity of water bodies in this area.
• Road connectivity is the most developed sector and well-connected after the building structure. From 2005 to 2017 few numbers of local roads joining the main road are created. That attracts people from different place of the city to this area to live in because of well connectivity through the city.
• Economic condition of the people of the Saddam market area is advancing with the physical growth. The average income level has been increased from 7500 to 20000. Occupation of the local people has been changed in last 10 years. People prefer to live here because of comparatively low house rent to the other areas. Land price has been increased with so high rate in this area. Most of the people here are of middle income. So impact of physical growth is positive on economic life of the people living in Saddam market area, Kadamtali.
• Impact of this physical growth on Saddam market area especially on its social life is various. Most common outcome is the family segregation. Most of the local families were joint families in the recent past but majority are now segregated single families because of this growth and to keep pace with the modern life. Number of schools and madrasa are increased. Family Segregation Living standards are higher than past. Security management is also developed. Terrorism, social chaos exists but is negligible. So overall impact on social life due to this physical growth is positive.
• Most badly affected sector by the impact of this physical growth is the environment of Saddam market area. Environment is actually degraded. Deforestation occurred and agricultural land is decreased. Greener environment is almost perished. Concretes are seen all around the area. Garbage dumping is seen here and there. No proper drainage system is there. Air has been polluted. Average temperature has been increased. Serenity has also been lost comparing to the past situation.
• Local people are satisfied with all the facilities they have except the drainage system. They have all the facilities like security, electricity, water supply, gas transportation. People living in Saddam market area are satisfied with the facilities by the government. They want the improvement in the recreation facilities and drainage system.
Advantages
• People can live in an urban like environment even living in the periphery of the Dhaka city. It is not like well-defined urban area like Gulshan, Baridhara or Dhanmondi, but the road connectivity and the serenity makes it a better place to live it.
• As the house rent is comparatively low people can live here cheaply. The basic facilities are available like gas, water, electricity, garbage management. Also the transport rent is cheap and roads are very well connected to the main city. Thus people from all classes prefer to live here.
• Saddam Market area is almost built up. Thus many housing society and builders have their interest to build multistoried buildings and apartments. There are many apartments too.
• City Corporation doesn’t have to re-construct the area or no need to run project like Uttara, Purbachal; just need to facilitate the present situation and do things sustainable for the future.
Disadvantages
• Buildings here in Saddam market area are so clustered and are not very well planned. Thus it is at high risk during ‘earth quake’. The effect of the disaster may have been massive for this situation.
• Roads are not even and not sector wise divided. Thus it does not meet the demand of a modern urban area. The interconnected local roads are not wide also. So reconstruction of roads are needed somewhere.
• The Saddam Market area is a low land. It is also in between the DND barrage. So water logging is a very common scene here during the rainy season. For this, proper drainage management is not possible sometimes because the highway is too much elevated than the elevation of the area.
• The cheap house rent and well-connected road facility here sometimes suitable for the low income people. They prefer to live in the periphery.
References
- James P, Holden M, Lewin M, Neilson L, Oakley C, et al. (2013) Managing Metropolises by Negotiating Mega-Urban Growth. In: Mieg H, Töpfer K (eds) Institutional and Social Innovation for Sustainable Urban Development, Routledge.
- Acioly C, Davidson F (1996) Density in Urban Development in Building Issues, (Vol.3), Lund Centre for Habitat Studies, Lund University, Sweden.
- Di Gregorio A, Jansen LJM (1997) A new concept for a land cover classification system. In: Proceedings of the Earth Observation and Environmental Information 1997 Conference. Alexandria, Egypt.
- Alberti M, Waddell P (2000) An Integrated Urban Development and Ecological Simulation Model. Integrated Assessment 1: 215-227.
- Almeida CMD, Monteiro AMV, Câmara G, Soares Filho BS, Cerqueira GC, et al. (2005) GIS and remote sensing as tools for the simulation of urban landuse change. Int J Remote Sens 26: 759-774.
- Bhatta B, Saraswati S, Bandyopadhyay D (2010) Urban sprawl measurement from remote sensing data. Applied Geography 30: 731-740.
- Kaiser EJ, Godschalk DR, Chapin FS (1995) Urban land use planning (Vol. 4) Urbana, IL: University of Illinois Press.
- Mahmud S, Huq ME, Kar A, Mashraky R, Khatun F, et al. (2014) Managing development of fringe areas in Dhaka City:"Land Readjustment" as a technique for sustainable future development ensuring environmental and social justice. IJURA 6: 5.
- Ratnaparkhi NS, Nagne AD, Gawali B (2016) Analysis of land use/land cover changes using remote sensing and GIS techniques in Parbhani City, Maharashtra, India. International Journal of Advanced Remote Sensing and GIS. p: 1702.
- Shivpuje P, Deshmukh N, Bhalchandra P, Khamitkar S, Lokhande S, et al. (2016) Investigation for Land Use and Land Cover Change Detection Using GIS. In: Proceedings of the International Congress on Information and Communication Technology: 393-399.
 Spanish
  Chinese
  Russian
  German
  French
  Japanese
  Portuguese
  Hindi
Hindi 