Spanish
  Chinese
  Russian
  German
  French
  Japanese
  Portuguese
  Hindi
Hindi Research Article, Res J Econ Vol: 3 Issue: 1
Real Exchange Rate and the Size of the Country in Selected Oil Exporting Countries
Ashour M1,2*, Yong CC1 and Cheong KC1
1Department of Economics, Faculty of Economic and Administration, University of Malaya, Kuala Lumpur, Malaysia
2Department of Business Adminstration, College of Science and Humanities in Rumaah, Majmaah University, Riyadh, Saudi Arabia
*Corresponding Author : Ashour M
Department of Economics, Faculty of Economic and Administration, University of Malaya, Kuala Lumpur, Malaysia
Tel: 996504176576
E-mail: M.ashour@mu.edu.sa
Received: October 23, 2019 Accepted: November 05, 2019 Published: November 11, 2019
Citation: Ashour M, Yong CC, Cheong KC (2019) Real Exchange Rate and the Size of the Country in Selected Oil Exporting Countries. Res J Econ 3:1.
Abstract
This paper empirically evaluates the impact caused on the real exchange rate of the selected 51 oil exporting countries with respect to their size from the period of 2001-2010. Regression model is used for the analysis with respect to the GDP percentage on the REER, foreign income and the dummy variable of exchange rate regimes. The results indicate that the size of the country does not have an asymptotic relationship with the real exchange rate and that country size absorption effect does not contribute towards mitigation of the Dutch Disease effect subsequent to the oil boom.
Keywords: Country size; Real exchange rates; Dutch disease; Oil exporting countries
Introduction
Dutch Disease (DD) dilemma is the phenomenon that leads to deterioration of the manufacturing sector and is characterized by the appreciation of the real exchange rate. According to Brahmbhatt [1], the resource revenues serves as a great source for compelling the labor as well as the capital from the resource sectors (resource movement effect) while at the same time increasing the demand made domestically (Spending effect), which consequently leads to increased prospects for higher real exchange rate as well as service sector expansion. However, in cases of energy resources, the resource sector is identified as an enclave sector Badeeb et al. [2], where the production factors are rarely drawn from other sectors as the economy of these countries significantly relies on the oil production sector. Therefore, DD cases can be observed as the agent for causing spending effect.
Notably, the Dutch Disease issue is not an inevitable consequence for all countries and this signifies the existence of certain factors behind the hypothesis. Though there is an extensive explanation of the hypothesis drawn on previous studies that came with paradoxical outcomes. For instance, the individual case studies found different signs of DD in Australia Karunaratne [3] Dwyer et al. [4], the United Kingdom Palma [5,6], Mexico and Nigeria [7-9]. However, no evidence was found in countries such as Norway, Brazil, Chile, and Saudi Arabia [10-13].
Recently, the empirical research started to initiate an investigation of the effect of other factors on the phenomenon. For instance, the degree of intensity of production factors, which are functioning in the manufacturing industries serves as an issue in economic literature [14]. Also, the effect of imports and labor migration are other factors, which have been examined by Harding and Venables [15] and Reboredo [16]. However, there are still some factors, which have not been researched yet or maybe the studies conducted on the subject are not sufficient. One such factor is the size of the country, which is identified as the agent causing a degree of influence on the concerned phenomena.
It is apparent that the value added of manufacturing for 48 oil exporting countries seems to be higher with the increased size of oil exports relative to the size of population and the country size (Figures 1 and 2). In other words, DD can further be severe in smaller country areas as well as on the sizes of population.

Figure 1: Comparing the manufacturing value added (%GDP) between biggest and smallest area of oil exporting countries.

Figure 2: Comparing the manufacturing value added (%GDP) in different size of oil exporting relative to the population of countries.
The effect of the oil exports size considering the country area and population size arrives as the result of government expenditure. As Harding and Venables [15] point out, the role of government is manifested in spending on building the infrastructure and all the development projects in the country. So, when such expenditure is financed by oil revenues, the fluctuating fiscal balance will correspond to oil price changes [17]. Based on this assumption, the size of oil must be considered in assessing the hypothesis along with the consideration of the population size and country area, which can determine the effect on spending.
There are reasons behind the spending relationship with respect to the amount of oil, the population size, and country area. Firstly Lowi [18] suggested that population size is related to the effect of absorption, which determines the GNP level in the country, for example, Saudi Arabia and Bahrain face low-absorption because of small population size whereas the countries such as Mexico and Venezuela show highabsorption because of high population size. Secondly Commonwealth Secretariat Chisik et al. [19] suggested that a large population can mitigate DD by providing more workers against an increasing demand for employment.
The country area can also have an effect as it is concerned with the aspects related to spending on infrastructure, education, and health across various regions in the country. This effect is caused as the market size assimilates the area and the population of the country due to which diversification of resources gets impacted restricting the production as well as export which takes place in the country [20]. Furthermore, the area of the country could affect the volume of the exported oil when most of the oil is used domestically, so the country is considered and counted as a net oil importer as in the case of China and USA [21].
The style of examination is one of the reasons for the mixed results. By varying the methods of examination, some researchers studied the effects on the economic growth [22-24]. Others used abstract evidence from resources to non-resources exports or manufacturing, such as Harding and Venables [15] as well as Smith [21]. But the problem is that both methods of investigation could include other effects of resources curse hypothesis (such as institutional, educational and the effect on savings) [25], where the Dutch Disease represents one of the channels.
The relationship from resources to manufacturing could also imply the benefits of capital accumulations, which comes through the resource revenues as explained by Van der Ploeg [26]. So, finding the most relevant relationship to the phenomenon is an inconclusive debate. Hence, it was perceived that the effect of the size of the country was also not identified. Likewise, statistics showed some sensitivity to the size of oil exporting that triggered the extent of exposure to DD. These aspects can be considered as acknowledge required for policymakers to clarify the most and least cases of affecting DD and thus supply in efforts according to the degree of threat posed by it.
To show the extent of exposure to DD phenomenon, the goal of the study is to determine the country size in relation to area and population on Dutch Disease effect. The Dutch Disease effect in this study is represented by decreasing non-oil exports occurring due to a deterioration of competitiveness measured by the real exchange rate. To this end, the study aims to make a significant contribution to theory by providing an insight into the validity of the size of oil exporting countries to interpret the causes of varying extent of DD effect across net oil exporters.
The outcome of this study would be beneficial for policymakers in clarifying the extent of the policy success using the real exchange rate policy. For example, knowledge of this issue will help the policy makers in legislating regulations about the DD effect and the size of the country as well as its implication on the spending policy. This can be related to controlling rising wages, such as easing labor migration, and issuing caution against increased government spending, especially with a small population. So, this investigation helps to show the extent of the effect caused by this factor and analyzing whether it is critical or not.
Literature Review
The size of a country can be considered as an important factor to which resources can affect price levels in that country. Logically, when a country’s size or population is large, this may not increase income levels as much as when a country is small. The link between natural resource revenues and country size comes through government spending. As Harding and Venables [15] point out, its role is manifested in spending on building the infrastructure and all the development segments in the country. When this expenditure is financed by oil revenues, the fluctuating fiscal balance will correspond to oil price changes, which can threaten the sustainability of the internal balance as expressed by Medas and Zakharova [17].
Even when managing this expenditure, limited levels of spending will be consistent with the capability of being financed by oil endowment [17]. Furthermore, it is worth noting that the government budget of the top oil exporter does not compare with a lower one within the same level of development. Consequently, oil revenues inevitably affect the government spending, which can change income levels.
As per the report provided by the The World Bank [27], it is highlighted that by utilizing the re-basing approach, the share prediction of the oil, as well as the gas, has mitigated. However, the country oil division prevails to sustain its large share in the country’s budgetary revenue as well as the revenue earned on the exports and budgetary revenues. Considering the oil revenue and government spending, Hamdi and Sbia [28] conducted a study on the Kingdom of Bahrain economic advancement. It showed that the oil revenues earned by a country significantly contributes to the economic growth and serves as a chief source with respect to the government spending.
The literature refers to explain a part of changes in DD effects by the size of a country’s population. According to Lowi [18], population size is related to the effect of absorption to determine the GNP level in the country and the demand for luxury services. For example, Kuwait, Saudi Arabia, and Bahrain face low-absorption that depicts a small population, while Iran, Mexico, and Venezuela show high-absorption and a large population. However, there is a possibility that lowabsorption can have low per capita GNP to diversify its economic base Chisik et al. [19] suggested similar results that a large population can mitigate DD by providing more workers against increasing demand for labor, but this occurrence (resource movement effect) can only happen between the manufacturing and services sectors, as oil resources need little labor.
A country’s area also relates to the size of oil exports. A larger area indicates more spaces and more services, such as infrastructure, education, health, and energy products to satisfy local demand. Furthermore, with a large area, a country will use most of its oil domestically and then account as a net oil importer. For instance, the USA is accounted as net oil importers in some studies, as is China [21], and most oil sales happen between states inside the country. This can reverse the adverse effects of DD, and even benefit from a decrease in oil price [29]. Correspondingly, the study of Wang and Zhang (2014) is consistent with the statement highlighting that the decrease in oil price contributes positively to the industrial production.
Some empirical studies confirm the relationship behind this factor which can be considered as signs to the importance the relationship. Such as Farzanegan [30] endorsed this statement by highlighting that the advancement in the oil revenue raises the government’s capability of spending. This increase in spending is a liaison with the advancement of its oil industry capability improving the oil revenue earned and oil exported. In Azerbaijan, a one percent increase in oil revenue increased government spending by two percent [31]. Finally, as per Rickne [32], there is a significant positive association between government spending and RER among 33 oil-exporting countries.
To some extent, income levels depend on the population sizes of oilrich countries. Toto Same [33] study of the Sub-Saharan African countries ensures that one of the reasons behind improved per capita GDP in oil-exporting countries is increasing oil revenues relative to that country’s population. However, the contradictions may exist due to protecting policies; for instance, Indonesia can overcome DD consequences by decreasing spending, and manage deviations of the exchange rate in favor of the non-oil export sector. The government relies mainly on another source of income including manufacturing commodity exports to concentrate on increasing agricultural production [33]. Finally, Toto Same [33] concludes that Indonesia can benefit from an increasing population in the form of expanded production capacity in the local market in favor of industrial development.
Methodology
Model of the study
The model of the study is comprehensively based on the export demand function. The conventional demand theory of exports [34,35] assumes that exports are imperfect substitutes for domestic traded goods, and; thus, consumers maximize the utility depending on the budget constraint. So, export demand is affected by prices and income.
The non-oil exports as a percentage of GDP (X), which represent the dependent variable instead of the total value of export. Real effective exchange rate (REER) represents the price indices (the price of exports in the local market and the price of substitutes in the world market), and the nominal exchange rate is also added to compute the effect of differences between foreign exchange rates. The foreign income (YF) represents the income of the potential imported region. Additionally, the dummy variable of the exchange rate regimes (LY) is added to strengthen the results. So, the model of the study can be represented as follow:
 (1)
(1)
The DD hypothesis can be distinguished by the negative sign of the coefficient of REER to represent the contraction of non-oil exports. The sign and severity of the effect are supposed to be affected by the size of the country. However, there are some difficulties faced with respect to highlight the appreciation case of the RER (real appreciation). Because in the linear estimation, the results take the average of a relationship without distinguishing the case of depreciation and appreciation of RER.
Specifically, the Kremer, et al. [36] model for Dynamic Panel Threshold Model can estimate based on the threshold of the high rates of REER, besides solving the problem of the endogeneity bias of explanatory variable, and the ability to use the model’s unbalanced data.
By taking logarithms for the variables, the model of the Dynamic Panel Threshold Model (36) is as follows:
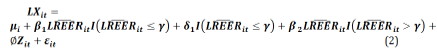
 represents threshold variable and the regimedependent regressor.
 includes the remaining controlling variables (regimeindependent variables), which include:
  is the endogenous variable of
 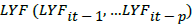 .
.
 involves the rest of the controlling variables, is the dummy variable of exchange rate regimes
  is the intercept in each regime and is used for controlling the omitted variables effect Irepresents the dummy variable of the regime whether it is an upper or lower threshold value.
  preforms the idiosyncratic error term of the individual and time , that has the ordinary assumptions of the panel equation
  .
.
REER is expected to have a negative sign within oil exporter group above the threshold; however, below the threshold, it could be positive or negative or insignificant. Regarding other variables, YF is supposed to have a positive sign, i.e. increasing the world income, which motivates the non-oil export production. Empirically, the expected sign has been verified with the trade balance [37] and exports of Australia [38]. However, there is a probability to exist negative association because of including exports of oil by determining the highest 15 partners, and the channel of real exchange rate when increasing the foreign income encourage oil exports.
The expected sign of the dummy variable of exchange rate regimes is unidentified in the literature. The degree of the nominal exchange rate flexibility has a paradoxical impact, where each type of exchange rate regime has both benefits and costs. Floating exchange rate is the best to accommodate real shocks, while a fixed exchange rate can isolate the monetary shocks and provide the credibility and stability to encourage local investment. The impact can also be determined based on the mechanism of Dutch Disease, where floating exchange rate leads to the overshooting of the real exchange rate in the short run, which increases the loss in the sector.
Meanwhile, a fixed exchange rate is used to accommodate that overshooting, due to which the real exchange rate reaches its long-run equilibrium directly. In contrary, the productivity of the production factors is said to be higher with floating exchange rate, because the real exchange rate reaches its equilibrium more rapidly, but in the fixed exchange rate, the balance leads to exceeding inflation in the country. Subsequently, it is effective in determining the sign, which is based on the net effect.
Sample of the study
Oil export is determined through the sample used, where the concentration of the analysis is based on the net oil exporting countries. This is because exporting oil is distinct by increasing its demand internationally, so, this makes the real exchange rate more likely to be affected by oil prices. In particular, the oil sector is an “ enclave ” , and the effect happens through “ a spending effect ” . Furthermore, oil revenue is distinct in that it increases demand from the world and provides an easy revenue, which could increase the desire to sell when its price goes up. Afterwards, the relationship is supposed to be more severe among these countries.
For that purpose, a sample of the study included 51 net oil exporters and covers the period from 2001-2010. Based on WEO/IMF, WB and the NAMA/UN database, the size of oil exporting is calculated in two formats (Size 1 and Size 2) as follows:
 (3)
(3)
 (4)
(4)
Size 1 represents the size of oil exporting considering the area of the country, and Size 2 represents the size of oil exporting relative to the population of the country. In each format (Size 1 and Size 2), the data is sorted in a descending order. Afterwards, they are divided into two parts, based on the medial observation of each format (13339.6 and 535.3 in Size 1 and Size 2 respectively), the categorization is done as follows:
Where
B1 represents the increasing size exporting oil relative to area of the country,
B2 represents the decreasing size of exporting oil relative to area of the country,
B3 represents the increasing size of exporting oil relative to the population of the country,
B4 is the decreasing size of exporting oil relative to the population of the country.
Results
The stationary test shows that the first difference is more prober for the analysis (Table 1). By assuming homogeneity among countries, Im et al. [39] test (LLC) revealed that all variables are stationary at the level I (0). However, with heterogeneity across countries, the results are different with Im et al. [39] test (IPS). At the level, almost all variables except the null hypothesis with varying lengths of lags, relying on SIC from 0-1 and with both constant and trend (both are exogenous variables). However, at first difference, the null hypothesis can be rejected with constant and constant and trend at 1% level of significance, and acknowledge that all variables are stable at the first difference I (1). With respect to LREER, it is still stable in the level and the first difference, and that is because of the Purchasing Power Parity hypothesis (PPP) [40].
| Variable | LLC test | IPS test | |||
|---|---|---|---|---|---|
| Constant | Constant and Trend | Constant | Constant and Trend | ||
| level | LXit | -4.17793** | -5.48126** | -0.34998 | 0.11562 |
| (0.0000) | (0.0000) | (0.3632) | (0.5460) | ||
| LREERit | -11.7761** | -31.6831** | -3.68814** | -5.72072** | |
| (0.0000) | (0.0001) | (0.0001) | (0.0000) | ||
| LYFit | -6.09296** | -4.61488** | 3.01772 | 2.74684 | |
| (0.0000) | (0.0000) | (0.9987) | (0.9970) | ||
| First difference | LXit | -17.8258** | -28.5794** | -9.26238** | 4.37227** |
| (0.0000) | (0.0000) | (0.0000) | (0.0000) | ||
| LREERit | -40.6222** | -29.9138** | -12.6704** | -3.72278** | |
| (0.0000) | (0.0000) | (0.0000) | (0.0001) | ||
| LYFit | -14.4470** | -21.2911** | -5.77653** | -3.24915** | |
| (0.0000) | (0.0000) | (0.0000) | (0.0006) | ||
Table 1: Panel unit root test.
The estimation method verifies the importance of including the individual effects in the model that follow the fixed effects estimation. As shown in Table 2, the results of the Redundant Fixed Effects test support adding the Individual effects where the F-statistic (1.87) of cross-section is high at the degree of freedom. Regarding the Hausman [41] test, Fixed Effects is more appropriate than Random Effects of the model, where the statistic of Chi-Square is higher than the table value at 3 degrees of freedom and 5% level of significance.
| Test results | Statistic | d. f. | Probability value |
|---|---|---|---|
| Redundant Fixed Effects Tests | 1.87 | (51, 461) | 0.0007 |
| Hansen Test | 10.18 | 3 | 0.01 |
Table 2: The individual effects tests.
The threshold dynamic panel model for Kremer et al. [36] is presented in Table 3. Threshold values (0.064, 0.072, 0.05, -0.03) for all regressions are placed within intervals confidence at a 95% level of confidence with the three standards; uncorrected heterogeneously, with corrected by Quad and by NP.
| Regression | 1 | 2 | 3 | 4 | |
|---|---|---|---|---|---|
| The comparison | 1 | 2 | |||
| Group | Increasing oil export revenues (land) | Decrease oil export revenue (land) | Increasing oil export revenues (population) | Decreasing oil export revenues (population) | |
| Dependent variable | Non-oil exports %GDP | Non-oil exports %GDP | Non-oil exports %GDP | Non-oil exports %GDP | |
| Threshold estimates: 95% confidence interval |  |
0.064 | 0.027 | 0.05 | -0.03 |
| Uncorrected: Het Corrected Quad Het Corrected NP: |
-0.083 0.07 -0.083 0.07 -0.083 0.07 |
-0.095 0.050 -0.095 0.067 0.027 0.029 |
-0.094 0.071 -0.094 0.071 0.050 0.050 |
-0.075 0.065 -0.075 0.065 0.03 0.03 |
|
| Real exchange rate estimations |  (below) (below) |
-0.31 | -0.58 (1.92) * | -0.69 (4.0)*** | -0.6 (1.25) |
| S. E. | 0.55 | 0.305 | 0.17 | 0.493 | |
 |
0.18 | -0.14 (2.5) ** | -0.22 (1) | -0.24 (3.01) *** | |
| S. E. | 0.286 | 0.044 | 0.22 | 0.087 | |
 (upper) (upper) |
-1.34 | -1.46 (3.05) *** | -2.74 (0.79) | -3.69 (2.7) *** | |
| S. E. | 3.12 | 0.47 | 2.81 | 1.42 | |
| Number of observations | the first regime | 174 | 141 | 153 | 151 |
| the second regime | 41 | 102 | 62 | 82 | |
| Impact of other variables | Foreign income | -0.27 | 0.13 | -0.776 (1.13) | 0.88 (1.10) |
| S. E. | 1.314 | 0.404 | 0. 684 | 0.797 | |
| Exchange rate regimes | 0.08 (1.4) | 0.01 | 0.062 (1.4) | 0.05 (1.35) | |
| S. E. | 0.056 | 0.02 | 0.044 | 0.042 | |
| Number of the cross sections | 23 | 27 | 24 | 26 | |
Table 3: Threshold effect of REER on non-oil export.
Numbers between parentheses are the absolute value of t-test, and ***, **, * denoting to the significance level at 1, 5, 10% respectively.
The null hypothesis can be rejected and acknowledged for the existence of the threshold effect in the relationship. At least one of the regime-coefficients is significant and thus they are unequal  and the regime intercept is also significant
  in regression 2 and 4. In the first two columns, there is no evidence to consider the size of exporting oil relative to (/) the land of the country. The results contradict the expectations, where the hypothesis has not achieved with increasing oil revenue/land and has met with decreasing oil revenue/land. In the first regression, there is no significant impact of the marginal coefficients of REER, while in regression 2 at 1% level of significance, the marginal coefficient above the threshold, is higher in the negative value (-1.46) than the marginal coefficient below the threshold (-0.58) at 5% level of significance.
Similar to the next two columns, the results are also opposite to expectations. In the fourth regression, the marginal coefficient above 0.05 threshold (5% increase in REER) is significant and higher than the coefficient below the threshold in statistical significance, while in the third regression, the coefficient above -0.03 threshold is not significant.
Critically looking at the result, still there is an ability to infer to the related hypothesis. The threshold value is higher with increasing oil revenue with consideration of the two measures. Furthermore, in the second comparison, the marginal coefficient below the threshold is higher in the negative with increase oil revenue relative to population of the country.
Discussion
The study results refer to the relationship of the size of the country to the relationship of the real exchange rate and non-oil exports. These results are confirmed by using two indices; the area of the country and size of the population. Inversely, the results were contradictory with expectations, with a high rate of REER, decreasing oil revenues relative to the size of the country has more supported evidence. However, with a low rate of REER, there is a weak evidence, where the range of the volatility and appreciation of REER is higher in the case of increasing size of oil revenue relative to the area of the land and population.
The responsibility of the government is to enhance the provision of the social and economic infrastructures in the country. So, all vital needs such as infrastructure, health, education, and organization have to be provided by the government; thus, those basic facilities need adequate funding. For many countries, oil revenues account for the main source of government revenue as stated in the annual budget [42]. By assuming the oil revenues, the size of the country affects this responsibility to either rise or reduce. When the government expenditure corresponds to oil revenues, the expenditure could be exceeded or less than the responsibility and; thus, the price level supposed to be affected correspondingly with increasing income level. Some evidence could be considered as one of the empirical views that are examined by some authors’ explanations regarding the absorption effect in accordance to Lowi et al. [18].
Based on the study findings, this argument is not supported, and that the government expenditure does not exactly follow oil revenues, or/and oil revenues are not the main source for government budget of many countries. The results of Aregbeyen and Kolawole [43] are consistent with the findings of the study, which supports that increase in government expenditure is linked to the capital projects along with oil revenues and amplifies the economic growth, improving the income level simultaneously. So, the price level as one of the REER components is not affected by the size of the country. This can be attributed to several reasons, where many countries manage oil resource and/or work to diversify the budget sources. Consistent with Rickne [32] study on 33 oil exporting countries, with improving the quality of the institution, REER is less co-movement with oil price. Also, according to Allegret and Benkhodja [44], increasing oil dependence affects the vulnerability of DD in 16 oil exporters.
Consequently, the effect of the capital inflows from oil revenue is irrespective of the size of the country. The largeness of the country does not necessarily have to accommodate the deterioration of the competitiveness. Equally, increasing the oil export revenues relative to the country size, that is, the country is small, does not necessarily to exaggerate the deterioration of the competitiveness. The study findings are endorsed by Brito [45], which found no empirical evidence of the influence on the economic growth based on the size of the country.
This result came despite attempting to find the accuracy in the investigation. The criteria of sorting countries consider two measures and they are supported to the oil revenues for capturing more related specifications, although the results were mixed. The claim of Lowi [18] regarding the absorption hypothesis, could not be supported where the expectation is that the GNP level and the demand for services is determined by the per capita of oil revenues.
There are reasonable differences from some previous studies, due to varying in the sample used. Because of specific economic structural, one study on Azerbaijan used co-integration method found that the government’s expenditure follows oil revenues [31]. In addition, the study evaluation of Cakrani et al. [46] on Albania also found the association between the government spending and the real exchange rate. Thus, the contradicting could be attributed to the positive impact of oil income. According to Toto Same [33], while the government spending on the development of the country, it facilitates the economic activities including investment and saving and especially if the government commented to encourage the investment in the non-oil tradable sector [47].
The corruption or the bad institutions could lead to wasteful spending, so, the relationship under analysis is not dependent on the size of the country. For example, one study finds that the size of oil revenues improved per capita GDP in six Sub-Saharan African countries, but in that study Levy-Yeyati and Sturzenegger [48], it was not applicable to all the countries, for example, the Nigerian per capita GDP has remained unchanged since 1965 [33].
A large population of the country also contributes towards the improvement of the market potential and meeting the labor needs in all segments of the economy especially in the area where the population is considered as an integral part of the production factors as it significantly contributes in the production of the service. As suggested by Chisik et al. [19], a large population can mitigate DD by providing more workers against increasing demand for labor. In addition, the study of Toto Same [33] on Indonesia also highlights the benefits which are received from an increasing population in the form of increased production capacity in the local market [49-54].
So, based on the study findings, there are other factors which could be incorporated in the relationship that can lead to mixed results when the effect of the size of the country is being examined Mohamad and Jusoff [55]. These factors constitute the quality of institutions and implemented policies. Consequently, it can be inferred that the DD does not have a dominant impact, where, in the result, increasing oil revenue does not show increasing the intensity of the negative sign [56].
Conclusion
The study sheds light on some characteristics of Dutch Disease phenomenon, where the country size is not related to DD effect and this factor must be ignored, when real exchange policy is conducted. DD is not an inevitable consequence to the extent that increasing revenue in small country size does not make the DD effect stronger. Other factors could be important, such as the quality of institutions.
Distinguishing within oil exporting countries based on the size of the country is considered as an innovative approach in classification. The study provides two measures, the first was accounted relative to the population size and the other was relative to the area of the country, and they represent the per capita and share of the area from the oil revenue. Although this indicator is insignificant, the way of classification can be recorded as an initial attempt in this respect. However, the study does not use the alternative ways to determine the criteria of the size of the country, re-examination of the effect of size with different indicators to confirm results. Alternatively, concentrates on Government spending instead, due to an imbalance of the distribution of the oil revenue among the population and area of the countries.
References
- Brahmbhatt M, Canuto O, Vostroknutova E (2010) Dealing with Dutch disease. The World Bank.
- Badeeb RA, Lean HH, Clark J (2017) The evolution of the natural resource curse thesis: A critical literature survey. Resources Policy 51:123-134.
- Karunaratne ND (2015) The Productivity Paradox and the Australian Mining Boom and Bust. Research in World Economy 6: 1.
- Dwyer L, Pham T, Jago L, Bailey G, Marshall J (2016) Modeling the impact of Australia’s mining boom on tourism: a classic case of Dutch disease. Journal of Travel Research 55: 233-245.
- Palma G (2013) Deindustrialization, ‘Premature’ Deindustrialization And A New Concept Of Dutch Syndrome.
- Palma JG (2014) De-industrialization, ‘premature’-industrialisation and the dutch-disease. Revista NECAT-Magazine of the Núcleo de Estudos de Economia Catarinense 3: 7-23.
- Blecker RA, Seccareccia M (2014) Would a North American monetary union protect Canada and Mexico against the ravages of “Dutch disease”? A post-financial crisis perspective. Banking, Monetary Policy and the Political Economy of Financial Regulation: Essays in the Tradition of Jane D’Arista: 171.
- Suleiman H, Muhammad Z (2011) The real exchange rate of an oil exporting economy. Empirical evidence from Nigeria. p: 72.
- Otaha JI (2012) Dutch disease and Nigeria oil economy. African Research Review 6: 82-90.
- Hasanov F (2013) Dutch disease and the Azerbaijan economy. Communist and Post-Communist Studies 46: 463-480.
- Ueno PH (2010) Can Dutch Disease harm the export performance of Brazilian industry? In Conference Paper presented at the Druid Summer Conference.
- Bresser-Pereira LC (2013) The value of the exchange rate and the Dutch disease. Brazilian Journal of Political Economy 33: 371-387.
- Habib MM, Kalamova MM (2007) Are there oil currencies? The real exchange rate of oil exporting countries.
- Ismail K (2010) The Structural Manifestation of theDutch Disease: The Case of Oil Exporting Countries.
- Harding T, Venables AJ (2013) The Implications of Natural Resource Exports for Non-Resource Trade 64: 268-302.
- Reboredo JC (2012) Modelling oil price and exchange rate co-movements. Journal of Policy Modeling 34: 419-440.
- Medas PA, Zakharova D (2009) A Primeron Fiscal Analysis in Oil-Producing Countries. pp.9-56.
- Lowi MR (2009) Oil wealth and the poverty of politics: Algeria compared. Cambridge University Press 17: 730-732.
- Chisik R, Battaile B, Onder H (2014) The distribution of natural resource rents and the Dutch disease.
- Commonwealth Secretariat (2014) Small States: Economic Review and Basic Statistics, Volume 17. London: Commonwealth Secretariat.
- Smith B (2014) Dutch Disease and the Oil and Boom and Bust. Oxford centre for the analysis of resource rich economies. OxCarre Research Paper: 133.
- Sachs JD, Warner AM (1995) Natural resource abundance and economic growth. National Bureau of Economic Research.
- Sachs JD, Warner AM (1999) The big push, natural resource booms and growth. JnofDevtEcon 59: 43-76.
- Treviño JP (2011) Oil-Price Boom and Real Exchange Rate Appreciation: Is There Dutch Disease in the CEMAC?.
- Farzanegan MR (2013) Oil and the future of Iran: a blessing or a curse. Legatum Institute Future of Iran series, London.
- Van der Ploeg F (2011) Natural resources: curse or blessing? Journal of Economic Literature 49: 366-420.
- The World Bank (2014) Nigeria Economic Report.
- Hamdi H, Sbia R (2013) Dynamic relationships between oil revenues, government spending and economic growth in an oil-dependent economy. Economic Modelling 35: 118-125.
- Aleksandrova S (2016) Impact of Oil Prices on Oil Exporting Countries in the Caucasus and Central Asia. Economic Alternatives 4: 447-60.
- Farzanegan MR (2011) Oil revenue shocks and government spending behavior in Iran. Energy Economics, 33: 1055-1069.
- Gurbanov S, Nugent JB, Mikayilov J (2017) Prudent Management of Oil Revenues: Impacts of Government Capital Expenditures in Azerbaijan.
- Rickne J (2009) Oil prices and real exchange rate movements in oil-exporting countries: The Role of Institutions. p: 810.
- Toto Same A (2009) Transforming natural resource wealth into sustained growth and poverty reduction: a conceptual framework for Sub-Saharan African oil exporting countries. The World Bank.
- Goldstein M, Khan MS (1978) The supply and demand for exports: a simultaneous approach. The Review of Economics and Statistics. pp: 275-286.
- Goldstein M, Khan MS (1985) Income and price effects in foreign trade. In: Trade Currencies and Finance. pp: 3-81.
- Kremer S, Bick A, Nautz D (2013) Inflation and growth: new evidence from a dynamic panel threshold analysis. Empirical Economics 44: 861-878.
- Ogutu GO (2014) Effects of the real exchange rate on the trade balance in Kenya.
- Algieri B (2011) The Dutch disease: evidences from Russia. Economic Change and Restructuring 44: 243-277.
- Im KS, Pesaran MH, Shin Y (2003) Testing for unit roots in heterogeneous panels. Journal of Econometrics 115: 53-74.
- Amara J, Papell DH (2006) Testing for purchasing power parity using stationary covariates. Applied Financial Economics 16: 29-39.
- Hausman JA (1978) Specification tests in econometrics. Econometrica: Journal of the Econometric Society 46: 1251-1271.
- Venn F (2016) The oil crisis. Routledge.
- Aregbeyen O, Kolawole BO (2015) Oil revenue, public spending and economic growth relationships in Nigeria. Journal of Sustainable Development 8: 113.
- Allegret JP, Benkhodja MT (2014) The Dutch disease Effect in a High Versus Low Oil Dependent Countries.
- Brito J (2015) Country Size and Determinants of Economic Growth: A Survey with Special Interest on Small States.
- Cakrani E, Resulaj P, Koprencka L (2013) Government spending and real exchange rate case of Albania. European Journal of Sustainable Development 2: 303-310.
- Levin A, Lin CF, Chu CSJ (2002) Unit root tests in panel data: asymptotic and finite-sample properties. Journal of Econometrics 108: 1-24.
- Levy-Yeyati EL, Sturzenegger F (2016) Classifying Exchange Rate Regimes: 15 Years Later.
- Battaile B, Chisik R, Onder H (2014) Services, inequality, and the Dutch disease. The World Bank.
- Wang X, Zhang C (2014) The impacts of global oil price shocks on China ׳ s fundamental industries. Energy Policy 68: 394-402.
- Ng YL, Har WM, Tan GM (2008) Real exchange rate and trade balance relationship: An empirical study on Malaysia.
- Baláž P, Harvánek L (2016) Competitiveness of the Chinese Economy and Its Link to the Global Energy Prices Development. International Journal of Energy Economics and Policy 6: 305-317.
- Darvas Z (2012) Real Effective Exchange Rates for 178 Countries: A New Database.
- Hasanov F (2012) The Impact of the Real Exchange Rate on Non-Oil Exports. Is there an Asymmetric Adjustment towards the Equilibrium?
- Mohamad S, Jusoff HK (2009) Exchange rates and export growth in Asian economies. Asian Social Science 4: 30.
- Stein EH, Fernandez A, Rosenow S, Zuluaga V (2018) Competition-Adjusted Measures of Real Exchanges Rates. Inter-American Development Bank.