Spanish
  Chinese
  Russian
  German
  French
  Japanese
  Portuguese
  Hindi
Hindi Research Article, Int J Cardiol Res Vol: 12 Issue: 4
Regression Prediction of Lesion for HPSD Radiofrequency Ablation Based on Backpropagation Algorithm
Zhiwei Yao*
Department of Medicine, Tianjin Medical University General Hospital, Tianjin, China
- *Corresponding Author:
- Zhiwei Yao
Department of Medicine,
Tianjin Medical University General Hospital,
Tianjin,
China;
E-mail: yaozhiweik@gmail.com
Received date: 03 July, 2023, Manuscript No. ICRJ-23-104649;
Editor assigned date: 06 July, 2023, PreQC No. ICRJ-23-104649(PQ);
Reviewed date: 20 July, 2023, QC No ICRJ-23-104649;
Revised date: 03 August, 2023, Manuscript No. ICRJ-23-104649 (R);
Published date: 31 August, 2023, DOI: 10.4172/2324-8602.1000511
Citation: Yao Z (2023) Regression Prediction of Lesion for HPSD Radiofrequency Ablation Based on Backpropagation Algorithm. Int J Cardiol Res 12:4.
Abstract
Atrial fibrillation is a dangerous arrhythmia and radiofrequency ablation technology is a newly emerging surgical treatment. Compared to the standard radiofrequency catheter ablation mode with low power and long duration, high-power and short duration radiofrequency catheter ablation significantly improves surgical efficiency and has good efficiency and safety. This study will conduct in vitro experiments on high power short-term radiofrequency catheter ablation of pig hearts. The experiments will be divided into 5 groups according to power/time and 4 pressure groups will be divided under each power/time group. The damage size of each ablation point will be measured manually, and 111 sets of experimental data will be obtained. Finally, the algorithm of back-propagation BP neural network is used for machine learning regression prediction of data and evaluation indicators are used to evaluate the advantages and disadvantages of this regression model, such as determination coefficient (R2), Mean Average Error (MAE), Mean Square Error (MSE), and Mean Average Percentage Error (MAPE). According to the results, the four damage sizes of Surface Width (SW), Maximum Damage Width (MW), damage Depth (D) and calculated damage Volume (V) are correlated with eight parameters: power, ablation time, contact force, initial impedance, impedance drop, initial temperature, maximum temperature and temperature rise.
Keywords: Cardiac RF ablation, High power short duration, RF ablation, Backpropagation algorithm
Introduction
Atrial Fibrillation (AF) is a common arrhythmia disease with high incidence rate and great harm. At present, the incidence rate of AF in the world population is rising. Radio Frequency (RF) Catheter Ablation (RFCA), also known as radiofrequency cardiac ablation, is a minimally invasive surgery that applies radiofrequency current through the active electrode at the tip of the catheter, causing irreversible thermal damage to the target or forming linear lesions, preventing the conduction of action potential related to arrhythmia, so as to treat arrhythmia. There are currently three ablation strategies for radiofrequency catheter ablation, namely Low Power Long Duration (LPLD), also known as standard ablation mode, High Power Short Duration (HPSD) and ultra High Power Mode (vHPSD). Low Power Long Duration (LPLD) refers to ablation mode with power greater than or equal to 35 W and each ablation time greater than 10 s, and High Power Short Duration (HPSD) refers to ablation mode with power greater than or equal to 40 W, Any ablation mode with a duration of less than or equal to 10 seconds, while ultra High Power Short Duration (vHPSD) is an ablation mode with a power greater than or equal to 90 W [1]. At present, the standard ablation mode dominated by lower power is widely used in clinical practice, but the ablation mode of High Power Short Duration (HPSD) has been proven to be safe and effective.
Over the years, Radiofrequency (RF) catheter ablation has undergone multiple improvements to maximize lesion size while minimizing complications. However, unpredictable lesion formation has always been the main limiting factor for radiofrequency catheter ablation. As is well known, the Ablation Index (AI) is a quantitative indicator for evaluating lesion size. The main characteristics of the ablation process are ablation time, Contact Force (CF), and power, which are also the main influencing factors of lesion size after ablation. It has been widely used as a quantitative indicator for clinical surgery. However, after our in vitro experiments, we found that not only the ablation time, Contact Force (CF) and power can affect the size of the lesion after ablation. Machine learning is an implementation method of artificial intelligence [2]. Unlike traditional formula based algorithms, machine learning requires finding patterns from massive amounts of data and obtaining correlations between variables.
The aim of this study is to conduct in vitro experiments on fresh and live pig hearts under High Power Short Duration (HPSD) mode. A radiofrequency ablation instrument (manufactured by Shanghai Hongtong company) was used to ablate the myocardium using a 6- hole saline perfusion catheter (manufactured by Johnson and Johnson company in the United States) in constant temperature water, while keeping the saline pump stationary at a distance of 15 mm-20 mm from the electrode to simulate blood flushing. 40 W/10 s, 45 W/8 s, 50 W/6 s, 55 W/6 s were selected 60 W/6 s is used as the power time group, and different pressure groups are divided under different power/time groups, namely 5 g, 10 g, 15 g and 20 g. Record the Surface Width (SW), Maximum Width (MW) and damage Depth (D) under different power/time and pressure groups, and calculate the damage Volume (V). Finally, the data was organized, with power, ablation time, Contact Force (CF), initial impedance, impedance drop, initial temperature, maximum temperature and temperature rise as features, and Surface Width (SW), Maximum Width (MW), damage Depth (D) and damage Volume (V) as targets. Machine learning was used to regress and predict the correlation between various parameters.
Materials and Methods
Animal in vitro experiments
We conducted in vitro experiments on pig hearts with the aim of obtaining the relationship between high power/time (40 W/10 s, 45 W/8 s, 50 W/6 s, 55 W/6 s, 60 W/6 s), pressure (5 g, 10 g, 15 g, 20 g), initial impedance, impedance drop, initial temperature, maximum temperature, and temperature rise on lesion size (damage depth, surface width, maximum damage width and damage volume).
Based on Johnson's AI formula (Ablation Index), we proposed further optimization. In addition to the original parameters of the AI formula (CF, P, t, AI), increased the input parameters to (contact force, power, time, initial impedance, impedance drop, initial temperature, maximum temperature, temperature rise), and changed the results of the Ablation Index to damage depth, surface width Maximum injury width and lesion volume [3]. The experimental equipment we prepared includes a radiofrequency ablation instrument.
(Shanghai Hongtong Co., Ltd.), a pressure pump, a constant temperature water bath, a 6-hole perfusion catheter (manufactured by Johnson and Johnson in the United States), a pressure gauge, a clamp frame, a cooking table, a cutting tool, a vernier caliper, and 4 fresh pig hearts (about 400 g/piece) that need to be cut horizontally to make the myocardial surface flat and maximize the myocardial surface area.
Firstly, we need to prepare experimental materials and prepare the hearts of four pigs for in vitro experiments (killed in the morning, fresh). Then, each pig heart is cut into circular slices along the horizontal direction to increase the myocardial area as much as possible for the convenience of the experiment. Then, it can be placed in a water tank to maintain a constant myocardial temperature of 37°C.
Figure 1 shows the required environment for the experiment. Insert the catheter into the control console, adjust the radiofrequency ablation device, simulate blood with 3 g/L saline solution in the water pump, maintain a constant temperature of 37°C in the water tank, take out a piece of myocardial tissue from the water tank and place it in the ablation water tank. Press the myocardial tissue tightly against the bottom of the pool with fingers to keep the ablation surface as flat as possible. Hold the simulated blood pump tube with hand and the electrode of the ablation catheter at a distance of 15 mm, Rotate the console to control the movement of the catheter up and down to control the pressure level. Use the pressure gauge above the catheter and the pressure reading on the radiofrequency ablation instrument to control the pressure value as much as possible to the desired value. In each experiment, the instrument needs to be set to zero [4]. After stabilizing the pressure reading, press the start button on the radiofrequency ablation instrument. After reaching the set ablation time, it will automatically stop. During this period, the instrument will display changes in sensor temperature, impedance, pressure, time, etc. The backend will record the corresponding contact force, power P, sensor temperature and time data at corresponding time intervals.

Figure 1: Animal in vitro experimental platform.
About the post-experimental processing, when the myocardium is taken out, the maximum surface width is measured first. Then, an incision is made along the maximum surface width to measure the maximum depth and width. The data exported from the background of the radiofrequency ablation instrument is organized for machine learning regression training, reflection on the experiment, error analysis and experimental improvement.
Dataset of algorithm
Based on the in vitro experiments of pig hearts, we obtained 111 sets of experimental data, which were divided into 5 power/time groups (40 W/10 s, 45 W/8 s, 50 W/6 s, 55 W/6 s, 60 W/6 s). Each power/time group was divided into 4 pressure groups (5 g, 10 g, 15 g, 20 g), and each pressure group underwent 5-6 ablations, resulting in 111 sets of experimental data. After sorting, we obtained 8 features including time, power, contact force, initial impedance, impedance drop, initial temperature, maximum temperature of the sensor, and temperature rise of the sensor, as well as 4 targets including surface width, damage depth, maximum width and ablation volume [5]. Divided into training sets and testing sets in an 8:2 ratio, which includes 89 training sets and 22 testing sets.
Backpropagation neural network
BP neural network, also known as error feedback neural network algorithm, is relatively mature and has strong nonlinear processing ability, adaptive ability and fault tolerance ability, suitable for solving complex nonlinear fitting problems. The application of BP neural network can approach any nonlinear function with arbitrary accuracy, greatly improving the prediction accuracy, so it is often used in prediction research. Structurally speaking, the BP neural network is composed of two modules: A forward propagation network for information and a back propagation network for error [6]. Figure 2 shows the basic structure of the BP neural network.

Figure 2: Structure diagram of backpropagation neural network.
From the structure of Figure 2, it can be seen that the BP neural network is mainly composed of three layers, including the input layer of the BP neural network, the hidden layer of the BP neural network and the output layer of the BP neural network. Various external information is transmitted through the input layer of the BP neural network to its hidden layer for network operation processing, and the final processing result is obtained through the output layer output [7]. When the error between the output layer output result of the BP neural network and its pre-set input value is large, it enters the backpropagation stage of the BP neural network and updates the network weight, until the error between the output result and the expected result meets certain conditions.
The number of hidden layer nodes is determined by the complexity of input and output variables, as shown in following equation (1).
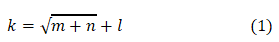
Where k is the number of nodes in the hidden layer, m is the number of nodes in the input layer, n is the number of nodes in the output layer and l is an integer with a value range of 1-10.
Input variable of the i-th neuron in the hidden layer of BP neural network ne, output variable yi can be expressed in the following equation (2).
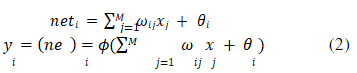
• The meaning of xj represents the input value of the j node in the
input layer of the BP network, where j=1,..., M.
• The meaning of ωij represents the neural network weight parameters
between the i-th node of the hidden layer of the BP network and the j
node of the input layer.
• The meaning of θi represents the threshold parameter of the i node i n
the hidden layer of the BP network.
• The meaning of (x) is the activation function of the hidden layer of
BP network.
The input variable of the k neuron in the output layer of a BP neural network netk, output variable ok can be expressed in the following equation (3).
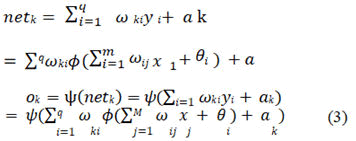
• The meaning of ωki represents the weight parameter between the k
node in the output layer of the BP neural network and the i node in
the hidden layer, i=1,.., q.
• The meaning of ak represents the threshold parameter of the k
node in the output layer of the BP neural network, k=1,..., L.
• The meaning of ψx )( represents the activation function of othuetput
layer of the BP neural network.
• The meaning of ok represents the output of the k node in the
output layer of the BP neural network.
Analysis of ablation lesion
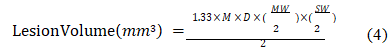
Measure the maximum Surface Width (SW) along the long axis of the target on the tissue surface using a vernier caliper [8]. Then, use a small knife to cut the ablated tissue along the long axis of the target, and measure the Maximum Width (MW) and damage Depth (D). Finally, use the formula to obtain the damage Volume (V).
Evaluation indicators of algorithms
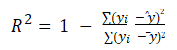
Coefficient of determination R2: The decision coefficient R2 is used to determine the quality of a regression model through changes in the dataset. For subtractors, the numerator represents the deviation between the actual value and the predicted value, while the denominator represents the degree of dispersion of the actual value from the mean. Dividing the two can eliminate the impact of the degree of dispersion of the actual value [9]. The range of determination coefficients is ranging from 0 to 1. The closer the determination coefficient is to 1, the better the regression model fits the dataset. Conversely, the closer the determination coefficient is to 0, the worse the regression model fits.
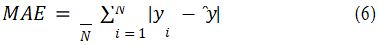
Mean absolute error
The average absolute error MAE of the given data is the absolute value of the difference between the actual value of the sample and the predicted value. The average absolute error can well reflect the actual situation of the prediction error. Generally, the smaller the value is, the better the fitting ability of the regression model will be.
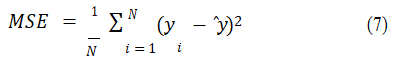
Mean square error
Mean square error, MSE, is a measure that reflects the degree of difference between the estimator and the estimated quantity. It is used to measure the deviation between the observed value and the true value. In summary, the smaller the value, the more accurate the machine learning network model is, and conversely, the worse it is.
Mean absolute percentage error
The Mean Absolute Percentage Error (MAPE) is a statistical indicator commonly used to measure the accuracy of prediction. Compared with the Mean Absolute Error (MAE), the denominator of the difference between the predicted value and the true value has an additional true value [10]. The range of average absolute percentage error ranges from 0 to positive infinity, and the closer the value is to 0, the more perfect the regression model is.
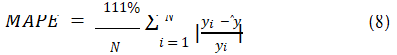
Where yi is the actual value of the sample, ŷ is a predicted estimate, y is the average value of the sample.
Results
The aim of this study is to use backpropagation algorithms to predict the size of myocardial lesions after radiofrequency ablation of the heart. In clinical surgery, the specific values of myocardial ablation cannot be quantified, so the lesion size of the ablation target and the reference parameters for quantitative ablation are obtained through pig heart in vitro experiments. In addition, replacing traditional formulas through neural networks is innovative in the field of cardiac ablation (Figure 3) [11].

Figure 3: Backpropagation design.
The power, ablation time, contact force, initial impedance, impedance drop, initial temperature, maximum temperature and temperature rise are taken as the eight input variables of the BP neural network model, and the surface width, maximum width, damage depth and damage volume are taken as the four output variables of the BP neural network model to establish the topological structure of the BP neural network. Among them, according to the number of input variables (power, ablation time, contact force, initial impedance, impedance drop, initial temperature, maximum temperature and temperature rise), the number of input layer nodes is determined to be 8. According to the number of output variables (surface width/ maximum width/damage depth/damage volume), choose any one to determine the number of output layer nodes as 1. According to the complexity of input and output variables, the hidden layer of the BP neural network is determined as 1 layer [12]. Referring to formula (1) and the results of parameter tuning training for the BP neural network, the number of hidden layer nodes is determined as 12.
Randomly divide the dataset into training and testing sets in an 8:2 ratio, and randomly disrupt the dataset. Randomly obtain 89 training sets and 22 test sets from the dataset. The number of input layer nodes is 8, which means 8 input parameters, the number of output layer nodes is 1, which means 1 output parameter, and the number of hidden layer nodes is 12. Afterwards, normalize the training sample data to from 0 to 1. The transfer functions of the hidden layer and output layer in the BP neural network are set to tansig function and purelin function by default, and the learning and training function of the BP neural network is set to trainlm function by default. In addition, the training times of BP neural network are set to 1000, the target error is set to 1e-6, and the Learning rate is set to 1e-3. Then conduct model training and simulation prediction, and then perform data normalization. Among them, for the training and testing of the BP neural network, it is necessary to repeatedly adjust parameters and update the network based on the results, ultimately achieving the best fitting and prediction accuracy of the BP neural network, and ultimately obtaining the best prediction effect of the BP neural network model and calculating evaluation indicators for the BP neural network [13].
Comparison between true and predicted values
Figures 4 and 5 show the comparison between the real and predicted values of the backpropagation algorithm model for the training and testing sets of lesion depth. After parameter tuning, the model was optimized on this dataset [14]. Whether it is the training set or the test set, the predicted values of the backpropagation algorithm model are basically consistent with the trend of the true values.

Figure 4: Comparison of real and predicted values on the training set of lesion depth.

Figure 5: Comparison of real and predicted values on the testing set of lesion depth.
Evaluation indicators of algorithm models
The four evaluation indicators calculated by the optimal BP neural network are shown in Table 1. The data set is divided into training set and test set. For the training set and test set, the four quantitative ablation indicators, namely, surface width, maximum width, damage depth and damage volume, are calculated for the four evaluation indicators, namely, Coefficient of determination R2, Mean absolute error MAE, average square error MSE and average absolute percentage error MAPE. Whether it is the training set or the dataset, the BP neural network has achieved good results and has good evaluation indicators on this batch of datasets. For this batch of data sets, the BP neural network has achieved a higher Coefficient of determination R2, which is greater than 0.8 in both the training set and the test set. The closer the coefficient of determination R2 is to 1, the stronger the fitting ability of the model and the closer the correlation between parameters.
| SW | MW | Depth | Volume | ||
|---|---|---|---|---|---|
| Training dataset | R2 | 0.87 | 0.85 | 0.86 | 0.9 |
| MAE | 0.15 | 0.16 | 0.07 | 2.39 | |
| MSE | 0.08 | 0.11 | 0.02 | 17.53 | |
| MAPE | 0.57 | 0.523 | 0.61 | 0.96 | |
| Testing dataset | R2 | 0.85 | 0.8 | 0.84 | 0.82 |
| MAE | 0.3 | 0.32 | 0.13 | 5.03 | |
| MSE | 0.13 | 0.21 | 0.03 | 41.61 | |
| MAPE | 1.65 | 1.4 | 1.25 | 2.09 |
Table 1: Evaluating indicator.
Therefore, the higher the coefficient of determination R2 represents the higher fitting ability of the data set, which proves that the correlation between ablation parameters and quantitative ablation indicators is strong. In addition, the BP neural network has achieved low Mean Absolute Error (MAE), average square error MSE and average absolute percentage error MAPE, which indicates that the predicted value made by the BP neural network has a small deviation from the actual true value, which also represents that the BP neural network has a strong regression fitting ability on this batch of data sets. In summary, the BP neural network can more accurately predict the quantitative ablation indicators of radiofrequency ablation damage. The high coefficient of determination R2 and the low Mean absolute error MAE, mean square error MSE and mean absolute percentage error MAPE all indicate that there is a strong correlation between the ablation parameters with input parameters of power, ablation time, Contact force, initial impedance, impedance drop, initial temperature, maximum temperature and temperature rise and the quantitative ablation indicators with output parameters of surface width, maximum width, damage depth and damage volume, This verifies the rationality and effectiveness of the initial design of the radiofrequency ablation scheme of the present invention. Using BP neural networks to establish new ablation parameters and mapping relationships between various quantitative ablation indicators, in order to achieve accurate prediction of radiofrequency ablation damage. This prediction method for quantitative ablation indicators of high-power short-term mode radiofrequency ablation damage is feasible and has advantages.
Discussion
The aim of this study is to identify more factors that affect the size of lesions at ablation targets, as well as the feasibility of using neural networks instead of traditional formulas. This study is based on highpower short-range experiments, using pig heart in vitro experiments to create datasets, and ultimately obtaining datasets for different power/ time/pressure groups. Backpropagation neural networks are used to perform regression tasks on this dataset. Compared to the traditional ablation formulas used by previous researchers, we propose a regression prediction model based on artificial intelligence machine learning algorithms [15]. We analyze the characteristics of power, contact pressure, ablation time, initial impedance, impedance drop, initial temperature, maximum temperature, and temperature rise measured by the electrode temperature sensor during high-power short-range ablation process. The above features are combined with surface width, maximum damage width and damage depth, respectively establish a machine learning model with lesion volume as the target.
Conclusion
Although all the correlations between features and targets have been obtained, there is still significant room for improvement in this study. This study did not determine the specific correlation between individual features and the target. For example, any five or six of the eight ablation features mentioned above were selected to analyze their correlation with the damage features. In addition, there is still significant room for improvement in the animal in vitro experiment process. We used a vernier caliper to measure the damage size on the ablated pig heart. As the damage size is in millimeter units, errors in measurement are inevitable, which also affects the final dataset, resulting in low fitting of the regression model. In addition, this study only analyzed 111 sets of experiments with a power of 40 W-60 W, contact pressure of 5 g-20 g, and time of 6 s, 8 s, and 10 s. Among them, the selection of parameters is relatively limited. In future research, more parameters can be selected for experiments to obtain more widely distributed data, making the results more universal.
References
- Chieng D, Sugumar H, Segan L, Al-Kaisey A, Moore BM, et al. (2022) High Power Short Duration (HPSD) versus Lower Power Longer Duration (LPLD) atrial fibrillation ablation: A multi-centre randomised controlled trial (HiLo-HEAT study). Eur Heart J 43: 849-827.
- Chen CF, Wu J, Jin CL, Liu MJ, Xu YZ. (2020) Comparison of high‐power short‐duration and low‐power long‐duration radiofrequency ablation for treating atrial fibrillation: Systematic review and meta‐analysis. Clinl Cardiol 43: 1631-1640.
[Crossref] [Google Scholar] [PubMed]
- Kirstein B, Vogler J, Eitel C, Phan L, Feher M, et al. (2022) Very high-power short-duration temperature-controlled ablation for cavotricuspid isthmus block: The fast-and-furious CTI study. Europace 24: 53-72.
- Leshem E, Zilberman I, Tschabrunn CM, Barkagan M, Contreras-Valdes FM, et al. (2018)High-power and short-duration ablation for pulmonary vein isolation: Biophysical characterization. JACC: Clinl Electrophysiol 4: 467-79.
[Crossref] [Google Scholar] [PubMed]
- de Bortoli A, Ole-Gunnar A, Torbjorn H (2022) Relationship between ablation index and myocardial biomarkers after radiofrequency catheter ablation for atrial fibrillation. Indian Pacing Electrophysiol J 22: 61-67.
[Crossref] [Google Scholar] [PubMed]
- Liu J, Xu D, Zhang W, Wu C (2021) Research on soil thermal conductivity prediction algorithm based on improved BP neural network. (WCMEIM) 316-319. IEEE.
- Masnok K, Watanabe N (2021) Role of Catheter contact force on biophysical properties of the ablation lesion formation in radiofrequency catheter cardiac ablation. Symposium 1-4.
- Willmott CJ, Matsuura K (2005) Advantages of the Mean Absolute Error (MAE) over the Root Mean Square Error (RMSE) in assessing average model performance. Clin Res 30: 79-82.
- Chai T, Draxler RR (2014) Root Mean Square Error (RMSE) or Mean Absolute Error (MAE)-Arguments against avoiding RMSE in the literature. Geosci Model Dev 7: 1247-1250.
- Chicco D, Warrens MJ, Jurman G (2021) The coefficient of determination R-squared is more informative than SMAPE, MAE, MAPE, MSE and RMSE in regression analysis evaluation. Peer J Comput Sci 7: 623.
[Crossref] [Google Scholar] [PubMed]
- Osborne JW (2000) Prediction in multiple regression. Pract Assess Res Eval 7: 2.
- Fernandez-Delgado M, Sirsat MS, Cernadas E, Alawadi S, Barro S, et al. (2019) An extensive experimental survey of regression methods. Neural Netw 111: 11-34.
[Crossref] [Google Scholar] [PubMed]
- Kwon D, Reddy RR, Reis IM (2021) ABCMETAapp: R shiny application for simulation‐based estimation of mean and standard deviation for meta‐analysis via approximate Bayesian computation. Res Synth Method 12: 842-848.
[Crossref] [Google Scholar] [PubMed]
- Jenkins DG, Quintana-Ascencio PF (2020) A solution to minimum sample size for regressions. PLOS One 15: 229345.
[Crossref] [Google Scholar] [PubMed]
- Chicco D, Jurman G (2022) The ABC recommendations for validation of supervised machine learning results in biomedical sciences. Front Big Data 5: 97.
[Crossref] [Google Scholar] [PubMed]