Research Article, J Biodivers Manage Forestry Vol: 6 Issue: 2
Satellite Image Mapping of Tree Mortality in the Sierra Nevada Region of California from 2013 to 2016
Christopher S Potter*
NASA Ames Research Centre, Mail Stop 232-21, Moffett Federal Airfield, California, USA
*Corresponding Author : Christopher S Potter
NASA Ames Research Centre, Mail Stop 232-21, Moffett Federal Airfield, California, USA
Tel: 650-604-6164
E-mail: chris.potter@nasa.gov
Received: April 14, 2016 Accepted: May 18, 2017 Published: May 24, 2017
Citation: Potter CS (2017) Satellite Image Mapping of Tree Mortality in the Sierra Nevada Region of California from 2013 to 2016. J Biodivers Manage Forestry 6:2. doi: 10.4172/2327-4417.1000176
Abstract
Extreme drought from 2013 to 2015 has been linked to extensive tree dieback in the Sierra-Nevada region of California. Landsat satellite imagery was analysed for the region from Lake Tahoe to the southern Sequoia National Forest with the objective of understanding the patterns of tree mortality in the years of 2013 to 2015 and into the near-normal precipitation year of 2016. The main mapping results for Landsat moisture index differences from year-to-year showed that the highest coverage of tree dieback was located in the Sierra and Sequoia National Forests, at four to five times greater area each year than within any other National Park or National Forest unit. Since 2013, over 50% of the Sierra Nevada forest dieback area was detected in the mid elevation zone of 1000-2000 m. The total area of tree mortality in the lower elevation zone of 500-1000 m did not grow notably from 2015 to 2016. Within the largest California river drainages in the Sierra region, new tree mortality in 2015 was detected mainly below 1200 m elevation,whereas new tree mortality in 2016 was detected mainly at higher elevations, up to about 2200 m. In three out of the four years studied, results showed that about 60% of all new tree mortality areas were located on north-facing hill slopes.
Keywords: Landsat; Forest; NDMI; Drought; Sierra Nevada; California
Introduction
Three consecutive years (2013 to 2015) of severe drought have stressed trees across the Sierra Nevada region of California, increasing susceptibility to lethal attacks by bark beetles (eg., Dendroctonus spp.) [1,2]. The scale of tree mortality in the region is far greater than has been previously observed [3]. Projections of future tree dieback across the western United States may lead to major transforms of ecosystem structure, tree species composition, loss of biodiversity, and increased wildfire risks [4].
In 2016, the United States Forest Service (USFS) reported on the results from aerial surveys that more than 102 million trees have died since 2010 in the central and southern Sierra of California [5]. The locations of dead and dying trees were recorded visually by a surveyor using a digital sketch-mapping system on a fixed-wing aircraft flying several hundred meters above ground level. An estimated 29 million trees across nearly 3 million acres (1.2 million ha) were estimated to have died in 2015 alone (USFS, 2015) [1,2]. These USFS surveys recorded 26 million new dead trees since October 2015.
Aerial surveys across the entire state of California (not only for the Sierra-Nevada) conducted the USFS during the extreme drought lasting from 2012 to 2015 were reviewed by Young et al. [6], who reported that mortality increased from tens to hundreds of dead trees per km2, rising dramatically during 2015. Mortality rates in California forests increased independently with average annual water deficits and with average basal area, and mortality rates increased disproportionately in areas that were both relatively dry and dense. Using airborne laser-guided spectroscopy, Asner et al. [7] reported that approximately 10.6 million ha of California forest land containing up to 888 million large trees experienced measurable loss in canopy water content during this drought period.
Satellite remote sensing has been shown to be an effective method to measure large-scale patterns of vegetation biomass and tree growth rates in remote mountain areas [8-16]. For mapping of drought impacts on forest stands, the Landsat normalized difference moisture index [17] has been validated in the field repeatedly as an index of vegetation canopy moisture status [18-20] including impacts of insect outbreaks on western conifer forests [21]. Ceccato et al. [22] tested an index similar to the NDMI using data from the SPOT satellite sensor and concluded that the SWIR channel was essential to estimating leaf water content and that the NIR channel was needed to account for variation of leaf internal structure and dry matter content variations. Potter and Van Gunst [23,24] showed that NDMI can be used to monitor and map year-to-year variations in drought stress across California forest and woodland ecosystems.
Potter [25] used Landsat imagery at over 90% of sites identified by USFS aerial surveys with complete tree mortality in the southern Sierra region to understand how the three consecutive years (2013- 2015) of extreme drought conditions compared to changes in forest stand growth rates dating to the mid-1980s across this region. Results showed that changes in Landsat NDMI from the years 2011 to 2015 closely matched patterns of tree mortality across USFS April 2015 aerial survey locations. The historically low snow year of 2015 essentially reset the average forest canopy density for many forests in the region to late 1980s levels, due to drought-related mortality, combined with numerous large stand-replacing wildfires.
The objective of the present study was to map areas of highest probable tree mortality for the years 2013 to 2016 using Landsat NDMI values at 30-m spatial resolution across a 21 million ha area from Lake Tahoe to the southern Sequoia National Forest. Landsat’s extensive regional coverage of forest stand conditions provides a rich historical archive within which to put the 2013-2015 drought into perspective, particularly with respect to the impacts of topographic variations on tree mortality and surviving canopy density.
Study area
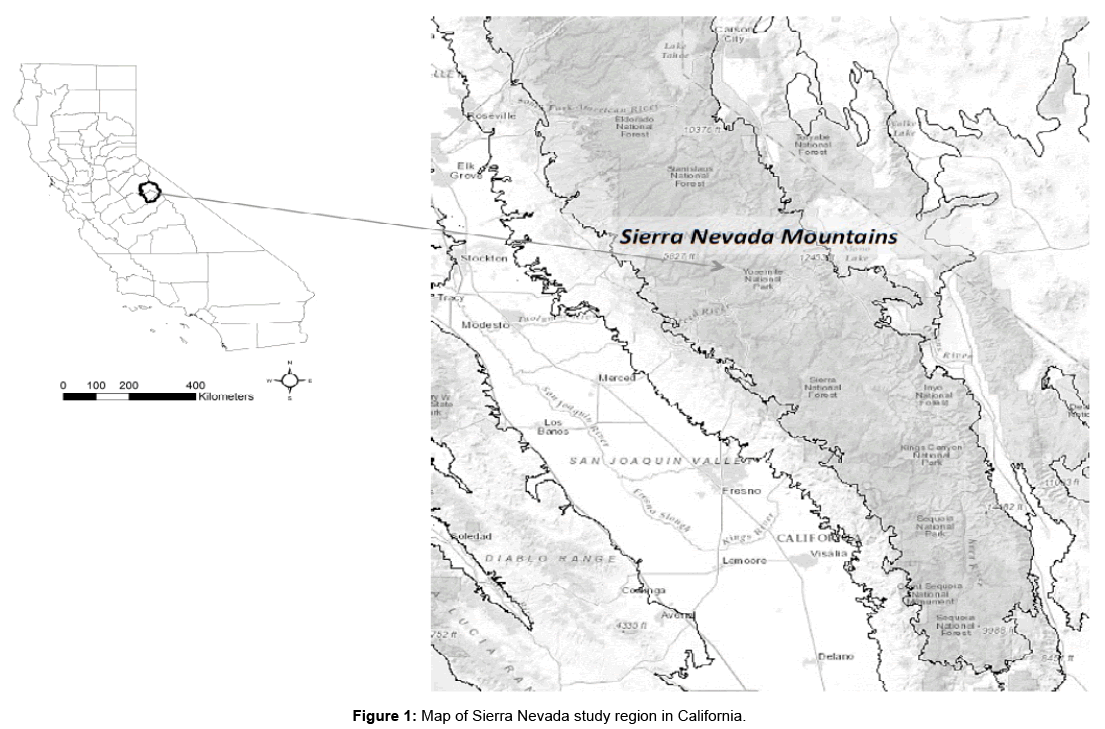
The Sierra Nevada region (Figure 1) covers over 63,000 km2 along a north-south axis of California. Rundel et al. [26] defined elevation zones in the Sierra-Nevada roughly as: montane (1500-2500 m), subalpine (2500 - 3000 m), and alpine (above 3000 m). Before human settlements in the mid-1800s, conifer forests throughout the region experienced wildfires mainly of low and moderate severity. Montane zone pine and mixed-conifer forests historically experienced mean fire return intervals of 11 to 16 years [27]. In higher elevation subalpine forests of the Sierra Nevada, the typical pre-settlement fire return intervals were between 35-100 years [28].
Among the most common tree species in the montane zone are ponderosa pine (Pinus ponderosa), Douglas fir (Pseudotsuga menziesii), white fir (Abies concolor), incense cedar (Calocedrus decurrens), black oak (Quercus kelloggii), and interior live oak (Quercus wislizeni). The most common tree species in the subalpine zone are whitebark pine (P albicaulis), lodgepole pine (P contorta subs murrayana), mountain hemlock (Tsuga mertensiana), western white pine (P monticola), red fir (Abies magnifica), Sierra juniper (Juniperus occidentalis var australis), Jeffrey pine (P jeffreyi), and white fir (Abies concolor) [26].
Average annual precipitation in the central Sierra ranges from 80 cm at lower elevations to more than 170 cm at higher elevations, with most precipitation falling during the winter as snow [29]. Peak annual snow water equivalents (SWE) levels range from 50 cm to 160 cm, depending on elevation and topography [30].
Methods
Satellite image processing
Near cloud-free imagery from the Landsat 8 sensor was selected from the U. S. Geological Survey Earth Explorer data portal for the year 2011 and every year from 2013 to 2016. Image data from Landsat path/rows 41/35, 42/34, 42/35, and 43/33 were acquired between July 15 and August 30 each year, around the peak of the Sierra summer growing season [30,31]. All images used in this study were geometrically registered (UTM Zone 11) using terrain correction algorithms (Level 1T) applied by the U. S. Geological Survey EROS Data Centre [32]. Landsat 8 surface reflectance products were generated from the L8SR algorithm [33] using a method that uses the scene centre for the sun angle calculation and then hard-codes the view zenith angle to 0. The solar zenith and view zenith angles are used for calculations as part of the atmospheric correction.
NDMI calculation
The severity of drought stress across the study region was determined using the Landsat NDMI [17], computed by the equation:
NDMI = (NIR – SWIR) / (NIR + SWIR)
where NIR is the near infrared (0.85 to 0.88 μm) band and SWIR is the short wave infrared (1.57 to 1.65 μm) band for the Landsat 8 sensor.
NDMI (scaled 0 to 10000) is comparable to the Landsat normalized burn ratio (NBR) used for wildfire severity mapping [34]. The reduction of reflectance of the SWIR as compared to the NIR is due to the absorption of water in leaf tissues [35]. Hais et al. [36] reported that NDMI for conifer canopies decreased as leaf cover is lost and SWIR band values increase with exposure of soils under the stressed trees. High NDMI values represent relatively high vegetation canopy moisture and lower drought stress, while near-zero values would represent relatively low vegetation canopy moisture content and higher drought stress [23]. Potter [25] reported that a negative change of at least 2000 NDMI between two image dates corresponded closely to sites identified by USFS aerial surveys with high tree mortality in the southern Sierra region.
Other data sets used
Elevation, slope, and aspect at 1 arc-second resolution were determined from the United States Geological Survey (USGS) National Elevation Dataset (NED). Wildfire boundaries and years since fire (YSF) were compiled from the California Department of Forestry, Fire and Resource Assessment Program, with additions from the National Park Service. River drainage basin boundaries were delineated by the U. S. Geological Survey [37] and downloaded from the National Hydrography Database.
Data analysis
Following on the validation of methodology by Potter [25] in closely matching forest stand mortality from aircraft surveys with Landsat imagery, each Landsat NDMI data layer from the years 2013 to 2016 was subtracted individually from the Landsat NDMI data layer for the year 2011, which was the most recent non-drought year in the region with above average annual precipitation and snow pack levels [30]. The NDMI differences between years greater than 2000 units were labeled as areas of highest probable tree mortality (Potter, 2016) [25] and saved for further spatial analysis. All areas burned by wildfires from the years 2013, 2014, and 2015 were masked out of the resulting dNDMI > 2000 map layers.
To generate the dNDMI layer for the year 2014, locations of dNDMI > 2000 from the 2013 layer were masked out to prevent double-counting areas of probable tree mortality. The same masking out of previous year’s dNDMI layers was performed for the 2015 and 2016 dNDMI layers, such that only new areas of probable tree mortality were included in these years post-2013.
Zonal statistics for the dNDMI>2000 layers from 2013 to 2016 were computed using river basin delineations, elevation zones, National Forest (NF) and National Park (NP) boundaries, and predominant aspect class (north or south) in the ArcGIS software extension. Areas of probable tree mortality were summed in units of hectares within each different topographic or administrative zone.
Results
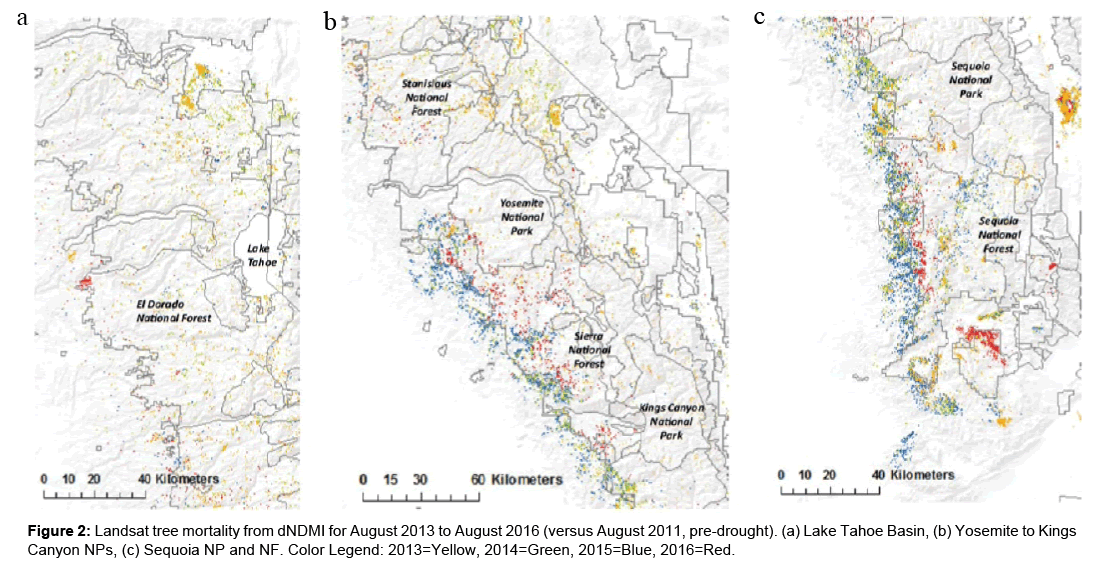
Yearly patterns of tree mortality were mapped (for ease of viewing) into three sections of the Sierra Nevada study region, namely the Lake Tahoe Basin, Yosemite to Kings Canyon NPs, and Sequoia NF and NP (Figure 2a-c). Most of the tree mortality detected by the dNDMI method in the Lake Tahoe section occurred in 2013 and 2014. In contrast, the areas to the west and south of Yosemite NP and Kings Canyon NP showed extensive new tree dieback locations in 2015 and 2016. This included the western sections of the Sierra NF. In Sequoia NP and NF in the southern Sierra range, tree mortality locations were abundant at the lower elevations below 2000 m during all years from 2013 to 2016.
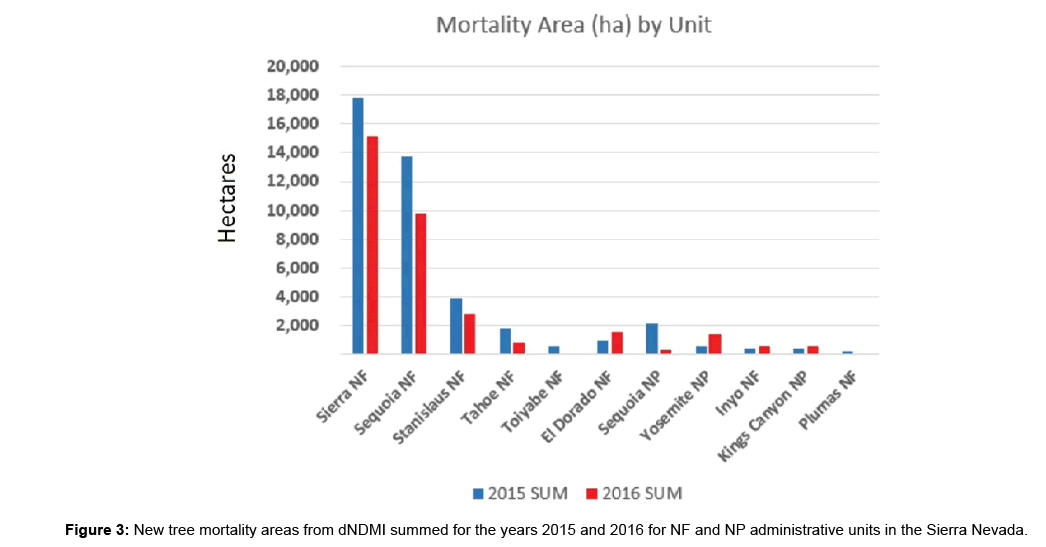
Areas of new tree mortality totaled by NF and NP administrative units for 2015 and 2016 showed that the highest coverage was in the Sierra and Sequoia NFs (Figure 3), at four to five times greater area than in the next highest unit, the Stanislaus NF. All three NPs, Yosemite, Kings Canyon, and Sequoia, each had less than 2000 ha of new tree mortality detected in either 2015 or 2016.
Areas totaled within major drainage basins showed that the Upper sections of the following California river basins, the San Joaquin, King, Kern, Merced, and Stanislaus, each with more than 20,000 ha of new tree mortality detected (Table 1). The San Joaquin, King, Stanislaus, and south fork of the Kern River basins all showed a ratio greater than 1.3 of 2016-to-2015 tree mortality area. The same pattern of increased tree mortality area in 2016 compared to 2015 was detected in the Truckee, Feather, Yuba and Tuolumne River drainages.
| River Basin | 2013 SUM |
2014 SUM |
2015 SUM |
2016 SUM |
Total | 2016: 2015 |
|---|---|---|---|---|---|---|
| (ha) | (ha) | (ha) | (ha) | (ha) | ||
| Upper San Joaquin | 5,810 | 9,186 | 11,234 | 14,599 | 40,829 | 1.30 |
| West Walker | 12,917 | 14,342 | 1,264 | 7,172 | 35,695 | 5.67 |
| Upper King | 5,144 | 10,765 | 7,382 | 10,693 | 33,984 | 1.45 |
| Upper Carson | 13,354 | 14,565 | 1,542 | 5,773 | 35,234 | 3.74 |
| Owens Lake | 8,873 | 9,679 | 1,327 | 10,644 | 30,524 | 8.02 |
| Upper Kaweah | 5,695 | 12,877 | 7,717 | 1,918 | 28,207 | 0.25 |
| Upper Kern | 7,464 | 9,666 | 6,658 | 3,433 | 27,221 | 0.52 |
| Middle Kern | 8,246 | 8,205 | 8,664 | 891 | 26,006 | 0.10 |
| Upper Merced | 3,248 | 6,628 | 7,576 | 6,980 | 24,431 | 0.92 |
| Upper Stanislaus | 7,681 | 7,891 | 867 | 6,076 | 22,515 | 7.01 |
| South Fork Kern | 4,550 | 5,269 | 1,973 | 9,474 | 21,266 | 4.80 |
| Upper Tule | 2,386 | 8,121 | 8,035 | 2,722 | 21,264 | 0.34 |
| East Walker | 7,254 | 10,037 | 498 | 3,827 | 21,616 | 7.68 |
| Truckee | 5,795 | 10,270 | 1,614 | 3,555 | 21,234 | 2.20 |
| Middle Fork Feather | 4,975 | 9,168 | 994 | 2,292 | 17,429 | 2.31 |
| Crowley Lake | 4,759 | 5,952 | 1,201 | 4,327 | 16,239 | 3.60 |
| Walker | 3,907 | 5,027 | 1,420 | 5,010 | 15,364 | 3.53 |
| Middle San Joaquin | 298 | 2,255 | 7,490 | 4,006 | 14,050 | 0.53 |
| Upper Deer-Upper White | 1,311 | 3,885 | 5,964 | 1,733 | 12,892 | 0.29 |
| Upper Poso | 1,194 | 2,795 | 6,685 | 1,307 | 11,982 | 0.20 |
| Upper Mokelumne | 3,543 | 3,847 | 866 | 3,718 | 11,974 | 4.29 |
| North Fork American | 2,922 | 3,975 | 489 | 3,717 | 11,104 | 7.60 |
| South Fork American | 2,825 | 3,775 | 539 | 2,721 | 9,859 | 5.05 |
| Upper Yuba | 2,879 | 4,008 | 706 | 2,143 | 9,736 | 3.03 |
| Upper Tuolumne | 3,026 | 2,966 | 481 | 2,930 | 9,402 | 6.10 |
| Mono Lake | 2,586 | 3,053 | 201 | 2,645 | 8,485 | 13.14 |
| Tulare Lake Bed | 927 | 2,829 | 2,428 | 1,121 | 7,305 | 0.46 |
| Fresno River | 417 | 1,332 | 3,538 | 1,696 | 6,983 | 0.48 |
| Lake Tahoe | 2,184 | 2,566 | 494 | 1,643 | 6,888 | 3.32 |
Table 1: Annual area of new tree mortality totaled over major river basin detected boundaries using Landsat dNMDI methodology for Sierra Nevada study region.
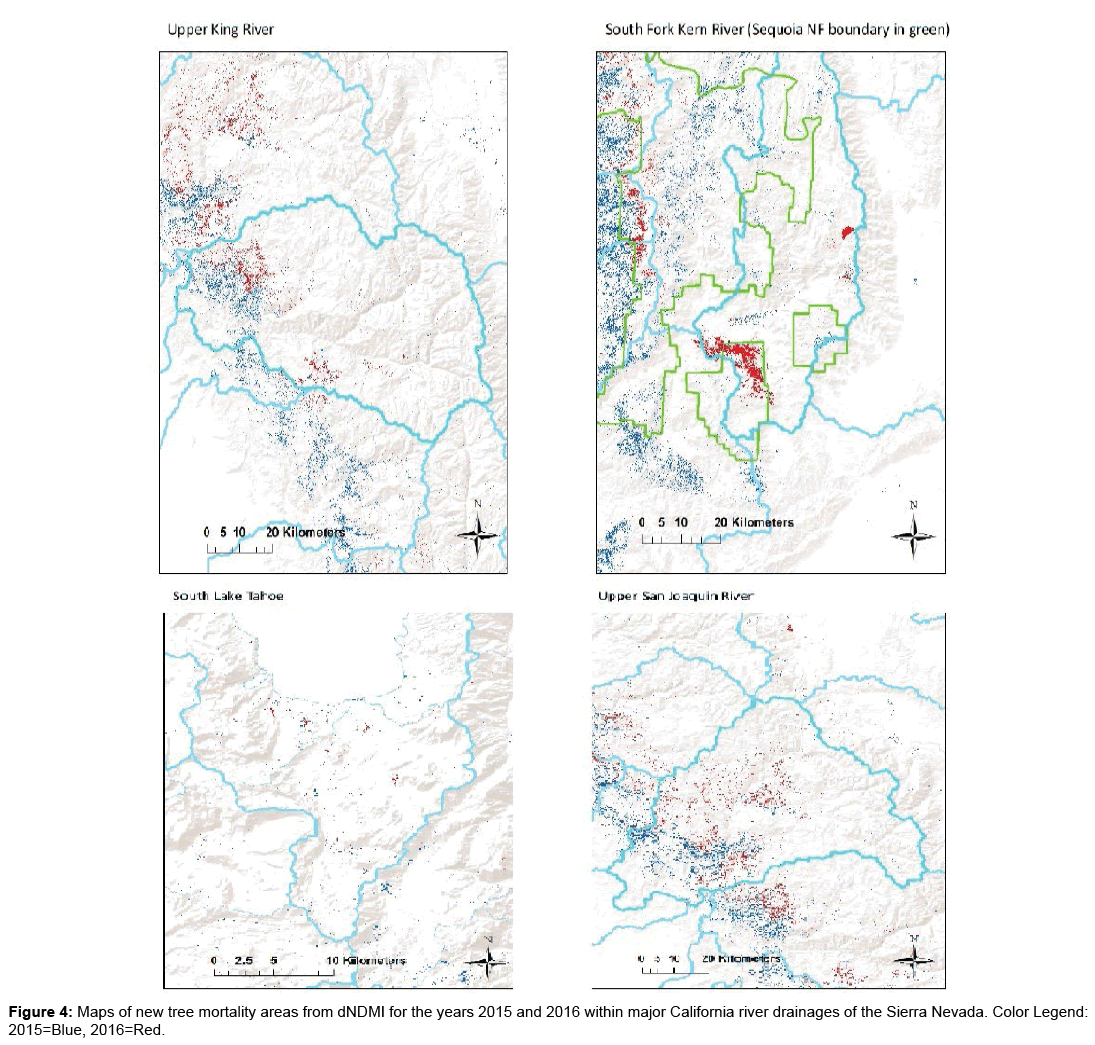
More detailed views of new tree mortality patterns in both 2015 and 2016 within four major California river basins were mapped in Figure 4. In the Lake Tahoe basin, three times more tree dieback was detected in 2016 compared to 2015. In one of the largest drainages in the Sierra region, the Upper San Joaquin in the Sierra NF, new tree mortality in 2015 was detected mainly below 1200 m elevation, whereas new tree mortality in 2016 was detected mainly at higher elevations up to 2200 m. The Upper King River drainage just south of the Upper San Joaquin basin showed the same kind of shift in tree mortality patterns from lower to higher elevations from 2015 to 2016. In the South Fork of the Kern River draining much of the Sequoia NF, nearly five times more tree dieback was detected in 2016 compared to 2015. Portions of the Upper Deer, Poso, and Kelso Creek sub-basins were heavily impacted in 2016 by tree dieback largely above 1500 m.
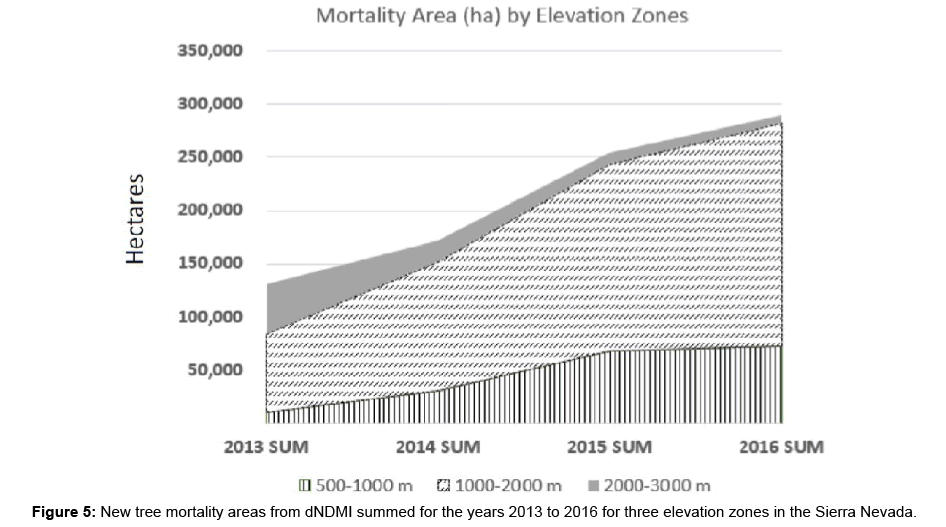
Across the entire Sierra Nevada study region, changes from year-to-year in three elevation zones (Figure 5) showed that new tree mortality increased steadily from 2013 to 2015 in the lower zone (500-1000 m) to just over 68,000 ha then added only about 3,500 ha in 2016. In the mid elevation zone (>1000-2000 m), which made up over 50% of the total Sierra Nevada forest dieback area since 2013, new tree mortality increased steadily from 2013 to 2016 to over 210,000 ha. In the high elevation zone (>2000-3000 m), which made up 22% of the total Sierra Nevada forest dieback area since 2013, new tree mortality was highest in 2013 and increased at consistent lower rates from 2014 to 2016 to nearly 84,000 ha.
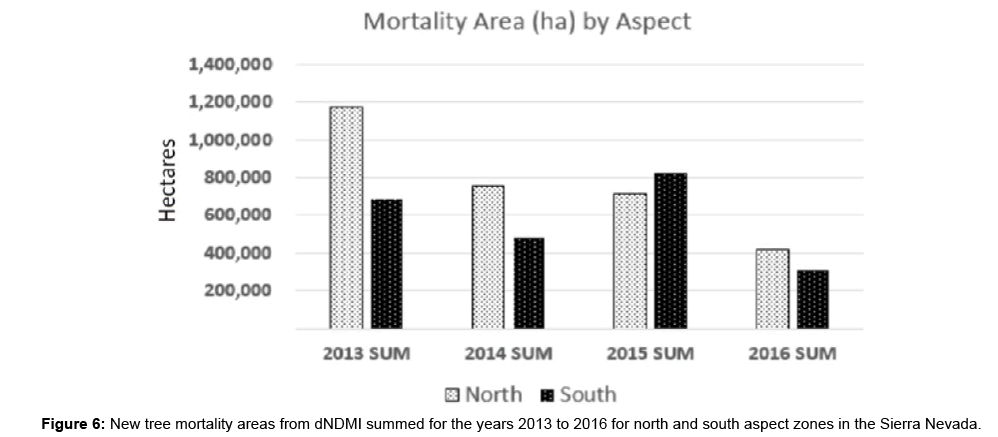
The influence of topography was further examined across the entire Sierra Nevada study region by dividing areas of tree mortality area each year into north- and south-facing aspects. Results showed that about 60% of all new tree mortality areas were located on northfacing hill slopes in 2013, 2014 and 2016 (Figure 6). In 2015, the proportion of all new tree mortality areas on south-facing slopes was 53%, which represented an exception to the overall predominance of tree dieback on north-facing slopes.
Discussion
Results from this study of changes in Landsat drought-sensitive indices from 2011 to 2016 in the Sierra Nevada region indicated that the highest coverage of tree dieback was located in the Sierra and Sequoia NFs at four to five times greater area than any other NP or NF unit. The mid elevation zone (>1000-2000 m) made up over 50% of the total Sierra forest dieback area since 2013. In three out of the four years studied, results showed that about 60% of all new tree mortality areas were located on north-facing hill slopes.
The most likely forces driving insect-associated tree mortality in the Sierra Nevada have been high stand densities that resulted from previous fire suppression, along with trends of drier, hotter climate conditions [24,38]. The calendar year 2013 was the driest on record in California, with a total of just 30% of average statewide precipitation [39]. A record low snowpack level in 2015 in the Sierra Nevada region was unprecedented in comparison to the past 500 years [40], with SWE levels measured across the Sierra region of only 5% of the historical average. In 2016, snowpack levels and water content returned to nearly long-term average levels (since 1961) in the central and southern Sierra Nevada [41].
In Sequoia NF, the southern-most NF in the Sierra Nevada range, drought impacts are commonly observed before such effects emerge in forests further north [1,2]. Notable levels of tree mortality in Sequoia NF have been observed since the drought period of 2007. Sugar pines (Pinus lambertiana) in all size classes have died back, as individuals or in groups of 5-10 trees consisting of mature trees greater than 15 inches diameter, due to infection from white pine blister rust (Cronartium ribicola) and western pine beetle (Dendroctonus brevicomis). Losses of trees have ranged from 5 to 100 per acre, particularly in ponderosa pines, sugar pines, and incense cedars.
Extensive mortality in incense cedar could be attributable to a combination of drought and bark beetle attack. All size classes of incense cedar are observed to be dying in Sequoia NF [1,2]. White fir dieback is often observed on drier sites and overstocked stands, with true leafy mistletoe, fir engravers, woodborers, and dwarf mistletoe (Arceuthobium spp.) infection commonly found in dying trees [1,2,42].
Several previous studies of the controllers of tree mortality in the Sierra Nevada Mountains support the high density-warming-drying mechanism of insect-induced stand dieback. For instance, Guarin and Taylor [43] surveyed old-growth mixed conifer forests in Yosemite National Park to determine the influence of drought and topography on recent patterns of tree mortality. They found that more trees died in years with below normal snowpack. Correlations between tree mortality and drought were evident only for 2–5 year periods. The density of dead trees was higher on north than south slopes. With fire exclusion over past decades, the white fir and incense cedardominated forests on relatively moist north-facing slopes in Yosemite increased more in density than on dry Ponderosa pine-dominated south-facing slopes. This pattern suggested that competition between trees on north-facing slopes was probably more intense and this has led to higher dead tree density on north-facing slopes during periods of drought. On all sites, for all species, dead trees were more frequent in small and intermediate (5– 45 cm diameter) than large (>45 cm diameter) size classes. It must be noted however that the observation of higher frequency of tree death on north-facing slopes is elevation zone–dependent and that aspect can alter what might be the effective elevation effect of a given location.
Smith et al. [44] surveyed trees in the southern Sierra National Forest and reported that pathogen- and insect-associated mortality was significantly greater in areas of high stand density. Tree mortality was higher than expected for large-diameter trees, suggesting an acceleration of old-tree mortality under current fire suppression conditions.
Following up on this evidence, Dolanc et al. [45] suggested that the decrease in density of large trees in Sierra Nevada subalpine zone over the past 75 years has been consistent with observed changes in climate. Higher temperatures may have shortened the time to drought-induced mortality of trees and can increase the susceptibility of conifers to insect attack [29,38].
Along similar lines, Mantgem and Stephenson [46] analysed a data base of over 21,000 trees in a network of old-growth forest plots in the Sierra Nevada and reported that the tree mortality rate had increased significantly over the 22 years of measurement (1983- 2004). Mortality rates increased in both of two dominant taxonomic groups (fir and pine) in the lower elevation zones 1500-2300 m. The increase in overall mortality rate coincided with both an increase in biotic agent (insect and pathogen) damage and a temperature-driven increase in an index of drought, the annual climatic water deficit.
In the central Sierra, Van Gunst et al. [24] analysed changes in Landsat vegetation indices from 1985 to 2009, including shifts in the NDMI, across the Lake Tahoe Basin and reported mortality associated more with lower elevation forests (white fir dominated below 2200 m) and drier climate periods, measured by the snow water departure from the 30-year norm. They found increased risk of tree mortality on north-facing slopes across all forests and all climate periods and attributed this pattern to a more limited capability of tree stands on north-facing slopes to adapt to increased moisture stress during periods of drought and increased temperatures.
Large forested river drainages in the southern Sierra, such as the Upper King River that drains much of the Sierra National Forest area, have been the subject of conflicting predictions of present and future forest expansion and associated vegetation water use. Specifically, Goulden and Bales [47] speculated that loss of soil water to evapotranspiration (ET) by dense, rapidly growing sub-alpine forests in the Upper King basin will be accelerated by future climate warming. They predicted that by the year 2100, climate changeinduced forest expansion would increase average basin-wide ET by 28% and decrease water flow downstream in the Kings River by 26% in the basin. In contrast, Potter [25] analysed more than 20 years (from 1986 to 2013) of Landsat images for the Upper King River basin and found that changes in vegetation density over time have been strongly dependent on elevation, annual precipitation, and years since fire. The Landsat green cover index increased significantly only at elevations lower than 2500 m in a comparison of consistently dry periods, and forest cover density more frequently decreased (rather than increased) at locations above 1500 m elevation in comparison of consistently wet periods.
Although fewer live trees in the area might result in more runoff water being delivered into the lower watershed, the trade-off is that less live forest cover may result in increased soil erosion and an increased potential for land sliding all of which can negatively affect river water quality. An increase in soil erosion could impact water storage and hydro-electric power facilities downstream.
Since 2013, the Upper King, Kern, and Merced River basins have experienced some of the most extensive dieback of trees in the Sierra region (rather than an expansion in leaf area and stand density). Hence, it can be hypothesized that periodic drought from consecutive below-average precipitation years has been and will be the primary factor controlling low soil moisture availability and changes in water flows downstream in the large river basins of the southern Sierra in the decades to come.
Conclusions
According to Landsat image mapping, the regional patterns of forest dieback over the period 2013 to 2016 in the southern Sierra Nevada have resulted from a combination of progressive regional warming and historically low annual snow accumulation amounts. The higher numbers of dead trees on north-facing slopes might be explained by increased competition among stands of white fir and incense cedar for scarce soil moisture, although more research is necessary to confirm that conclusion. Analysis of Landsat image data in subsequent years may assist forest managers in the assessment of delayed tree mortality post-2016, and in tracking subsequent regrowth rates of drought-affected forest stands during more favourable precipitation years.
References
- United States Forest Service (USFS) (2015) High Levels of Tree Mortality in Drought Stricken Forests in California. USFS Report: fseprd515497.
- United States Forest Service (USFS) (2015) Situation Summary of recent tree mortality on Sequoia National Forest. Forest Health Projection, South Sierra Shared Service Area Report SS15-005.
- Moore J, Heath Z, Bulaon B (2015) Aerial Detection Survey- April 15th-17th, 2015, 20. Forest Health Protection Survey, United States Forest Service.
- Anderegg WRL, Flint A, Huang C, Flint L, Berry JA, et al. (2015) Tree mortality predicted from drought-induced vascular damage. Nature Geoscience 8: 367-371.
- United States Forest Service (USFS) (2016) New Aerial Survey Identifies More Than 100 Million Dead Trees in California, Media Release No. 0246.16, Office of Communications, Washington, DC.
- Young DJ, Stevens JT, Earles JM, Moore J, Ellis A, et al. (2017) Long-term climate and competition explain forest mortality patterns under extreme drought. Ecology Letters 20: 78-86.
- Asner GP, Brodrick PG, Anderson CB, Vaughn N, Knapp DE, et al. (2015) Progressive forest canopy water loss during the 2012-2015 California drought. National Academy of Sciences 113: E249-E255.
- Collins JB, Woodcock CE (1996) An assessment of several linear change detection techniques for mapping forest mortality using multitemporal Landsat TM data. Remote Sensing of the Environment, 56: 66-77.
- Amiro BD, Chen JM, Liu J (2000) Net primary productivity following forest fire for Canadian ecoregions. Canadian Journal of Forest Research 30: 939-947.
- Rogan J, Franklin J (2001) Mapping wildfire burn severity in southern California forests and shrublands using Enhanced Thematic Mapper imagery. Geocarto International 16: 89-99.
- Rogan J, Miller J, Stow DA, Franklin J, Levien L, et al. (2003) Land-cover change monitoring with classification trees Using Landsat TM and ancillary data. Photogrammetric Engineering and Remote Sensing 69: 793-804.
- Fischer L, Rosenberg M, Mahon L, Liu Z, Maurizi B, et al. (2004) Monitoring land cover changes in California, a USFS and CDF cooperative program, Northern Sierra Project Area - Cycle II. State of California, Resources Agency, Department of Forestry and Fire Protection, Sacramento, USA.
- Epting J, Verbyla DL (2005) Landscape level interactions of pre-fire vegetation, burn severity, and post-fire vegetation over a 16-year period in interior Alaska. Canadian Journal of Forest Research 35: 1367-1377.
- Cuevas-Gonzalez M, Gerard F, Balzter H, Riano D (2009) Analysing forest recovery after wildfire disturbance in boreal Siberia using remotely sensed vegetation indices. Global Change Biology 15: 561-577.
- Casady GM, Marsh SE (2010) Broad-scale environmental conditions responsible for post-fire vegetation dynamics. Remote Sensing 2: 2643-2664.
- Li S, Potter C (2012) Vegetation regrowth trends in post forest fire ecosystems across North America from 2000 to 2010. Natural Science 4: 755-770.
- Gao BC (1996) NDWI - A normalized difference water index for remote sensing of vegetation liquid water from space. Remote Sensing of Environment 58: 257-266.
- Hunt ER, Rock BN (1989) Detection of changes in leaf water content using near and middle-infrared reflectances. Remote Sensing of Environment 30: 43-54.
- Chuvieco E, Riano D, Aguado I, Cocero D (2002) Estimation of fuel moisture content from multitemporal analysis of Landsat Thematic Mapper reflectance data: application in fire danger assessment. International Journal of Remote Sensing 23: 2145-2162.
- Dennison PE, Roberts DA, Peterson SH, Rechel J (2005) Use of normalized difference water index for monitoring live fuel moisture. International Journal of Remote Sensing 26: 1035-1042.
- Goodwin NR, Coops NC, Wulder MA, Gillanders S, Schroeder TA, et al. (2008) Estimation of insect dynamics using a temporal sequence of Landsat data. Remote Sensing of Environment 112: 3680-3689.
- Ceccato P, Flasse S, Gregoire J (2002) Designing a spectral index to estimate vegetation water content from remote sensing data: Part 2. Validation and applications. Remote Sensing of Environment 82: 198-207.
- Potter C (2015) Assessment ecosystems of the California 129-145 of the immediate impacts of the 2013-2014 drought on Central Coast. Western North American Naturalist 75: 129-145.
- Van Gunst KJ, Weisberg PJ, Yang J, Fan Y (2015) Do denser forests have greater risk of tree mortality: A remote sensing analysis of density-dependent forest mortality. Forest Ecology and Management 359: 19-32.
- Potter CS (2016) Landsat image analysis of tree mortality in the southern Sierra Nevada region of California during the 2013-2015 drought. Journal of Earth Science & Climatic Change 7: 342-350.
- Rundel PW, Parsons DJ, Gordon DT (1977) Montane and subalpine vegetation of the Sierra Nevada and Cascade Ranges. J Terrestrial vegetation of California 559-599.
- Miller JD, Safford H (2012) Trends in wildfire severity: 1984 to 2010 in the Sierra Nevada, Modoc Plateau, and southern Cascades, California, USA. Fire Ecology 8: 41-57.
- Safford HD, van de Water K, Schmidt D (2011) California Fire Return Interval Departure (FRID) map, 2010 version. USDA Forest Service, Pacific Southwest Region and The Nature Conservancy-California.
- Lutz JA, van Wagtendonk JW, Franklin JF (2009) Twentieth-century decline of large-diameter trees in Yosemite National Park, California, USA. Forest Ecology and Management 257: 2296-2307.
- Trujillo E, Molotch NP, Goulden ML, Kelly AE, Bales RC (2012) Elevation-dependent influence of snow accumulation. Nature Geoscience 5: 705-709.
- Wagtendonk JW, Root RR (2003) The use of multi-temporal Landsat Normalized Difference Vegetation Index (NDVI) data for mapping fuel models in Yosemite National Park, USA. International Journal of Remote Sensing 24: 1639-1651.
- Chander G, Markham B, Helder D (2009) Summary of current radiometric calibration coefficients for Landsat MSS, TM, ETM+, and EO-1 ALI sensors. Remote Sensing of the Environment 113: 893-903.
- Masek JG, Vermote EF, Saleous N, Wolfe R, Hall FG, et al. (2006) A Landsat surface reflectance data set for North America, 1990-2000. Geoscience and Remote Sensing Letters 3: 68-72.
- Miller JD, Yool SR (2002) Mapping forest post-fire canopy consumption in several overstory types using multi-temporal Landsat TM and ETM data. Remote Sensing of Environment 82: 481-496.
- Lozano FJ, Suárez-Seoane S, de LuisE (2007) Assessment of several spectral indices derived from multi-temporal Landsat data for fire occurrence probability modelling. Remote Sensing of Environment 107: 533-544.
- Hais M, Jonášová M, Langhammer J, KuÄÂÂera T (2009) Comparison of two types of forest disturbance using multi-temporal Landsat TM/ETM+ imagery and field vegetation data. Remote Sensing of Environment 113: 835-845.
- Seaber PR, Kapinos FP, Knapp GL (1987) Hydrologic Unit Maps, U. S. Geological Survey Water Supply Paper 2294.
- Allen CD, Macalady AK, Chenchouni H, Bachelet D, McDowell N, et al. (2010) A global overview of drought and heat-induced tree mortality reveals emerging climate change risk for forests. Forest Ecology and Management 259: 660-684.
- Hanak E, Mount J, Chappelle C (2014) California’s Latest Drought. Public Policy Institute of California, February 2014.
- Belmecheri S, Babst F, Wahl E, Stahle D, Trouet V (2015) Multi-century evaluation of Sierra Nevada snowpack. Nature Climate Change 6: 2-3.
- Redmond KT (2016) Drought Webinar California - Nevada Applications Program. Western Regional Climate Center, Desert Research Institute, Reno Nevada, 24 August 2016.
- Walker RF, Swim SL, Fecko RM, Johnson DW, Miller WW (2015) Bark beetle demography in Sierra Nevada mixed conifer: Variability and Influencing Factors. Forest Research 4: 147.
- Guarin A, Taylor AH (2005) Drought triggered tree mortality in mixed conifer forests in Yosemite National Park, California, USA. Forest Ecology and Management 218: 229-244.
- Smith TF, Rizzo DM, North M (2005) Patterns of mortality in an old-growth mixed-conifer forest of the southern Sierra Nevada, California. Forest Science 51: 266-275.
- Dolanc CR, Thorne JH, Safford HD (2013) Widespread shifts in the demographic structure of subalpine forests in the Sierra Nevada, California, 1934 to 2007. Global Ecol Biogeogr 22: 264-276.
- Mantgem PJ, NL Stephenson (2007) Apparent climatically induced increase of tree mortality rates in a temperate forest. Ecology Letters 10: 909-916.
- Goulden M L, Bales RC (2014) Mountain runoff vulnerability to increased evapotranspiration with vegetation expansion. Proc Natl Acad Sci 111: 14071-14075.
 Spanish
  Chinese
  Russian
  German
  French
  Japanese
  Portuguese
  Hindi
Hindi 