Research Article, Int J Cardiovasc Res Vol: 7 Issue: 1
Statistical Methods of ECG Signal Processing in Diagnostics of Coronary Artery Disease
Alekseev Mikhail1* and Alekseev Aleksandr2
1Diagnostic Center Juventa, Saint-Petersburg, Russia and Alekseev Alekseev Siegle Roder GbR, Munich, Germany.
2Tozca Diagnostics, Moskau, Russia and Alekseev Alekseev Siegle Roder GbR, Munich, Germany
*Corresponding Author : Alekseev Mikhail
Saint-Petersburg, Mejevaya Street 42, 197755, Russia
Tel: +78124348576, +79219137188
E-mail: Alex-skorost@mail.ru
Received: November 27, 2017 Accepted: January 22, 2018 Published: January 29, 2018
Citation: Alekseev M, Alekseev A (2018) Statistical Methods of ECG Signal Processing in Diagnostics of Coronary Artery Disease. Int J Cardiovasc Res 7:1.. doi: 10.4172/2324-8602.1000339
Abstract
Objective: Coronary artery disease results in higher morbidity, mortality, and medical costs than any other illness in the developed world. The improvement of coronary artery disease non-invasive detection is still actual problem. The aim of this study was to increase the quality of non-invasive diagnostics of coronary artery disease with statistical technology of ECG signal processing for quantitative assessment the degree of myocardial ischemia and the coronary artery lesion.
Methods and Results: The four minutes 12-channel electrocardiogram was used for the statistical technology of ECG signal processing to gain 200 PQRST complexes. It allowed calculating L criterion from relation of standard deviation to average value of 200 T-wave times and G-criterion the from relation of standard deviation to average value of 200 T-wave amplitudes in all 12 channels. The L and G criteria were compared by relation the maximum value in one channel to minimum value in another channel to get the second order L and G criteria. 139 patients with suspected coronary artery disease underwent elective coronary angiography and were examined by G and L criteria. Among patients with coronary angiography the values of second order L-criterion had a strong positive correlation with the value of coronary artery lesion (correlation factor r = +0.894). The values of G-criterion quantitatively reflect the severity of clinical presentation and confirm the functional classes.
Conclusions: The offered statistical technology of quantitative assessment of electrocardiographic curve parameters allows indirectly assessing the coronary blood flow and the degree of ischemic process regardless the presence of risk factors and clinical presentation. The localization of maximum ischemic process according the appropriate leads can help in selection of stent implantation priority.
Keywords: Coronary artery disease; DACG; T-wave; Electrocardiography; Statistical criterion; Myocardial infarction; Percutaneous coronary intervention
Introduction
Coronary artery disease (CAD) results in higher morbidity, mortality, and medical costs than any other illness in the developed world. Though it may affect individuals at any age, it is dramatically more common at progressively older ages, with approximately tripling of its risk with each decade of life. The Canadian Cardiovascular Society grading of angina pectoris allows for quantitative and nearly precise assessment of the severity of angina pectoris. The limitation of this classification is the subjectivity of a patient’s complaints, which depend on the individual’s sensitivity. Approximately 75% of ST segment abnormalities of ischemia during Holter monitoring in patients with angiographically proved coronary artery disease (CAD) and chronic angina are asymptomatic [1,2]. It is estimated that the number of patients with angina who also have asymptomatic episodes of myocardial ischemia is large, but the exact percentage is unknown. On the basis of data from the Atherosclerosis Risk in Communities study of the National Heart, Lung and Blood Institute, it was demonstrated that approximately 21% of the 750,000 first and recurrent episodes of myocardial ischemia (MI) were silent [3].
The central dogma of understanding the pathophysiology of myocardial ischemia is the concept of myocardial supply and demand. By reducing the size of the lumen of the coronary arteries, atherosclerosis limits appropriate increases in perfusion in response to augmented demands of vascular supply. The location of coronary artery stenosis or obstruction influences the quantity of myocardium that is rendered ischemic and the severity of the clinical manifestations. On the other hand, serial angiographic studies demonstrate that a majority of myocardial infarctions occur due to occlusion of arteries that previously did not contain angiographically significant (>50%) stenosis [4-7]. However, some studies suggest that the majority of acute coronary events including ST-segment elevated myocardial infarction (STEMI) and non-ST-segment elevation acute coronary disease (ACS) occur at the site of severe rather than mild coronary stenosis [8-16]. Furthermore, asymptomatic patients also can have different coronary artery lesions.
Coronary angiograms are important in the diagnostic workup of patients with suspected coronary artery disease. The limitation of diagnostic coronary angiography is its static character; this diagnostic method represents the coronary lumen at a single instance of time. The development of AMI is a pathophysiological process that develops over time and can be the result of different coronary artery lesions. Nearly 50% of patients have unstable angina (UA) before AMI and the diagnosis of UA is based largely on the clinical presentation. UA is defined as angina pectoris or equivalent ischemic discomfort; hence, the assessment of this status is based on the patient’s subjective perception. However, little is known about the clinical predictors of normal and abnormal angiograms, and whether the aforementioned rate varies across different cardiac centers.
In a large-scale American College of Cardiology National Cardiovascular Data Registry, only 38% of patients without known heart disease who underwent elective invasive angiography had obstructive coronary artery disease. No coronary artery disease, defined as <20% stenosis in all vessels, was reported in 39.2% of the patients [17]. Current strategies used to make decisions regarding invasive angiography, including clinical assessment of risk and noninvasive testing, need to be improved substantially to increase the diagnostic yield of cardiac catheterization in routine clinical practice. It is also necessary to assess the presence of coronary artery stenosis in out-of-hospital care scenarios or the emergency department to accelerate the processes of differential diagnostics in patients with chest pain or discomfort to appreciably reduce the time from onset of symptoms to medical care. To solve the difficulties associated with identification of the precise time of development of acute myocardial infarction, it is necessary to have non-invasive diagnostic methods of assessing the statuses of coronary arteries with least possible errors in measurement. Furthermore, we need a system that can allow the monitoring of coronary artery lesions and the severity of ischemia for a few hours or a few times a day, as it can give us the precise time of possible acute myocardial infarction and the time to prevent it. This paper is about these questions and their solutions.
Methods
We used the technology Digital Analytic Cardiography (DACG) [18] which is based on in-depth analyses of temporal and amplitude parameters of well-known electrocardiography (ECG) parameters. The 12-channel usual electrocardiograph (Amedtec CardioPart) in rhythm mode was used for this goal. The fundamental differences between DACG technology and regular ECG are as follows:
The resolution of analog to digital converter of ECG device was less than 50 microseconds in time and less than 5, 0 microvolts in amplitude measurements.
The duration of recording should be at least 4 minutes for the measuring of ECG parameters to have statistically significant results.
After 10 minutes of adaptation in the lying position, contact silver/silver chloride electrodes were attached to each patient; four limb leads and six precordial leads. The recording was performed in all the 12 channels simultaneously for 240 seconds, which is the required duration to record 200 PQRST-complexes. The data were, then, transferred from the monitor to a computer for analysis with original software (Hannover estimation system). The ECG recordings were processed by the original program to calculate the L and G criteria.
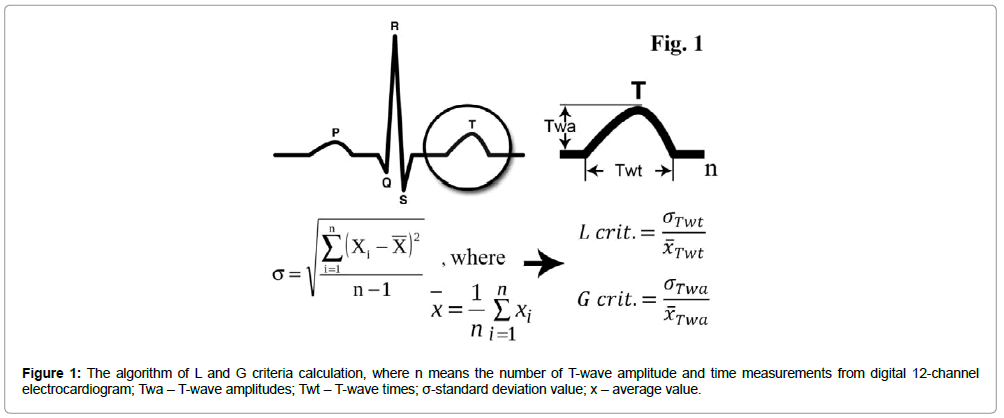
It is known that the first ischemic changes are represented on surface ECG by T wave abnormalities (hyperacute, inverted, biphasic, and flat) and ST-segment changes (elevation or depression). We used the T-wave amplitude for calculating the G-criterion, and T-wave time from each 12 channels separately for the L-criterion (positive, negative, and the average G- and L-criteria in cases of biphasic T-waves). After measuring the 200 T-wave amplitudes and 200 T-wave times from the recordings, we used the statistical means and standard deviations from the formulae demonstrated in Figure 1.
For the calculation of the L-criterion, we compared the standard deviation of 200 T-wave times (Twt) to the average value, and for the calculation of the G-criterion, we compared the standard deviation of 200 T-wave amplitudes (Twa) to the average value. Then, we compared the G and L criteria from each channel to reflect the different parts of the heart. The difference in the criteria between the channels gives us significant quantitative characteristics of ischemic and non-ischemic zones of the myocardium. We, then, compared the maximum or ischemic value of the L-criterion from one channel to the minimum or non-ischemic value of the L-criterion from another channel to calculate the second order L-criterion (SOL-criterion). Similarly, the second order G-criterion (SOG-criterion) was calculated [19].
We examined two groups of patients in this study. The first group included 21 young healthy people with an average age of 25 ± 4.5 years. The second group included 139 patients with an average age of 67.5 ± 10.9 years with suspected CAD who underwent elective coronary angiography, common ECG tests, exercise stress test, and cardiac troponin measurements. This group included patients with different CAD severities and coronary angiograms (37 patients without hemodynamically significant stenosis or with mild sclerosis, 229 with moderate CAD, and 73 with severe CAD). Of the patients with severe CAD, 43 had ≥ 90% stenosis, 22 had occlusions of the coronary arteries and only one had AMI. The results were then compared with results of coronary artery angiography.
Calculations and statistical analyses
STATISTICA 12.6 was used for statistical analyses. Data are presented as absolute values of criteria or mean ± standard deviation, SD. Unpaired Student’s t test or ANOVA were used for comparisons. A probability value of P< 0.05 was considered statistically significant. The correlation coefficient (r) was measured as a linear association between coronary artery lesion percentage and the calculated criterion. A correlation coefficient of r=+1 indicates that two variables are perfectly related in a positive linear sense, while a correlation coefficient r = 0 indicates that there is no linear relationship between two variables.
Results
There were authentic augmentations of all worked-out criteria (G and L) in the ischemia zone of the myocardium in comparisons to the non- ischemic zones (1.65-12.81). In the control group, all criteria oscillated between 1.3-1.72.
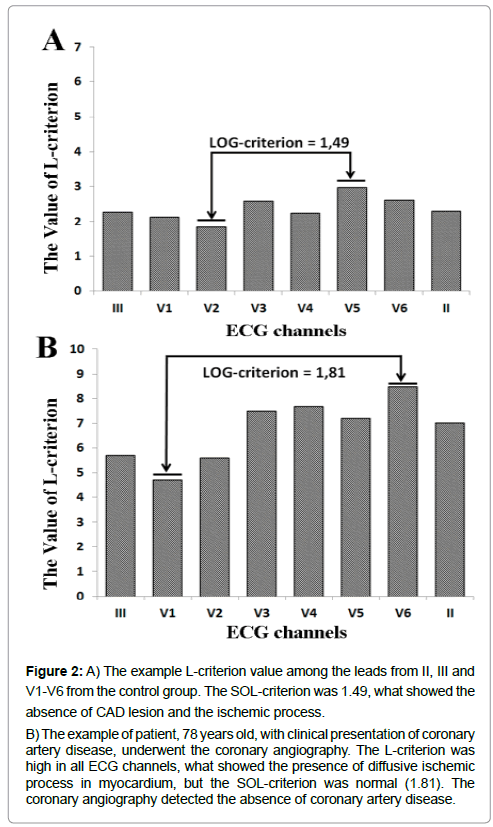
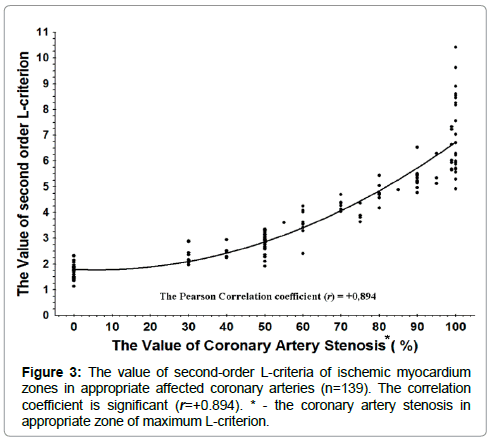
In clinical practice the severity of coronary artery atherosclerosis is extremely important. In the 139 patients, we found a strong correlation between the value of L-criterion with the localization of the pathology in the myocardium and evidence of coronary artery stenosis in the appropriate zones (correlation coefficient r = 0.894). The graph of correlation between the second order L-criterion and the percentages of coronary artery lesions by coronary angiography is shown in Figures 2 and 3. A slight deviation can be observed in the SOL-criterion values before 70% severity of coronary artery lesion, but the deviation of SOL-criterion values raises in the group of 70% to 100% (occlusion) severity patients. The values of coronary lesions cluster mainly in the values multiple of 10% and small part - multiple 5%. The dependence of the examined values is nonlinear, but they do demonstrate exponential dependence as a result of multifactorial influence on the SOL-criterion and coronary artery lesions. The sensitivity of the values of SOL-criterion 3.0 and above in the patients with ≥ 50% stenosis is 85.4% and in the patients with ≥ 60% stenosis, it is 96.97%. The specificity of the values of L-criterion 3.0 and above is 96.87%.
Figure 2: A) The example L-criterion value among the leads from II, III and V1-V6 from the control group. The SOL-criterion was 1.49, what showed the absence of CAD lesion and the ischemic process.
B) The example of patient, 78 years old, with clinical presentation of coronary artery disease, underwent the coronary angiography. The L-criterion was high in all ECG channels, what showed the presence of diffusive ischemic process in myocardium, but the SOL-criterion was normal (1.81). The coronary angiography detected the absence of coronary artery disease.
The value of L-criterion in the group without hemodynamically significant stenosis is 2.005 ± 0.51, while in the group with hemodynamically significant stenosis it is 4.78 ± 1.73, and that including the group with stenosis ≥ 60% is 5.45 ± 1.48.
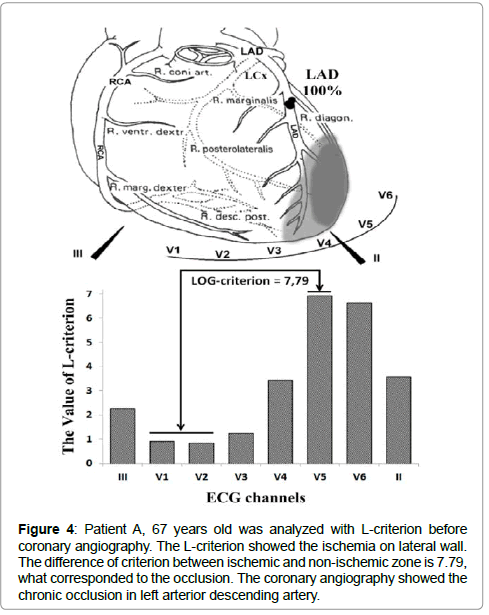
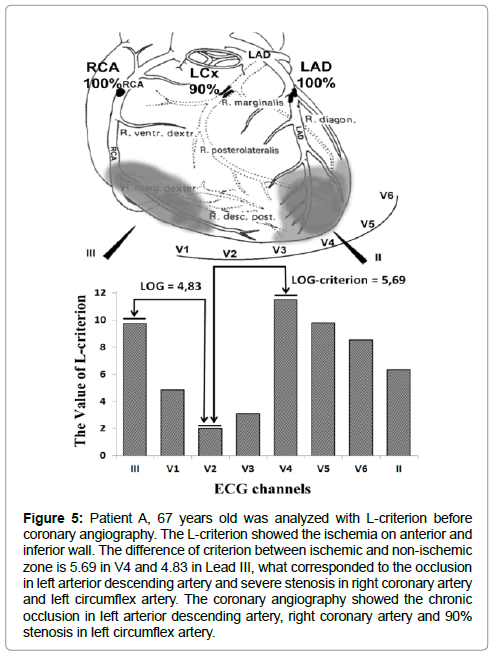
Among 139 patients with PCI, in the group with stenosis of 95- 100%, only one patient had AMI. The dispersion of the values of L-criterion in the group with 90-100% stenosis can be explained, for example, by the development of collateral circulation, drug administration, and adaptation mechanisms. The examples of two patients are illustrated in Figures 4 and 5.
Figure 4: Patient A, 67 years old was analyzed with L-criterion before coronary angiography. The L-criterion showed the ischemia on lateral wall. The difference of criterion between ischemic and non-ischemic zone is 7.79, what corresponded to the occlusion. The coronary angiography showed the chronic occlusion in left arterior descending artery.
Figure 5: Patient A, 67 years old was analyzed with L-criterion before coronary angiography. The L-criterion showed the ischemia on anterior and inferior wall. The difference of criterion between ischemic and non-ischemic zone is 5.69 in V4 and 4.83 in Lead III, what corresponded to the occlusion in left arterior descending artery and severe stenosis in right coronary artery and left circumflex artery. The coronary angiography showed the chronic occlusion in left arterior descending artery, right coronary artery and 90% stenosis in left circumflex artery.
We performed correlation analysis between functional classes and the values of SOG-criterion (r=0.83). It is difficult to assess the specificity because there were numerous patients with non-typical pain and those without symptoms. However, the analysis of 139 patients showed very high sensitivity of G-criterion value above 1.8 (above 94%).
In the group with class II severity, the ratio of the G-criterion in the ischemic zone in relation to that of the non-ischemic zone was 2.015 ± 0.43, while the ratio in the group with class III severity was 3.2 ± 0.69, and in the group with class IV severity and UA was 5.71 ± 1.61. The differences among the means were statistically significant (p = 0.0038 among III and IV classes, p<0.001 among classes II and III, II and IV) [19].
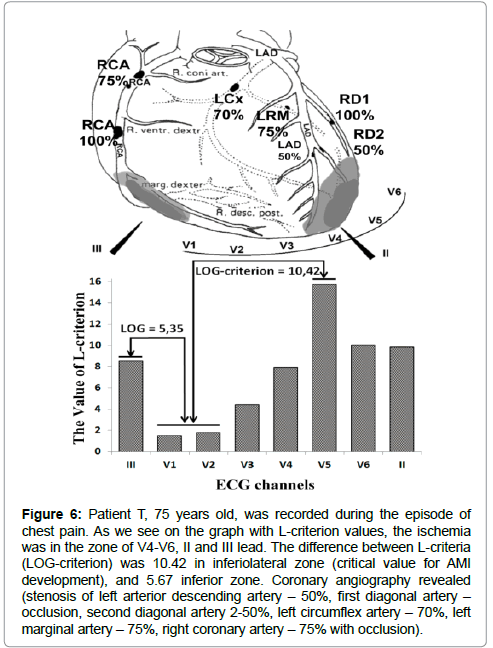
A clinical case of myocardial infarction (MI) is presented in Figure 6. The method’s possibilities can be illustrated by this clinical case. Patient T, 75 years old, with increasing dyspnea had onset of chest pain and ECG was performed during this episode of chest pain. The first recording assessed the presence of occlusion in the right coronary artery and first diagonal artery. The critical second order L-criterion value in V5 was 10.42. Unstable angina pectoris was diagnosed according to the second order G-criterion of 4.57. The most critical area was the inferiolateral zone of the heart, where AMI was diagnosed 12 hours later. On the common ECG, ST segment elevation in leads V2-V4 was detected with non-specific changes in leads V5- V6, and the biomarkers of MI were not elevated. Twelve hours later, the biomarkers of MI were positive (3 hours later: Troponin I: 2.001; 24 hours later: Troponin I: 3.024). Coronary angiography revealed the following: 50% stenosis in the left anterior descending artery and second diagonal artery, 70% stenosis in the left circumflex artery, 75% stenosis in left marginal artery, 75% proximal stenosis in the right coronary artery, and occlusions in the first diagonal artery and middle part of the right coronary artery.
Figure 6: Patient T, 75 years old, was recorded during the episode of chest pain. As we see on the graph with L-criterion values, the ischemia was in the zone of V4-V6, II and III lead. The difference between L-criteria (LOG-criterion) was 10.42 in inferiolateral zone (critical value for AMI development), and 5.67 inferior zone. Coronary angiography revealed (stenosis of left arterior descending artery – 50%, first diagonal artery – occlusion, second diagonal artery 2-50%, left circumflex artery – 70%, left marginal artery – 75%, right coronary artery – 75% with occlusion).
Discussion
One of the main methods to diagnose CAD is electrocardiography. In the current study, we found some astonishing correlations. Therefore, we developed new criteria to assess the status of oxygenation of the heart and offer new possibilities with this technology. We selected the T-wave for quantitative assessment of time-amplitude characteristics because it is well-known that the first changes in ECG due to CAD are reflected in the T-waves.
The second order L-criterion, which is calculated on the basis of time features of modified ECG, has a strong correlation with the value of coronary artery stenosis according to angiography (correlation coefficient r = 0.894). In general, this demonstrates that the L-criterion reflects the underlying coronary blood flow quantitatively.
It is known that a wide range of abnormalities in cell metabolism, function, and structure underlie these mechanical disturbances during ischemia. The normal myocardium metabolizes fatty acids and glucose into carbon dioxide and water. With atherosclerotic plaques and oxygen deprivation, the reduction of aerobic adenosine triphosphate (ATP) formation stimulates glycolysis, and an increase in myocardial glucose uptake and glycogen breakdown [20,21]. In these conditions, fatty acids cannot be oxidized completely, and, instead of normal uptake of lactate from blood, the ischemic myocardium switches to production of lactate. This changes the cell’s homeostasis dramatically with the accumulation of lactate and protons (H+), reduction of intracellular pH, and reduction in its contractile function. The result of ischemia is the acceleration of glycolysis and lactate production with decreased mitochondrial function, which results in lactate accumulation in the tissues supplied by the affected artery.
The fall in intracellular pH strongly influences the ability of cardiac muscle to support homeostasis of ions, beginning with that of calcium ions (Ca2+), and utilization of ATP in contraction. The amount of ATP required by sarcoplasmic Ca2+ pumps is greater when the pH is lower [22]. Furthermore, the Ca2+ concentration required for a given amount of force generation is greater at a lower pH, and a higher concentration is required during contraction to produce the necessary mechanical power. At a low pH, for a given rate of ATP synthesis, more of the energy released from ATP breakdown contributes to the work of regulating Ca2+ homeostasis in the cytosol, and less to contraction. Additionally, the efflux of H+ from the myocytes results in sodium exchange and greater Na+-Ca2+ exchange across the cell membrane, resulting in further wasting of ATP in order to maintain Ca2+ homeostasis [23].
The described changes in ion homeostasis play a key role in T-wave morphology. The lower oxygen supply causes a delay in repolarization and relaxation of the ischemic myocytes. Perivascular myocytes have comparatively better oxygenation than other myocytes during repolarization. The inequality of oxygen supply in the ischemic zone can explain the increased T-wave time instability (L-criterion) in these coronary artery lesions. The more severe the coronary artery lesion, the more severe is the T-wave time instability. Furthermore, a low L-criterion demonstrates the absence or insignificance of coronary artery lesions for myocardial metabolism.
The G-criterion is related to the severity of clinical presentation of CAD and quantitatively confirms the functional classes. It reflects another aspect of the same metabolic disturbances due to ischemia, which are closely related to the changes in the L-criterion.
The group with severe CAD and coronary artery occlusion was characterized by a greater deviation of the SOL-criterion (4.92-10.42). This observation can be explained by the influence of efficacy of drug therapy and development of collateral circulation in every patient. The gradual increasing of the SOL-criterion and its approximate critical value (>10.42) give us a quantitative non-invasive assessment of the metabolic changes in the myocardium and efficacy of drug therapy, thereby, enabling percutaneous coronary intervention on time.
Conclusion
Non-invasive statistical analyses of 200 T-wave time and amplitude values from ECG recordings allow for quantitative assessments of myocardial ischemic and non-ischemic metabolic changes in every patient. The value of SOL-criterion provides significant information about the presence and localization of coronary artery lesions. The SOG-criterion provides the precise values corresponding to the patient’s functional class of CAD. In cases with multiple artery lesions, the detection of ischemic zone can help physicians to perform PCI on time and choose the necessary artery for stent implantation to avoid complications. The dynamic monitoring of second order L and G criteria allows for the gradual assessment of the intensification of myocardial ischemia and, correspondingly, forecasting the development of myocardial infarction with an accuracy of a few hours.
It is for the first time that quantitative assessment of ECG parameters have been used to indirectly and reliably assess the status of coronary blood flow and degree of ischemic process regardless of the risk factors and clinical presentation.
Acknowledgements
We thank our action group of like-minded persons (physicians and programmers) for their contributions. Also, we thank the Amedtec Medizintechnik Aue GmbH for helping with the high-resolution ECG device for scientific needs. We would like to thank MVZ Augsburg Cardiological Clinic Center and its coronary artery laboratory for helping with working at the diagnostic system.
Sources of Funding
The authors received no financial support for the research, authorship, and publication of this article.
Disclosures
None
References
- Stern S, Tzivoni D (1974) Early detection of silent ischaemic heart disease by 24-hour electrocardiographic monitoring of active subjects. Br Heart J 36: 481-486.
- Schang SJ Jr, Pepine CJ (1977) Transient asymptomatic ST segment depression during daily activity. Am J Cardiol 39: 396-402.
- Rosamond WD, Chambless LE, Heiss G, Mosley TH, Coresh J, et al. (2012) Twenty-two-year trends in incidence of myocardial infarction, coronary heart disease mortality, and case fatality in 4 US Communities, 1987-2008. Circulation 125: 1848-1857.
- Hacket D, Verwilghen J, Davies G, Maseri A (1989) Coronary stenoses before and after acute myocardial infarction. Am J Cardiol 63: 1517-1518.
- Webster MW, Chesebro JH, Smith HC, Frye RL, Holmes DR, et al. (1990) Myocardial infarction and coronary artery occlusion: A prospective 5-year angiographic study. J Am Coll Cardiol 15: 218A.
- Patel MR, Peterson ED, Dai D, Brennan JM, Redberg RF, et al. (2010) Low diagnostic yield of elective coronary angiography. N Engl J Med 362: 886-895.
- Bugiardini R, Bairey Merz CN (2005) Angina with “normal” coronary arteries: a changing philosophy. JAMA 293: 477-484.
- Di Lorenzo E, De Luca G, Sauro R, Varricchio A, Capasso M, et al. (2009) The PASEO (PaclitAxel or Sirolimus- Eluting Stent Versus Bare Metal Stent in Primary Angioplasty) randomized trial. J Am Coll Cardiol Intv 2: 515-523.
- Laarman GJ, Suttorp MJ, Dirksen MT, van Heerebeek L, Kiemeneij F, et al. (2006) Paclitaxel-eluting versus uncoated stents in primary percutaneous coronary intervention. N Engl J Med 355: 1105-1113.
- Räber L, Kelbæk H, Ostojic M, Baumbach A, Heg D, et al. (2012) Effect of biolimus-eluting stents with biodegradable polymer vs bare-metal stents on cardiovascular events among patients with acute myocardial infarction: the COMFORTABLE AMI randomized trial. JAMA 308: 777-787
- Spaulding C, Henry P, Teiger E, Beatt K, Bramucci E, et al. (2006) Sirolimus-eluting versus uncoated stents in acute myocardial infarction. N Engl J Med 355: 1093-1104.
- Stone GW, Lansky AJ, Pocock SJ, Gersh BJ, Dangas G, et al. (2009) Paclitaxel-eluting stents versus bare-metal stents in acute myocardial infarction. N Engl J Med 360: 1946-1959
- van der Hoeven BL, Liem SS, Jukema JW, Suraphakdee N, Putter H, et al. (2008) Sirolimus-eluting stents versus bare-metal stents in patients with ST-segment elevation myocardial infarction: 9-month angiographic and intravascular ultrasound results and 12-month clinical outcome. Intervention Study. J Am Coll Cardiol 51: 618-626.
- Frobert O, van’t Veer M, Aarnoudse W, Simonsen U, Koolen JJ, et al. (2007) Acute myocardial infarction and underlying stenosis severity. Catheter Cardiovasc Interv 70: 958-965
- Manoharan G, Ntalianis A, Muller O, Hamilos M, Sarno G, et al. (2009) Severity of coronary arterial stenoses responsible for acute coronary syndromes. Am J Cardiol 103: 1183-1188.
- Toutouzas K, Karanasos A, Tsiamis E, Riga M, Drakopoulou M, et al. (2011) New insights by optical coherence tomography into the differences and similarities of culprit ruptured plaque morphology in non-ST-elevation myocardial infarction and ST- elevation myocardial infarction. Am Heart J 161: 1192-1199.
- Patel MR, Peterson ED, Dai D, Brennan JM, Redberg RF, et al. (2010) Low Diagnostic Yield of Elective Coronary Angiography.N Engl J Med. 362: 886-895.
- Alekseyev M, Alekseyev A, Dowzhikov A, Labin S (2014) Digital Analytic Cardiography (DACG), a New Method for Quantitative Trophism Assessment of the Myocardium. Int J Cardiovasc Res 3: 6
- Alekseev M, Alekseev A, Siegle R, Roder G. (2016) Data processing apparatus for assessing a condition of a myocardium. Patent application PCT/EP2016/001193, DE.
- Opie LH (1998) The Heart: Physiology, from Cell to Circulation. Philadelphia.
- Stanley WC, Lopaschuk GD, Hall JL, McCormack JG. (1997) Regulation of myocardial carbohydrate metabolism under normal and ischaemic conditions: potential for pharmacological interventions. Cardiovasc Res 33: 243-257
- Fabiato A, Fabiato F (1978) Effects of pH on the myofilaments and the sarcoplasmic reticulum of skinned cells from cardiac and skeletal muscles. J Physiol (Lond) 276: 233-255.
- Murphy E, Perlman M, London RE, Steenbergen C (1991) Amiloride delays the ischemia-induced rise in cytosolic free calcium. Circ Res 68: 1250-1258.
 Spanish
  Chinese
  Russian
  German
  French
  Japanese
  Portuguese
  Hindi
Hindi 