Research Article, Int J Cardiovasc Res Vol: 7 Issue: 2
Study of Left Ventricular Function in Diabetic Patients with Normal Ejection Fraction: Evaluation by Tissue Doppler and Speckle Tracking Echocardiography
Mohamed Yahia1* and Tamer Ghazy1,2
1Department of Cardiology, College of Medicine, University of Menoufia, Egypt
2Department of Cardiology, Aljahra hospital, Aljahra, Kuwait
*Corresponding Author : Mohamed Yahia
Department of Cardiology, College of Medicine, University of Menoufia, Gamal Abdulnaser Street, Shebin Alkoum City, Zip code: 32511, Egypt
Tel: 00201005362162
E-mail: m.yahia.emam2000@gmail.com
Received: February 06, 2018 Accepted: March 27, 2018 Published: April 01, 2018
Citation: Yahia M, Ghazy T (2018) Study of Left Ventricular Function in Diabetic Patients with Normal Ejection Fraction: Evaluation by Tissue Doppler and Speckle Tracking Echocardiography. Int J Cardiovasc Res 7:2. doi: 10.4172/2324-8602.1000344
Abstract
Background: The effect of Diabetes Mellitus (DM) on the left ventricular (LV) diastolic function is still controversial. The aim of this study was to demonstrate the effect of type 2 DM on the LV diastolic function according to the latest recommendations of the American Society of Echocardiography, and on LV systolic function assessed by speckle tracking echocardiography among asymptomatic normotensive patients with preserved LV ejection fraction (EF).
Methods: LV diastolic function was assessed by pulsed Doppler and tissue Doppler echocardiography. LV systolic function was assessed by speckle tracking echocardiography in 40 patients with type 2 DM and LVEF >50%. The results were compared with 20 healthy control subjects.
Results: Average LV global longitudinal strain (GLS) was lower in diabetic persons in comparison to control subjects (16.9±1.6 versus 19.4±1.9, p<0.001). Doppler echocardiography showed that diabetic group in comparison with controls had a higher peak A (61.25±13.7 versus 47.9±7.7, p<0.001) and a lower E/A ratio (1.12±0.40 versus 1.49 ± 2.9, p=0.001). Tissue doppler imaging showed lower e’ septal (8.1±2 versus 11.2±2.1, p<0.001), lower e’ lateral (10.1±2.3 versus 13.4±2.2, p<0.001), a higher E/ e’ (7.4±1.6 versus 5.9±0.9, p<0.001), and a higher LAVI (28.2±4.5 versus 25.5±3.7, p=0.01) than controls. The mean values of e’ septal, e’ lateral and LAVI didn’t reach the recommended values to diagnose LV diastolic dysfunction.
Conclusions: In asymptomatic normotensive patients with type 2 DM and preserved LVEF, the LV GLS was reduced, while there was no significant evidence of diastolic dysfunction.
Keywords: Diabetes Mellitus; Diastolic dysfunction; Speckle tracking echocardiography; Global longitudinal strain
Abbreviations
BMI: body mass index; BSA: body surface area, DM: diabetes mellitus, LV: left ventricle; IVSD: interventricular septal diameter, LVEDD: left ventricular end diastolic diameter, LVESD: left ventricular end systolic diameter; EF: ejection fraction; LA: left atrium; TR: tricuspid regurgitation, LAVI: left atrium volume index, GLS: global longitudinal strain
Introduction
The effect of DM on LV diastolic function is still controversial. Previous studies demonstrated frequent association of impaired LV filling and type 2 DM during the earlier stage of the disease before systolic function becomes impaired. Most of these studies assessed systolic function by way of LVEF %, while evaluating diastolic function by pulsed wave Doppler and Tissue Doppler velocity echocardiography [1-3]. The effect of DM on LV compliance was explained by diabetic microvasculopathy, accumulation of advanced glycation end products in myocardial tissue, and change in myocardial metabolism. Investigators supposed myocardial injury by over the uptake of myocardium to lipid as a result of insulin resistance of visceral adipose tissue, with associated accumulation of triglyceride in the myocardium [4]. The oversupply of myocardium with fatty acids is associated with disruption of mitochondrial function with subsequent myocytes damage which in turn is replaced by fibrous tissue. Myocardial fibrosis will decrease LV compliance [5].
Subclinical systolic dysfunction in DM can be recognized using tissue Doppler velocity and myocardial strain speckle tracking echocardiography beyond that indicated by LVEF%. The aim of the current study was to demonstrate the effect of type 2 DM on the LV diastolic function according to the latest recommendations of the American Society of Echocardiography [6] and on LV systolic function assessed by speckle tracking echocardiography among asymptomatic normotensive patients with preserved LVEF.
Patients and Methods
Study population
We recruited 40 patients (with mean age 57.3 ± 10.8) with type 2 DM between June 2016 and March 2017 who had followed up in diabetic outpatient clinic of Aljahra central hospital, Kuwait. The inclusion criteria were patients with type 2 DM with preserved LV systolic function (LVEF >50%). World Health Organization criteria were used to diagnose Diabetes Mellitus [7]. Patients, who had a history of hypertension, coronary artery disease, previous percutaneous coronary intervention, non-sinus rhythm, valvular diseases, or kidney diseases, were excluded from the study. Those with chest pain and a normal resting electrocardiogram (ECG) were referred for an exercise stress test or myocardial perfusion imaging to exclude ischemic heart disease. A 20 sex- and age-matched healthy persons without history of DM and with LVEF >50% were used as a control group. This study was approved by the local research committee of the hospital, and written informed consent was obtained from the patients before their involvement in the study.
Two dimensional resting echocardiography
A VIVID E9 machine (GE Healthcare, Chicago, IL, USA) equipped with a 3.5 MHz phased-array transducer was used to make an initial two dimensional (2D) transthoracic echocardiography. The 2D imaging was performed from the standard apical and parasternal views. The average of three consecutive heartbeats was used. The standard 2D and M-mode measurements were recorded, and the LVEF% was assessed using modified Simpson’s rule. The biplane arealength method used for the measurement of left atrial volume (LAV) in apical four and apical two chamber views at the end of systole. By division of LAV to body surface area, Left atrial volume index (LAVI) was recorded. LAVI ≥ 34 ml/m2 was considered increased. The recommendations of the American Society of Echocardiography were applied when registering all of the 2D and conventional Doppler variables [8].
Pulsed-wave Doppler and Tissue Doppler echocardiography
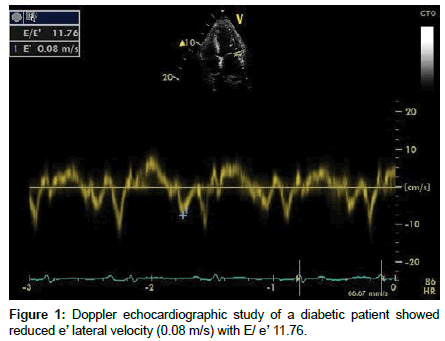
In the apical four chamber view, Doppler echocardiography was used to assess trans- mitral early diastolic velocity (E-wave), late diastolic velocity (A-wave), E/A ratio, and the deceleration time. Pulsed-wave tissue Doppler velocity analysis was conducted on apical images acquired with >100 frames/s. The 2-mm pulsed Doppler sample was positioned in septal and lateral mitral annulus to measure septal and lateral peak early diastolic velocity (e’). E/e’ was recorded (Figure 1).
Assessment of LV diastolic function
Recommendations for the evaluation of LV diastolic function of the American Society of Echocardiography and the European Association of Cardiovascular Imaging were used to diagnose LV diastolic dysfunction. Average E/e’> 14, septal e’ velocity <7 cm/s or lateral e’ velocity <10 cm/s, Tricuspid regurgitation (TR) velocity > 2.8 m/s, and LAVI >34 ml/m2 were used to diagnose diastolic dysfunction. A patient who had >50% of these parameters was considered to have diastolic dysfunction, while patients who have 50% were considered to have an indeterminate diastolic function. Grade I diastolic dysfunction was diagnosed when mitral E/A ratio is ≤ 0.8, average E/e’ ratio <10, peak TR velocity <2.8 m/Sec, and normal or increased LAVI. Grade 2 diastolic dysfunction was diagnosed when mitral E/A ratio is >0.8 to <2, average E/e’ ratio 10-14, peak TR velocity <2.8 m/Sec, and increased LAVI. Finally, criteria of grade III diastolic dysfunction are: mitral E/A ratio >2, average E/e’ ratio >14, peak TR velocity >2.8 m/Sec, and increased LAVI [6].
Speckle-tracking echocardiography
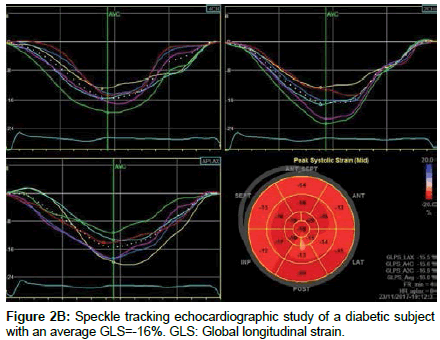
All of the data were stored digitally in a cine loop format, and the speckle-tracking imaging of the LV was done offline using a workstation (EchoPAC, version 7.0; GE Healthcare, Chicago, IL, USA). The frame rate was adjusted from 60 to 100 frames per second to display grayscale 2D images. The study began with the apical long axis view from which the time of aortic valve closure was marked. Then, apical four chamber and apical two chamber views were used. Automated functional imaging (AFI) [9] was used to record the LV global longitudinal strain (GLS). The software automatically traces the regions of interest to identify the whole myocardial wall. Speckle tracking echocardiography uses the sole myocardial ultrasound outlines tracked frame by frame, which is used to derive the strain. In some instances, the endocardial tracing was manually modified to attain ideal alignment. In those segments with poor tracking, the endocardial trace line was adopted until a better tracking score was achieved. The longitudinal strain percentage is defined as the change in the length of the regions of interest from end-diastole to end-systole. The LV wall was partitioned into six segments, and the computer software calculated the peak systolic strains inside each segment. GLPS-Average represents the overall peak systolic longitudinal strains of the entire LV segments.
Statistical Analysis
Information were encouraged to the PC and investigated utilizing IBM SPSS software package variant 20 (Armonk, NY: IBM Corp).The Kolmogorov- Smirnov, Shapiro and D’agstino tests were utilized to confirm the ordinariness of dissemination of factors, Comparisons between groups for clear cut aspects variables were assessed using Chisquare test (Fisher or Monte Carlo). Student t-test was utilized to think about two groups for ordinarily appropriated quantitative factors. Mann Whitney test was utilized to compare between two groups for unusually appropriated quantitative factors. Correlation between the abnormally quantifiable variables was done by Spearman’s coefficient, while correlation between the normally quantifiable variables was done by Pearson’s coefficient. Statistically significant level was reached at p ≤ 0.05.
Results
The study cohort consisted of 25 males (62.5%) and 15 females (37.5%) with a mean age of 57.3 ± 10.8 years presented with type 2 DM. The duration of DM ranged from 1 year to 12 years. 34 (85%) patients were on oral hypoglycemic drugs while 8 (20%) were on combined insulin and oral therapy. The control group consisted of 20 healthy persons with no history of DM and with a normal blood glucose level. Diabetic patients were older (57.3 ± 10.8 versus 53.4 ± 9.1 years) and had higher BMI (28.2 ± 3.3 versus 25.4 ± 2.9 Kg/m2) and higher rates of dyslipidemia than the controls (Table 1).
| Control (n=20) | Diabetic (n=40) | p | |
|---|---|---|---|
| Age (years) | 53.4 ± 9.1 | 57.3 ± 10.8 | 0.167 |
| Sex | |||
| Male | 12 (60%) | 25 (62.5%) | 1.000 |
| Female | 8 (40%) | 15 (37.5%) | |
| Body surface area (m2) | 1.85 ± 0.10 | 1.86 ± 0.10 | 0.67 |
| Body mass index( kg/m2) | 25.4 ± 2.9 | 28.2 ± 3.3 | 0.002 |
| Fasting blood sugar (mg/dl) | 86.5 (70 – 106) | 125.5 (72 – 211) | <0.001 |
| Hemoglobin A1C % | 5.2 ± 0.3 | 8.1 ± 1.3 | <0.001 |
| Dyslipidemia | |||
| No | 16 (80%) | 22 (55%) | 0.058 |
| Yes | 4 (20%) | 18 (45%) | |
| Smoking | |||
| No | 15 (75%) | 26 (65%) | 0.432 |
| Yes | 5 (25%) | 14 (35%) | |
| Statins | |||
| No | 16 (80%) | 32 (80%) | FEp=1.000 |
| Yes | 4 (20%) | 8 (20%) | |
| Systolic BP (mmHg) | 121 ± 9.8 | 123 ± 10 | 0.49 |
| Diastolic BP (mmHg) | 75.2 ± 5.3 | 77.5 ± 7 | 0.224 |
| Serum creatinine(mg/dl) | 1.1 ± 0.2 | 1.1 ± 0.4 | 0.672 |
| Total Cholesterol (mg/dl) | 177.1 ± 40.4 | 187.2 ± 38.8 | 0.349 |
| Triglycerides (mg/dl) | 148.5 (86 – 337) | 175 (94 – 394) | 0.045 |
| LDL(mg/dl) | 107 ± 43.1 | 131.7 ± 47.2 | 0.054 |
| HDL (mg/dl) | 42.4 ± 10.4 | 36.7 ± 9.4 | 0.038 |
| Duration of DM (years) | 0 | 6 (1 – 12) | - |
Table 1: Study population characteristics.
There were no significant differences between two groups with regard to 2D and M-mode echocardiographic data. Diabetic group in comparison with controls had a higher peak A (61.25 ± 13.7 versus 47.9 ± 7.7, p<0.001), lower E/A ratio (1.12 ± 0.40 versus 1.49 ± 2.9, p=0.001) and higher deceleration time (207 ± 35 versus 182 ± 28, p=0.006). TDI showed lower e’ septal (8.1 ± 2 versus 11.2 ± 2.1, p<0.001), lower e’ lateral (10.1 ± 2.3 versus 13.4 ± 2.2, p<0.001), and higher E/ e’ (7.4 ± 1.6 versus 5.9 ± 0.9, p<0.001) in the diabetic group than controls. Diabetic group had higher LAVI than control groups (28.2 ± 4.5 versus 25.5 ± 3.7, p=0.01). There were no significant differences between two groups with regard to TR velocity. Although Doppler and LAVI values showed significant differences between diabetic group and control groups in regard to E/A ratio, e’ septal, e’ lateral and LAVI, the mean values of these parameters didn’t reach the ASE recommended values to diagnose LV diastolic dysfunction [6]. According to these values, diastolic dysfunction was detected in 5 (12.5%) in diabetic group (3 had impaired relaxation pattern and 2 had a pseudonormal filling pattern), while 8 (20%) had an indeterminate LV diastolic function. Overall, there were no significant differences between cases and controls with regard to LV diastolic dysfunction (P=0.098) (Table 2).
| Control (n=20) |
Diabetic (n=40) |
p | |
|---|---|---|---|
| LV diastolic dimension (cm) | 5.1 ± 0.4 | 5.3 ± 0.5 | 0.110 |
| LV systolic dimension (cm) | 3.6 ± 0.3 | 3.4 ± 0.3 | 0.118 |
| LV septal wall thickness (cm) | 0.93 ± 0.17 | 0.99 ± 0.15 | 0.194 |
| LVM mass index (g/m2) | 74.4 ± 12.5 | 76.7 ± 12.1 | 0.521 |
| LV ejection fraction (%) | 58.7 ± 4.8 | 59.6 ± 4.6 | 0.475 |
| LA (mm) | 3.5 ± 0.39 | 3.74 ± 0.41 | 0.06 |
| LAVI | 25.5 ± 3.7 | 28.2 ± 4.5 | 0.01 |
| E (cm/s) | 72.5 ± 16.4 | 65.1 ± 13.1 | 0.08 |
| A (cm/s) | 47.6 ± 7.7 | 61.25 ± 13.7 | <0.001 |
| E/A ratio | 1.49 ± 2.9 | 1.12 ± 0.40 | 0.001 |
| DT(ms) | 182 ± 28 | 207 ± 35 | 0.006 |
| S’ (cm/s) | 10 ± 1.3 | 9.8 ± 1.4 | 0.639 |
| e’septal (cm/s) | 11 ± 2.1 | 8.1 ± 2 | <0.001 |
| e’lateral (cm/s) | 13.4 ± 2.2 | 10.1 ± 2.3 | <0.001 |
| E/e’ Average | 5.9 ± 0.9 | 7.4 ± 1.6 | <0.001 |
| TR Velocity (m/s) | 2.36 ± 0.33 | 2.54 ± 0.38 | 0.095 |
Table 2: Comparison between the two studied groups according to echocardiographic findings.
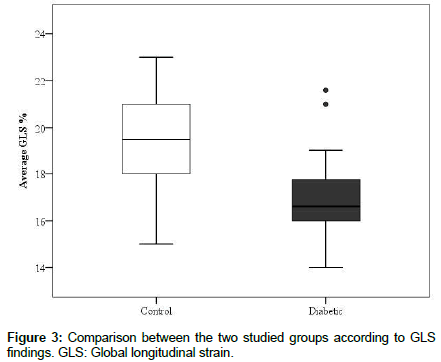
The results of speckle tracking strain analysis in all segments of the LV and the average GLS were demonstrated in table 3. Longitudinal strain of the LV was significantly different in most LV segments. Average GLS in overall segments were lower in diabetic patients in comparison to control subjects (16.9 ± 1.6 versus 19.4 ± 1.9, p<0.001) (Figure 2a and 2b). The presence of DM was the independent factor for reduced longitudinal strain after adjustment for BMI (Table 4).
| Longitudinal Strain % | |||
|---|---|---|---|
| LV segment | Control (n=20) |
Diabetic (n=40) |
p |
| Septal apical | -22 ± 3.6 | -18.6 ± 3.7 | 0.002 |
| Septal mid | -19.1 ± 2.8 | -16.2 ± 3.3 | 0.001 |
| Septal basal | -16.8 ± 2.7 | -16 ± 2.6 | 0.292 |
| Lateral apical | -19.6 ± 4.4 | -17.5 ± 3.7 | 0.056 |
| Lateral mid | -16.2 ± 3.5 | -14.3 ± 2.6 | 0.020 |
| Lateral basal | -20.4 ± 2.9 | -17.7 ± 2.6 | 0.001 |
| Anterior apical | -20.2 ± 4.9 | -17.5 ± 2.2 | 0.031 |
| Anterior mid | -16 ± 4.4 | -15 ± 2.6 | 0.361 |
| Anterior basal | -19.4 ± 3.3 | -16 ± 1.9 | <0.001 |
| Inferior apical | -23.9 ± 3.4 | -22 ± 3.1 | 0.034 |
| Inferior mid | -20.2 ± 3.4 | -19.1 ± 2.8 | 0.211 |
| Inferior basal | -20.3 ± 3.9 | -19.3 ± 3 | 0.270 |
| Posterior mid | -17.2 ± 2.5 | -16.5 ± 1.8 | 0.188 |
| Posterior basal | -16.6 ± 2.7 | -15.9 ± 2.1 | 0.247 |
| Anteroseptal mid | -21.1 ± 2.7 | -16.7 ± 2.9 | <0.001 |
| Anteroseptal basal | -18.1 ± 2.9 | -15.8 ± 2.6 | 0.003 |
| Average GLS % | -19.4 ± 1.9 | -16.9 ± 1.6 | <0.001 |
Table 3: Comparison between the two studied groups according to speckle tracking echocardiographic data.
| B | SE | Beta | t | p | |
|---|---|---|---|---|---|
| Presences of diabetes | -2.590 | 0.524 | -0.585 | 4.947 | <0.001 |
| BMI (kg/m2) | 0.020 | 0.073 | 0.033 | 0.279 | 0.781 |
Table 4: Multivariate Linear regression for average GLS %.
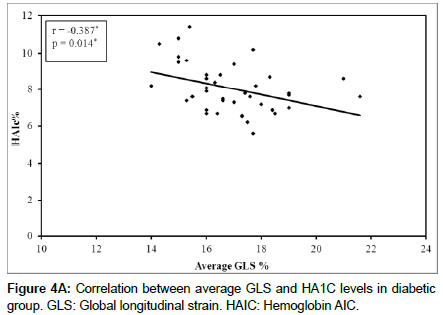
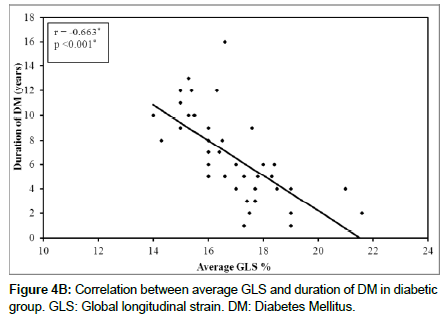
Linear Regression analysis showed a negative correlation between GLS and duration of DM (r=-0.663, p<0.001) (Figure 3) and negative correlation between GLS and glycosylated hemoglobin AIC (r=- 0.387, p=0.014) (Figure 4A and 4B).
Discussion
Evidence of an intrinsic diastolic dysfunction in diabetes mellitus is still controversial.
Alteration of LV filling in type 2 diabetic patients has been observed in the early course of diabetic heart disease before the development of impairment of systolic function even in the absence of coronary atherosclerosis and arterial hypertension [10].
In the present case control study, 40 patients with type-2 DM as cases; and 20 healthy subjects as controls, were included. Diastolic and systolic function of the LV were evaluated by doppler echocardiography, tissue Doppler imaging, and speckle tracking echocardiography. BMI, fasting blood sugar, HbA1c, were significantly higher in diabetic cases. There were no significant differences between cases and controls with regard to LV diastolic dysfunction.
The findings of this study are in agreement with previous researches. Romanens et al. reported no evidence of diastolic LV dysfunction in normotensive patients with type I diabetes mellitus [11]. Takenaka et al. reported a normal diastolic function of LV in their study of 60 normotensive diabetic patients [12]. They used transmitral Doppler flow velocity to assess LV filling state. Cosson et al. reported non significant difference with regard to diastolic filling of the LV in 48 normotensive diabetic patients who were free from diabetic microangiopathic complications. They used only lateral mitral annular e’ and E/e’ lateral as indices of TDI in the evaluation of diastolic function of the LV [13].
Inversely, other studies reported an abnormal LV filling in diabetic patients. Patil et al. reported 53% out of 127 diabetic patients had diastolic dysfunction [14]. Zahiti et al studied 150 diabetic normotensive patients and 150 control subjects. They reported reduced E’ but didn’t include E/ e’ ratio and LAVI in their study [15]. Vinereanu et al. also reported similar results; in addition, they showed significant correlation between the presence of diastolic impairment and duration of DM [16]. Murat Araz et al. used E/A ratio (E/A ratio <1) parameter to diagnose diastolic dysfunction, however, their study included hypertensive diabetic patients [17]. Boyer et al. reported diastolic dysfunction in 75% of their diabetic normotensive patients. They excluded valvular heart disease by conventional echocardiography and ischemic heart disease by stress echocardiography [18]. Mishra et al. studied asymptomatic normotensive 71 patients with type 2 DM. They reported altered LV diastolic function as compared with healthy subjects [19].
These differences between those studies might be explained by variations in clinical selection of cases, and in echocardiographic indices that were used to evaluate diastolic function. Some studies used transmitral flow which is affected by LV loading conditions and heart rate, others used TDI mitral annular velocities and pulmonary venous flow.
Regarding the evaluation of LV function by speckle tracking echocardiography in the current study, longitudinal strain was significantly lower in diabetes patients as compared to the control. These findings are in agreement with Zoroufian et al., who reported also a significant reduction in longituidenal strain of LV in diabetic patients as compared to the control (-15 ± 2.9 versus -18.3 ± 1.7). They rolled out ischemic heart disease in their patients by coronary angiography but we didn’t. Furthermore, Zoroufian et al. reported reduced longitudinal strain in diabetic patients with eviedence of diastolic dysfunction and in those with normal LV filling [20]. Ng AC et al. evaluated LV function by longitudinal, radial and circumferential strains in diabetic patients. They reported significant impairment of longitudinal strain in diabetic patients, but not radial strain and circumferential strains [21]. Enomoto et al. reported significant reduction of longitudinal strain and inner radial strain in diabetic patients with or without hypertension as compared with healthy subjects, but outer radial and circumferential starins were not different [22]. In our study, we didn’t assess radial and circumferential strains, and patients with a history of hypertension were excluded. Conte et al. assessed LV function by by longitudinal, radial and circumferential strains in diabetic patients [23]. They classified their patients into two groups according to BMI. They reported significant reduction in longitudinal and radial but not circumferential strains in patients had BMI more than 30 Kg/m2 as compared to both those had BMI more than 30 Kg/m2 and healthy subjects. In our study, the diabetic group had significantly hieher BMI than controls (28.2 ± 3.3 versus 25.4 ± 2.9 Kg/m2), and the presence of DM was the independent factor for reduced longitudinal strain after adjustment for BMI.
The current study demonstrates negative correlation between longitudinal strain and plasma level of HBA1C and duration of diabetes. future studies are recommended to strength this issue, therefore, the better control of DM may delay the progression of cardiac pathology.
Study Limitations
The often association of DM with hypertension and ischemic heart disease made the selection of asymptomatic normotensive ones not easily with enrollment of small number of patients. Further studies of larger samples are required to support the role of speckle tracking echocardiography in early recognition of myocardial dysfunction in the diabetic persons. Some diabetic normotensive patients were excluded from the study because of the poor echogenic image of the subendocardial layer that affect recording of longitudinal strain. Estimation of LV filling pressure by invasive cardiac catheterization to diagnose diastolic dysfunction or to exclude the coronary artery disease was difficult as our patients were asymptomatic without any cardiovascular comorbidity.
Conclusion
In asymptomatic normotensive patients with type 2 DM and preserved LVEF, the LV GLS was reduced, while there was no significant evidence of diastolic dysfunction.
Conflict of Interest
The authors declare that they have no conflict of interest.
Funding
This research did not receive any specific grant from any funding agency in the public, commercial or not-for-profit sector.
References
- Voors AA, van der Horst IC (2011) Diabetes: A driver for heart failure. Heart 97: 774-780.
- Di Cori A, Di Bello V, Miccoli R, Talini E, Palagi C, et al. (2007) Left ventricular function in normotensive young adults with well-controlled type 1 diabetes mellitus. Am J Cardiol 99: 84-90.
- Htay T, Mehta D, Heo J, Iskandrian AE (2005) Left ventricular function in patients with type 2 diabetes mellitus. Am J Cardiol 95: 798-801.
- Unger RH (2002) Lipotoxic diseases. Ann Rev Med 53: 319-336.
- Watts GF, Marwick TH (2003) Ventricular dysfunction in early diabetic heart disease: detection, mechanisms and significance. Clin Sci 105: 537-540.
- Nagueh SF, Smiseth OA, Appleton CP, Byrd BF 3rd, Dokainish H, et al. (2016) Recommendations for the Evaluation of Left Ventricular Diastolic Function by Echocardiography: An Update from the American Society of Echocardiography and the European Association of Cardiovascular Imaging. Eur Heart J Cardiovasc Imaging 17: 1321-1360.
- Definition and diagnosis of diabetes and intermediate hyperglycemia (2006) Geneva: WorldHealth Organization.
- Lang RM, Badano LP, Mor-Avi V, Afilalo J, Armstrong A, et al. (2015) Recommendations for Cardiac Chamber Quantification by Echocardiography in Adults: An Update from the American Society of Echocardiography and the European Association of Cardiovascular Imaging. J Am Soc Echocardiogr 28: 1-39.
- Belghitia H, Brette S, Lafitte S, Reant P, Picard F, et al. (2008) Automated function imaging: a new operator-independent strain method for assessing left ventricular function. Arch Cardiovasc Dis 10: 163-169.
- Raev DC (1994) Which left ventricular function is impaired earlier in the evolution of diabetic cardiomyopathy? An echocardiographic study of young type I diabetic patients. Diabetes Care 17: 633-639.
- Romanens M, Fankhauser S, Saner B, Michaud L, Saner H (1999) No evidence for systolic or diastolic left ventricular dysfunction at rest in selected patients with long-term type I diabetes mellitus. Eur J Heart Fail 1:169-175.
- Takenaka K, Sakamoto T, Amano K, Oku J, Fujinami K, et al. (1988) Left ventricular filling determined by Doppler echocardiography in diabetes mellitus. Am J Cardiol 61: 1140-1143.
- Cosson S, Kevorkian JP, Virally ML, Henry P, Laloi-Michelin M, et al. (2007) No evidence for left ventricular diastolic dysfunction in asymptomatic normotensive type 2 diabetic patients: A case-control study with new echocardiographic techniques. Diabetes Metab 33: 61-67.
- Patil VC, Patil HV, Shah KB, Vasani JD, Shetty P (2011) Diastolic dysfunction in asymptomatic type 2 diabetes mellitus with normal systolic function. Cardiovasc Dis Res4: 213-222.
- Zahiti BF, Gorani DR, Gashi FB, Gjoka SB, Zahiti LB, et al. (2013) Left ventricular diastolic dysfunction in asymptomatic type 2 diabetic patients: detection and evaluation by tissue Doppler imaging. Acta Inform Med 21: 120-123.
- Vinereanu D, Nicolaides E, Tweddel AC, Mädler CF, Holst B, et al. (2003) Subclinical left ventricular dysfunction in asymptomatic patients with type II diabetes mellitus, related to serum lipids and glycated haemoglobin. Clin Sci105: 591-599.
- Araz M, Bayrac A, Ciftci H (2015) The impact of diabetes on left ventricular diastolic function in patients with arterial hypertension. North Clin Istanb 3: 177-181.
- Boyer JK, Thanigaraj S, Schechtman KB, Perez JE (2004) Prevalence of ventricular diastolic dysfunction in asymptomatic, normotensive patients with diabetes mellitus. Am J Cardiol 93: 870-875.
- Mishra TK, Rath PK, Mohanty NK, Mishra SK (2008) Left ventricular systolic and diastolic dysfunction and their relationship with microvascular complications in normotensive, asymptomatic patients with type 2 diabetes mellitus. Indian Heart J 60: 548-553.
- Zoroufian A, Razmi T, Taghavi-Shavazi M, Lotfi-Tokaldany M, Jalali A (2014) Evaluation of subclinical left ventricular dysfunction in diabetic patients: longitudinal strain velocities and left ventricular dyssynchrony by two-dimensional speckle tracking echocardiography study. Echocardiography 4: 456-463.
- Ng AC, Delgado V, Bertini M, van der Meer RW, Rijzewijk LJ, et al. (2009) Findings from left ventricular strain and strain rate imaging in asymptomatic patients with type 2 diabetes mellitus. Am J Cardiol 104: 1398-1401.
- Enomoto M, Ishizu T, Seo Y, Yamamoto M, Suzuki H, et al. (2015) Subendocardial Systolic Dysfunction in Asymptomatic Normotensive Diabetic Patients. Circ J 8: 1749-1755.
- Conte L, Fabiani I, Barletta V, Bianchi C, Maria CA, et al. (2013) Early Detection of Left Ventricular Dysfunction in Diabetes Mellitus Patients with Normal Ejection Fraction, Stratified by BMI: A Preliminary Speckle Tracking Echocardiography Study. J Cardiovasc Echogr 3: 73-80.
 Spanish
  Chinese
  Russian
  German
  French
  Japanese
  Portuguese
  Hindi
Hindi 