Research Article, Int J Cardiovasc Res Vol: 0 Issue: 0
The Effect of Exercise on the Timing of Aortic Valve Closure with Respect to the ECG Tracing
Yurie Obata1, Pavel Ruzankin2,3, Allan Gottschalk1, Dan E Berkowitz1, Jochen Steppan1 and Viachaslau Barodka1*
1Department of Anesthesiology and Critical Care Medicine, The Johns Hopkins University School of Medicine, Baltimore, USA
2Sobolev Institute of Mathematics, Novosibirsk, Russia
3Novosibirsk State University, Novosibirsk, Russia
*Corresponding Author : Viachaslau Barodka, M.D
Division of Cardiac Anesthesia, Department of Anesthesiology and Critical Care Medicine The Johns Hopkins University School of Medicine, Zayed Tower 6208C, 1800 Orleans Street, Baltimore, MD 21287, USA
Tel: 410-955-7519
Fax: 410-955-0994
E-mail: vbarodk1@jhmi.edu.
Received Date: May 29, 2017 Accepted Date: July 17, 2017 Published Date: July 21, 2017
Citation: Obata Y, Ruzankin P, Gottschalk A, Berkowitz DE, Steppan J, et al. (2017) The Effect of Exercise on the Timing of Aortic Valve Closure with Respect to the ECG Tracing. Int J Cardiovasc Res 6:4. doi: 10.4172/2324-8602.1000318
Abstract
Objective: The temporal relationship between electrical repolarization of the heart and mechanical relaxation is not well quantified. In this study we examined the timing of the aortic valve (AoV) closure with respect to the electrical repolarization at rest and following exercise in young healthy subjects.
Methods: We measured the period from the apex of the T wave (aT) to the beginning of the second heart sound (S2-aT) and the period from the apex of the T wave to the end of the T wave (eT-aT).
Results: At rest, AoV closure occured immediately after the end of the T wave as evidenced by a ratio of (S2-aT)/(eT-aT) greater than 1. The mean time delay between the end of the T wave and AoV closure was 15.5ms which was only 4% of the QT interval duration. After exercise, AoV closure occured just before the end of the T wave (but after the peak of the T wave) as evidenced by the ratio of (S2-aT)/(eT-aT) being between 0 and 1. The mean time difference between the end of the T wave and AoV closure was - 4.4ms, which was only 1% of the QT interval duration. In combination, the QT and RR intervals account for some of the inter-subject variability.
Conclusions: AoV closure closely approximates the end of T wave in healthy subjects indicating existence of electromechanical coupling during left ventricular relaxation. Clinically the end of T wave could, therefore, be used as a surrogate for AoV closure in healthy subjects.
Keywords: Electromechanical coupling, Aortic valve closure, T wave, Exercise, Second heart sound, QT interval, RR interval
Introduction
It has been proposed that the end of the T wave on the electrocardiogram (ECG) might coincide with aortic valve (AoV) closure [1]. However, a recent study demonstrated significant variability in the timing of AoV closure with respect to the ECG, when assessed by transthoracic echocardiography (TTE) [2].
Excitation-contraction coupling during systole is well described [3]. Electrical depolarization of the ventricles opens voltage gated Ca2+ channels (ICa), which in turn trigger Ca2+ release from the sarcoplasmic reticulum. Increased intracellular Ca2+ level lead to mechanical contraction and ejection of the ventricular blood that constitutes the stroke volume. However, it is less well established how mechanical relaxation of the ventricles coincides with the electrical repolarization of the heart, latter of which mainly corresponds to the T wave of the ECG. Relaxation is triggered by the reuptake of Ca2+ into the sarcoplasmic reticulum, decreasing intracellular Ca2+ levels, and releasing of Ca2+ from myofilaments. As intracellular Ca2+ concentration decreases repolarization is triggered by ICa inactivation and opening of voltage-gated K+ (Kv) channels in the myocardium cell membrane [4,5]. Therefore, the existence of a precise electromechanical coupling during diastole similar to mechanical systole is less defined. Moreover, the extent and source of the intersubject variability are not clear. Consequently, the ECG waveform is not currently used to predict timing of AoV closure.
In the current study, we examined the timing of AoV closure with respect to the simultaneously recorded ECG tracing in young healthy subjects free of cardiovascular disease at rest and after exercise. Our goal was to obtain insight into the timing of electromechanical coupling during relaxation and to quantify inter subject variability.
Materials and Methods
Subjects
This study was approved by The Johns Hopkins Medicine Institutional Review Boards (IRB00074229). Inclusion criteria were healthy adults, age 21-30 years, both genders. Exclusion criteria were subject refusal to participate, known cardiovascular disease of any kind (including hypertension), and pregnancy.
Study protocol
A standard 3 lead ECG was used for continuous monitoring of the ECG. We utilized clinically used standard lead locations as suggested by the American Heart Association (AHA) Scientific Statement on Practice Standards for Electrocardiographic Monitoring in Hospital Settings [6]. More specifically, and in accordance with the AHA Scientific Statement, we used the Mason and Likar variation of the standard limb electrodes [7]. An electronic stethoscope (Thinklabs One, ThinkLabs, CO, USA) was placed on the second right intercostal spaces at the right sternal border to record heart sounds. The start of the second heart sound (S2) on the electronic phonocardiogram was used as a marker of AoV closure [8,9]. We simultaneously recorded lead II of the ECG and the phonocardiogram for 1 minute in the supine position. Electronic stethoscope and wires to the ECG stickers were removed from the subjects and subjects were required to perform 30 squats. The electronic stethoscope and ECG wires were then reattached to the subjects at the original locations and the identical measurements were performed for 1 minute in the supine position. All data for the ‘post-exercise’ portion were collected within 3 minutes of the subjects completing 30 squats.
The ECG and phonocardiogram were simultaneously digitally converted at 1 kHz (PowerLab4/26, ADInsruments, Australia) and recorded in the LabChart software (LabChart 8, Ad Instruments, Australia).
Data extraction
Data extraction was performed by a computer-automated technique as described previously [10,11]. Briefly, we applied standard 60Hz notch and high-pass filters followed by a smoothing procedure.
We then extracted the peak of the Q and T wave based on a published algorithm by Pan and Tompkins [10]. The end of T wave was extracted based on an algorithm proposed by Lepeschkin and Surawicz [11]. The beginning of S2 on the phonocardiogram was extracted as the first high frequency vibration of the aortic component of S2 [8]. The waveforms underwent manual visual inspection. Only waveforms with clear and distinct second heart sounds were included in the analysis.
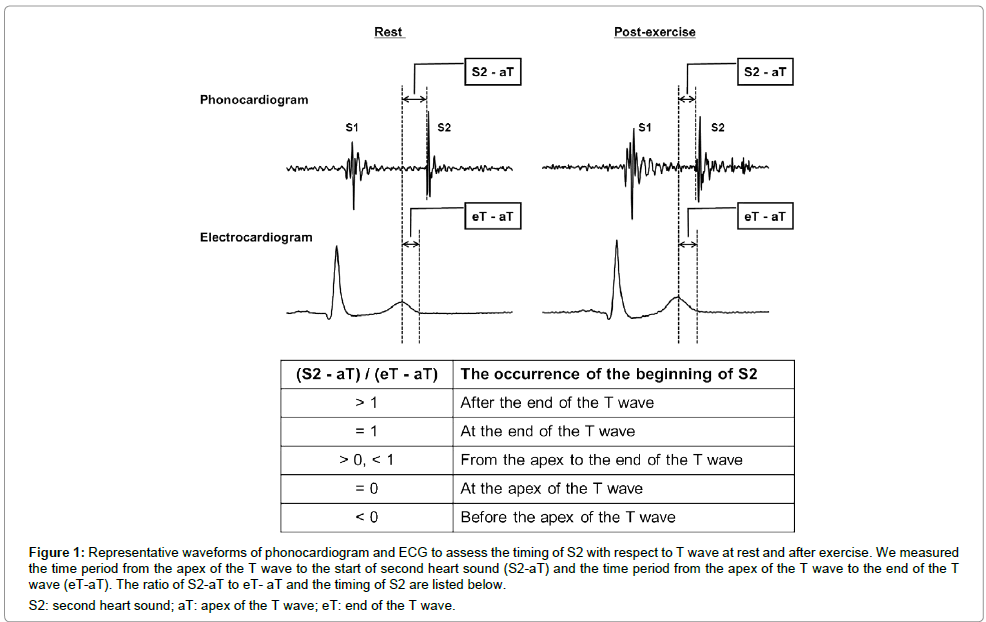
We measured the time interval from the apex of the T wave to the start of second heart sound (S2-aT) and the time interval from the apex of the T wave to the end of the T wave (eT-aT). Then we calculated the ratio of S2-aT to eT-aT to assess the timing of the beginning of S2 in reference to the apex and the end of the T wave (Figure 1). We also extracted the time interval from eT to S2 (S2-eT) expressed as an absolute value and as a percentage of the corresponding QT interval: (S2-eT)/QT%.
Figure 1: Representative waveforms of phonocardiogram and ECG to assess the timing of S2 with respect to T wave at rest and after exercise. We measured the time period from the apex of the T wave to the start of second heart sound (S2-aT) and the time period from the apex of the T wave to the end of the T wave (eT-aT). The ratio of S2-aT to eT- aT and the timing of S2 are listed below.
S2: second heart sound; aT: apex of the T wave; eT: end of the T wave.
Statistical analysis
A mixed model with random intercepts was used to assess the effect of exercise on the ratio of (S2-aT)/(eT-aT). The same analysis was performed for the time interval of S2-eT and (S2-eT)/QT%. A similar approach was also used to assess if all baseline values (variables at rest) affected the degree of change after exercise and to assess intra and inter subject variability. Furthermore, we used this model to assess whether the RR interval or the QT interval duration affected the degree of change after exercise compared to rest values. All analysis was performed in STATA 13.1 (StataCorp LLC, TX, USA). All significance levels reported were obtained from two-tailed tests. Results were considered significant for p ≤ 0.05. GraphPad Prism version 7 (GraphPad Software, CA, USA) was used to construct the figures.
Results
We enrolled 8 healthy volunteers. One subject was excluded due to the inability to finish the exercise portion of the study protocol. A total of 464 heartbeats at rest and 681 heartbeats after exercise from 7 subjects were used for the analysis. The mean (SD) number of heartbeats per subject was 66 (24) at rest and 97 (41) after exercise.
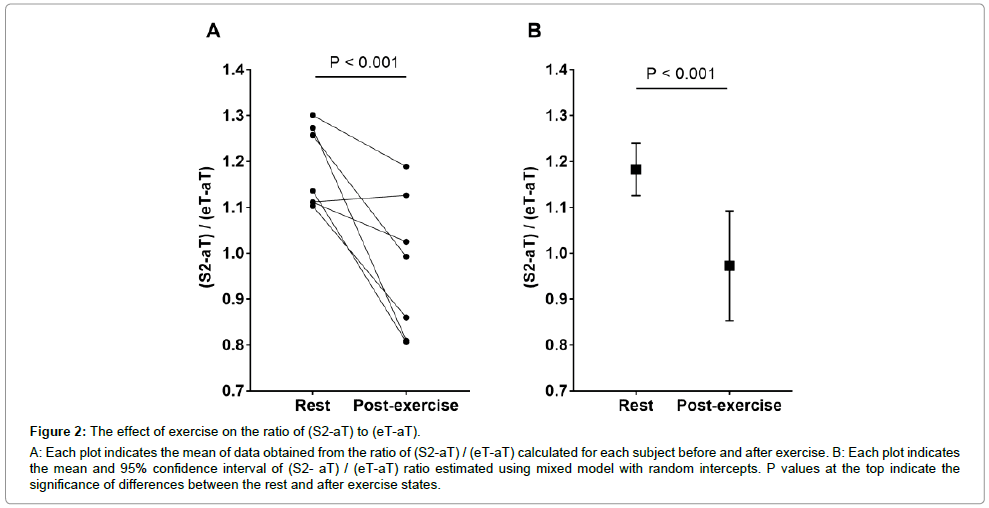
Figure 2A shows the ratio of (S2-aT)/(eT-aT) at rest and post-exercise of all 7 subjects. Figure 2B shows the mean and 95% confidence interval (CI) of (S2-aT)/(eT-aT). Taken into account the individual subject variability the ratio of (S2-aT)/(eT-aT) was 1.18 (95%CI: 1.13 to 1.24) at rest and decreased to 0.97 (95%CI: 0.85 to 1.09) after exercise (Table 1). Despite the individual variations, a highly significant change was revealed between (S2-aT)/(eT-aT), measured at rest and post-exercise (p<0.001) with only a modest number of subjects, demonstrating that the phenomenon reported appears to be fairly robust. The degree of change between the ratio measured at rest and the one after exercise was not associated with the baseline value at rest (p=0.37).
Figure 2: The effect of exercise on the ratio of (S2-aT) to (eT-aT).
A: Each plot indicates the mean of data obtained from the ratio of (S2-aT) / (eT-aT) calculated for each subject before and after exercise. B: Each plot indicates the mean and 95% confidence interval of (S2- aT) / (eT-aT) ratio estimated using mixed model with random intercepts. P values at the top indicate the significance of differences between the rest and after exercise states.
| Rest | After exercise | p value | |
|---|---|---|---|
| (S2-aT) / (eT-aT) | 1.18 (95%CI: 1.13 to 1.24) | 0.97 (95%CI: 0.85 to 1.09) | p<0.001 |
| S2-eT (ms) | 15.5 (95%CI: 11.0 to 20.0) | -4.4 (95%CI: -13.8 to 5.0) | p<0.001 |
| (S2-eT) / QT (%) | 4.25 (95%CI: 2.92 to 5.58) | -1.16 (95%CI: -3.98 to 1.66) | p<0.001 |
CI: confidence interval; S2: second heart sound; aT: apex of the T wave; eT: end of the T wave.
Table 1: Mean (95%CI) of (S2-aT)/(eT-aT), S2-eT (ms) and (S2-eT)/QT (%) at rest and after exercise.
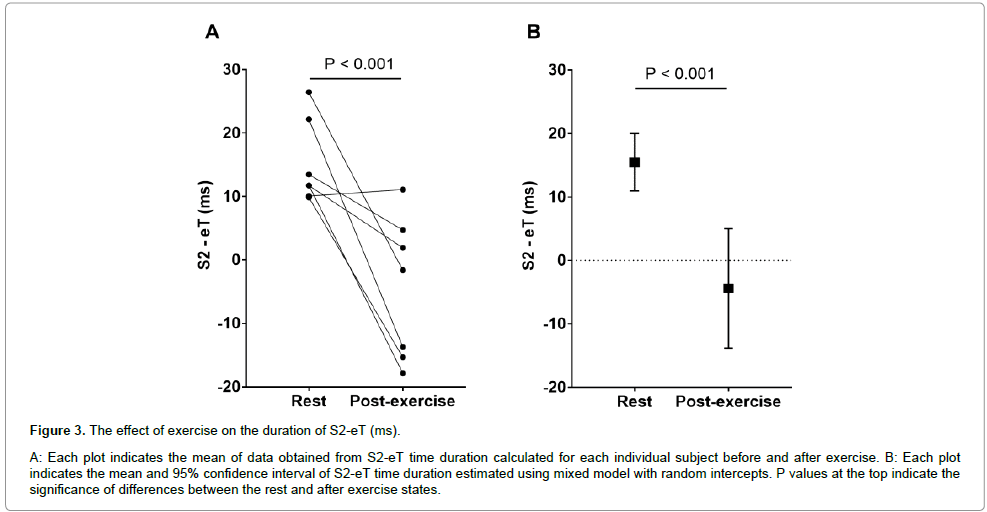
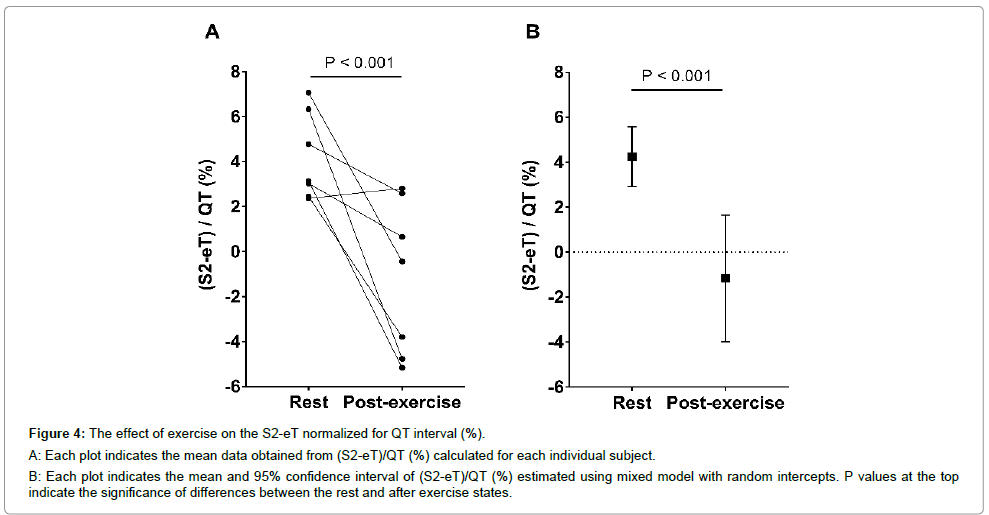
The same analysis was performed for the absolute S2-eT time duration (Figure 3) and S2-eT normalized for QT duration, (S2-eT)/ QT% (Figure 4). Taken into account the individual subject variability the duration of S2-eT was 15.5 ms (95%CI: 11.0 to 20.0 ms) at rest and -4.4 ms (95%CI: -13.8 to 5.0 ms) after exercise (Figure 3B and Table 1). A significant change was observed between the S2-eT time duration at rest and post-exercise (p<0.001). The normalized duration of (S2-eT)/QT% was 4.25% (95%CI: 2.92% to 5.58%) at rest and -1.16% (95%CI: -3.98% to 1.66%) after exercise (Figure 4B and Table 1). A significant change was observed between (S2-eT)/QT%, measured at rest and post-exercise (p<0.001). The degree of change between (S2-eT)/QT% measured at rest and the one after exercise was not associated with the baseline value (p=0.16).
Figure 3: The effect of exercise on the duration of S2-eT (ms).
A: Each plot indicates the mean of data obtained from S2-eT time duration calculated for each individual subject before and after exercise. B: Each plot indicates the mean and 95% confidence interval of S2-eT time duration estimated using mixed model with random intercepts. P values at the top indicate the significance of differences between the rest and after exercise states.
Figure 4: The effect of exercise on the S2-eT normalized for QT interval (%).
A: Each plot indicates the mean data obtained from (S2-eT)/QT (%) calculated for each individual subject.
B: Each plot indicates the mean and 95% confidence interval of (S2-eT)/QT (%) estimated using mixed model with random intercepts. P values at the top indicate the significance of differences between the rest and after exercise states.
We then determined whether the observed differences were dependent on the RR interval and QT interval, individually and together. Our analysis related the intervals for each heartbeat as opposed to using average values for each subject. Heart rate as reflected by the RR interval was not explaining differences between rest and exercise (p=0.14). However, the QT interval by itself was highly significant and indicates that as the QT interval increases the relative AoV closure occurs earlier (p<0.001). Further, when both QT and RR intervals were included both significantly contributed to the model (p<0.001 and p=0.004 respectively). In this model an increase in the QT interval signals earlier relative AoV closure, while an increase in the RR interval indicates a relative delay in AoV closure.
Discussion
In this study we examined the timing of the AoV closure with respect to the electrical repolarization at rest and following exercise in young healthy subjects. We found that at rest AoV closure occurs immediately after the end of the T wave as evidenced by a ratio of (S2-aT)/(eT-aT) greater than 1. The mean time delay between the end of the T wave and AoV closure was 15.5 ms which was only 4% of the QT interval duration. We also demonstrate that after exercise, AoV closure occurs just before the end of the T wave (but after the peak of the T wave) as evidenced by the ratio of (S2-aT)/(eT-aT) being between 0 and 1. The mean time difference between the end of the T wave and AoV closure is -4.4 ms, which is only 1% of the QT interval duration. In combination, the QT and RR intervals account for some of the inter-subject variability. In particular, as the QT interval lengthens, AoV closure occurs earlier, whereas a longer RR interval is associated with delayed AoV closure relative to the end of the T wave.
Timing of AoV closure depends on the diastolic pressure gradient between the aorta and the left ventricle (LV) [12]. Hence, the exact timing depends on peripheral vascular resistance, mean arterial pressure, and the velocity at which the LV relaxes. Our finding that AoV closure coincides with the end of the T wave provides evidence for the existence of the electromechanical and ventricular-vascular coupling during diastole. From an electrophysiological point of view, the T wave represents the time point when all myocardial cells undergo repolarization and stop contracting. At that moment in time the LV is already past its peak contraction and the LV pressure is decreasing [13,14].
Exercise triggers multiple cardiovascular responses aimed at increasing oxygen delivery. Heart rate, stroke volume, and cardiac output increase mainly due to sympathetic activation [15]. Indeed, it is known that exercise is accompanied by increasing circulating levels of norepinephrine and epinephrine. [16,17]. Blood pressure can increase or remain the same due to idiosyncratic changes in peripheral vascular resistance in different vascular beds [18,19]. Our finding that the aortic valve closes before the end of the QT interval after exercise might be also be explained by the effects of catecholamines. While we did not obtain any cellular data or circulating catecholamine levels, we speculate that the most likely explanation for our finding is the effect of β-adrenergic stimulation on the action potential duration and increased rate of LV relaxation due to its effect on sodium, potassium, and calcium channels [20]. Increased β-adrenergic stimulation will shorten the cellular action potential duration and increase relaxation by increasing the calcium transient (accelerating ICa inactivation), reducing the inward Na+- Ca2+ exchange current, and enhancing both rapid and slow delayed rectifier K+ currents (IKr and IKs) [4]. β-adrenergic stimulation also activates the sarcoplasmic reticulum Ca2+ ATPase (SERCA) and increases the rate of Ca2+ removal and consequently, the rate of cardiac muscle relaxation [21]. Therefore, both LV relaxation and the QT interval (surrogate for the action potential duration) are coupled during exercise. Previous studies showed that both isoproterenol and adrenaline administration shortens the action potential duration in humans and leads to QT shortening as heart rate increases [4,22]. Recently, our own group reported that QT interval shortening occurs mostly due to the shortening of the ST segment as heart rate increases secondary to sympathetic activation [23].
Several studies have examined the relationships between ECG tracing and AoV closure. De Caprio et al. studied the effects of adrenergic activity on the timing of AoV closure in reference to the origin of the QRS complex and the end of the T wave by analyzing the ratio of QT interval to QS2 (the time period from the start of QRS complex to the start of S2) [24]. Consistent with our results, De Caprio et al. showed that at rest the aortic valve closes after the end of the T wave in young healthy subjects. Consistent to our findings, they showed that the aortic valve closes sooner with respect to the end of the T wave during physical exercise while subjects were in the upright position. In their study, they used manual data extraction and mean values from several heart beats to calculate the time delay between AoV closure and the end of the T wave. Boudoulas et al. studied the effect of catecholamines and arterial pacing on the ratio of QT interval to QS2 [25]. They showed that as heart rate increases during isoproterenol infusion, the aortic valve closed sooner compared to end of T wave. Interestingly an increase in heart rate with atrial pacing did not change the timing of AoV closure compared to the end of T wave, indicating that β-adrenergic stimulation is responsible for AoV closure before the end of the T wave.
In our study we examined the ratio of (S2-aT)/(eT-aT) to clarify the timing of AoV closure specifically in reference to the T wave for multiple individual heartbeats. In addition, we quantified the exact time duration between AoV closure and the end of the T wave at rest and after exercise, and expressed it as a % of QT interval. We showed that there is significant individual subject variability which can be explained to a large extent by QT interval duration and heart rate.
Importantly, at rest the observed time delay between the end of T and AoV closure was 15.5ms, which was only 4.25% of the QT interval. After exercise the time delay between AoV closure and the end of the T wave was 4.4ms, which was only 1.16% of the QT interval. These time delays are small enough to justify using the end of the T wave as a surrogate for AoV closure in most clinical applications (in healthy subjects).
Several studies have examined the timing of AoV closure with respect to QT interval in patients with cardiovascular diseases. Boudoulas et al. showed that prolongation of the QT interval relative to QS2 (AoV closure preceding the end of the T wave) was associated with increase in 5 year mortality in patients with coronary artery disease [26]. The prolongation of the QT interval occurred mostly after myocardial infarction, indicating a disruption of normal electromechanical coupling during relaxation. Schimpf et al. investigated the echocardiogram derived AoV closure in reference to the end of T wave in short QT syndrome (SQTS) patients and in gender- and age-matched control subjects [1]. They showed that end of T wave preceded the closure of the aortic valve by a mean (SD) of 111 (30) ms in patients with SQTS, whereas in the control group AoV closure occurred during the terminal portion of the T wave (-12 (11) ms), which is consistent with our findings. Their results suggest that electromechanical coupling during LV relaxation is disrupted (electromechanical dissociation) in patients with SQTS.
Our data are consistent with that of Gill et al. who examined the timing of AoV closure measured by TTE in reference to the ECG tracing in randomly selected echocardiographic studies [2]. They demonstrated that AoV closure occurred no earlier than the peak of the T wave and, most commonly, after the peak of the T wave (peak or midpoint of T wave: 12%, down slope of T wave: 17%, end of T wave: 50%, beyond end of T wave: 21%). Their data was extracted from clinical patients at rest, with the only patient characteristics presented being age and gender. They did measure all data manually and did not present actual time delays.
Our study has several limitations. The study was conducted only in young healthy volunteers. All of them had normal T wave morphologies. Exact measurement of time intervals can be difficult in patients with cardiovascular diseases which might have heterogeneous T wave morphologies (bifid, inverted or flat) or the presence of U waves. We standardized amount of exercise (30 squats) but not exercise intensity. Also we did not have ability to measure baseline or post exercise oxygen consumption. Hence same amount of exercise might have elicited different hemodynamic effects in different subjects. The number of subjects included in the study was small. However, we used a statistical approach that accounts for individual subject variability. Finally, we did not measure any additional hemodynamic parameters in our subjects and the final measurements were performed after exercise was concluded. Therefore, there might be a number of hemodynamic responses such as hysteresis effects, which are affected by the time between exercise and our measurements. To minimize these effects we endeavored to acquire all data immediately after exercise was completed, so that the only time delay was due to sensor placement.
Conclusion
In conclusion, AoV closure closely approximates the end of the T wave (within 1-4% of the QT interval) in healthy subjects indicating electromechanical coupling during LV relaxation. On average, AoV closure occurs 15 ms after the end of the T wave at rest and 4 ms prior to end of the T wave after exercise. There is considerable inter-subject variability mostly explained by the QT and RR intervals. Clinically, the end of the T wave could potentially be used as a surrogate for AoV closure at least in healthy subjects.
Grants
The authors received no specific funding for this work.
Disclosures
The authors declare no conflict of interest.
References
- Schimpf R, Antzelevitch C, Haghi D, Giustetto C, Pizzuti A, et al. (2008) Electromechanical coupling in patients with the short QT syndrome: further insights into the mechanoelectrical hypothesis of the U wave. Heart Rhythm 5: 241-245.
- Gill H, Hoffmann A (2010) The timing of onset of mechanical systole and diastole in reference to the QRS-T complex: a study to determine performance criteria for a non-invasive diastolic timed vibration massage system in treatment of potentially unstable cardiac disorders. CardiovascEng: 235-245.
- Pfeiffer ER, Tangney JR, Omens JH, McCulloch AD (2014) Biomechanics of cardiac electro-mechanical coupling and mechanoelectric feedback. J BiomechEng 136: 021007.
- Taggart P, Sutton P, Chalabi Z, Boyett MR, Simon R, et al. (2003) Effect of adrenergic stimulation on action potential duration restitution in humans. Circulation 107:285-289.
- Nerbonne JM, Kass RS (2005) Molecular physiology of cardiac repolarization. Physiol Rev 85:1205-1253.
- Drew BJ, Califf RM, Funk M, Koufman ES, Krucoff MW (2004) Practice Standards for Electrocardiographic Monitoring in Hospital Settings: An American Heart Association Scientific Statement From the Councils on Cardiovascular Nursing, Clinical Cardiology, and Cardiovascular Disease in the Young: Endorsed by the International Society of Computerized Electrocardiology and the American Association of Critical-Care Nurses. Circulation 110:2721-2746.
- Mason RE, Likar I (1966) A new system of multiple-lead exercise electrocardiography. Am Heart J 71:196-205.
- Kupari M (1983) Aortic valve closure and cardiac vibrations in the genesis of the second heart sound. Am J Cardiol 52: 152-154.
- Aase SA, StøylenA, Ingul CB, Frigstad S, Torp H (2006) Automatic timing of aortic valve closure in apical tissue Doppler images. Ultrasound in Medicine &Biol 32:19-27.
- Pan J, Tompkins WJ (1985) A real-time QRS detection algorithm. IEEE Trans Biomed Eng 32: 230-236.
- Lepeschkin E, Surawicz B (1953) The duration of the Q-U interval and its components in electro-cardiograms of normal persons. Am Heart J 46:9-20.
- Bäck M, Gasser TC, Michel JB, Caligiuri G (2013) Biomechanical factors in the biology of aortic wall and aortic valve diseases. Cardiovascular Research 99:232-241.
- Mitchell JR, Wang JR (2014) Expanding application of the Wiggers diagram to teach cardiovascular physiology. AdvPhysiolEduc 38:170-175.
- Weisfeldt ML, Scully HE, Frederiksen J, Rubenstein JJ, Pohost GM, et al. (1974) Hemodynamic determinants of maximum negative dP-dt and periods of diastole. Am J Physiol 227: 613-621.
- Christensen NJ, Galbo H (1983) Sympathetic nervous activity during exercise. Annu Rev Physiol 45: 139-153.
- Ghimire LV, Kohli U, Li C, Sofowora GG, Muszkat M, et al. (2012) Catecholamine pathway gene variation is associated with norepinephrine and epinephrine concentrations at rest and after exercise. PharmacogenetGenomics 22:254-260.
- Bracken RM, Linnane DM, Brooks S (2009) Plasma catecholamine and nephrine responses to brief intermittent maximal intensity exercise. Amino Acids 36:209-217.
- Sharman JE, Lim R, Qasem AM, Coombes JS, Burgess MI, et al. (2006) Validation of a generalized transfer function to noninvasively derive central blood pressure during exercise. Hypertension 47:1203-1208.
- Naka KK, Tweddel AC, Parthimos D, Henderson A, Goodfellow J (2003) Arterial distensibility: acute changes following dynamic exercise in normal subjects. American Journal of Heart CircPhysiol 284: H970-H978.
- Bravený P (2002) Heart, calcium and time. ExpClinCardiol 7:3-6.
- MacLennan DH, Kranias EG (2003) Phospholamban: a crucial regulator of cardiac contractility. Nature Reviews Molecular Cell Biology 4: 566-577.
- Magnano AR, Talathoti N, Hallur R, Bloomfield DM, Garan H (2006) Sympathomimetic infusion and cardiac repolarization: the normative effects of epinephrine and isoproterenol in healthy subjects. J CardiovascElectrophysiol 17:983-989.
- Obata Y, Ruzankin P, Ong QJ, Berkowitz DE, Berger RD, et al. (2017) The impact of posture on the cardiac depolarization and repolarization phases of the QT interval in healthy subjects. J Electrocardiol.
- De Caprio L, Ferro G, Cuomo S, Volpe M, Artiaco D, et al. (1984) QT/QS2 ratio as an index of autonomic tone changes. Am J Cardiol 53:818-822.
- Boudoulas H, Geleris P, Lewis RP, Leier CV (1981) Effect of increased adrenergic activity on the relationship between electrical and mechanical systole. Circulation 64:28-33.
- Boudoulas H, Sohn YH, O'Neill W, Brown R, Weissler AM (1982) The QT >QS2 syndrome: a new mortality risk indicator in coronary artery disease. Am J Cardiol 50: 1229-1235.
 Spanish
  Chinese
  Russian
  German
  French
  Japanese
  Portuguese
  Hindi
Hindi 