Spanish
  Chinese
  Russian
  German
  French
  Japanese
  Portuguese
  Hindi
Hindi Research Article, Res J Econ Vol: 2 Issue: 1
The Effect of Monetary Policy Shocks on the Real Economy: A FAVAR Approach
Sima Siami-Namini*
Department of Agricultural and Applied Economics, Texas Tech University, USA
*Corresponding Author : Sima Siami-Namini, Ph.D Student and Graduate Research Assistant
Department of Agricultural and Applied Economics, Texas Tech University, USA
E-mail: sima.siami-namini@ttu.edu
Received: December 18, 2017 Accepted: January 05, 2018 Published: January 12, 2018
Citation: Siami-Namini S (2018) The Effect of Monetary Policy Shocks on the Real Economy:A FAVAR Approach. Res J Econ 2:1.
Abstract
One of the most important policy issues we face today is the impact of monetary policy shocks on the real economy. This issue is of relevance from an economic point of view, but it is also relevant from a political point of view. Also, the shock of oil price is one of the important factors that have affected the world economy since the 1970s. This article examines the effects of monetary policy shocks and oil price shocks on the real economy. I use the factor augmented vector autoregressive (FAVAR) approach and compare the results with the vector auto-regression (VAR) model by using Iran quarterly data for the period 1988: Q2 to 2011: Q3. The results of FAVAR models are consistent with theory and better than VAR models. VAR models show the existence of price and liquidity puzzles while FAVAR models did not provide any evidence of puzzles.
Keywords: Monetary policy shocks; Oil price shocks; Vector auto-regression (VAR); Factor augmented VAR (FAVAR)
Introduction
The main goals of monetary policy are to stable prices, promote the full employment level of economic growth, and moderate interest rates in the long-run. Because of difficulty in achieving the mentioned goals instantly, it is necessary for policy-makers in central banks to specify the intermediate and short-run goals such as controlling money supply or adopting an inflation targeting. So apparently, there has always been the question of whether monetary policy has any effect on the real economy?
Consequently, empirical evidence of the estimation of the influence of monetary policy shocks on the economic variables has been the open debate among the economists [1]. In analysing monetary policy shocks on the economic variables, the vector autoregression (VAR) approach is used as a standard tool which was first suggested by Sims et al. [2] and has been further developed by others such as Bernanke et al. [3], Sims et al. [4], Christiano et al. [5], Gordon et al. [6], Strongin et al. [7], Lastrapes et al. [8], Gerlach et al. [9], Leeper et al. [10], Bernanke et al. [11], Christiano et al. [12], Peersman et al. [13], Mojon et al. [14], and Angeloni et al. [15].
There are a number of issues in analysing the effects of monetary policy shocks by using a standard VAR model. The one crucial issue discusses that it is difficult to determine the most appropriate indicator of monetary policy stance. The second crucial issue debates that it is hard to identify monetary policy shocks and determine the correct model, which is limited by a small number of variables in the VAR framework. One solution of these problems is combining the VAR framework with “factor analysis”, which results in the so-called factor augmented vector autoregressive (FAVAR) approach. Factor analysis method is usually employed to reduce a large number of variables into a few numbers of factors [16,17].
The aim of this article is to employ an extension of the FAVAR approach by using quarterly data of Iran’s economy over the period from 1988: Q2 to 2011: Q3. The findings show that the impulse response functions (IRF) of a FAVAR approach provide a more relevant picture of the impacts of monetary policy shocks than a standard VAR model. In the following section, I present the empirical literature. Then, I discuss the econometric framework of a FAVAR approach using a simple economic model which lays out my estimation approach in this article. Following the literature review, I first estimate the factors by principal components and then estimate both the VAR and FAVAR models. In the next section, I provide data analysis and then present the main findings obtained from FAVAR model and compare them with the results of a standard VAR model. Finally, I conclude in the last section.
Empirical literature
Since the pioneered work of Sims et al. [2,4] and Bernanke et al. [3], the VAR approach has been extensively used as a standard method in the analysis of the influence of monetary policy shocks on economic variables. Sims et al. [4] measured the impacts of monetary policy shock in five developed countries including France, Germany, Japan, UK and the US economy. By using a standard VAR model, he found that a contractionary monetary policy shocks reduces the level of output and money supply and increases inflation. Bernanke et al. [3] measured the effects of U.S. monetary policy on real economic variables by using a standard VAR model and found that the change in federal funds rate affects the composition of bank assets.
Peersman et al. [13] measured the impacts of a euro area-wide monetary policy shocks by using a standard VAR model and found that a contractionary monetary policy shock would lead to currency appreciation and reduce the level of output, while price drop and inflation slows after several quarters. Miyao et al. [18] found that monetary policy shocks in Japan have the persistent impact on real output, and the size of the effect was strong during Japan’s bubble economy.
In using a standard VAR model with a small number of series, Bernanke et al. [19] pointed out three issues. First, since a small number of series included in a standard VAR model may not cover the full information used by policymakers in central banks, therefore, the monetary policy shocks are measured by errors. Second, in a standard VAR model, it needs to determine a series as a proxy for a theoretical concept. Third, the impulse response function (IRF) can be analyzed only for the variables which are included in a standard VAR model. Bernanke et al. [19] extracted a few common factors using 120 monthly series of the US economy for the period of 1959 to 2003. They measured the impacts of monetary policy shocks by using a standard VAR model and FAVAR approach and compared the finding of both methods. The results confirmed that there is no price puzzle using a FAVAR approach while employing a standard VAR model showed a stronger price puzzle.
Lagana et al. [20] studied the influence of monetary policy shocks in the UK economy by using a standard VAR and FAVAR models and found that a contractionary monetary policy shock would increase the price of housing and boost the stock market and therefore depreciate the value of the currency. With adding other factors to a standard VAR model, they found more important findings than benchmark VAR model. Shibamoto et al. [21] evaluated the impact of monetary policy shocks in Japan’s economy by using FAVAR approach and found that monetary policy shocks have a stronger effect on real series such as employment than industrial production.
Carvalho et al. [22] analyzed the effects of monetary policy shocks in Brazilian economy by employing FAVAR approach. Their results were consistent with the long-run neutrality of money. Soares et al. [23] measured the impacts of monetary policy shocks in Euro area by using FAVAR approach. The findings showed that the inclusion of the additional information captured by the factors into the FAVAR model reduces the price puzzle.
Kabundi et al. [24] evaluated the monetary policy shocks on economic and financial series in South Africa by estimating FAVAR model. They found that a rise in the short-run interest rate has an inverse effect on economic series such as production, utilization of productive capacity, disposable income, fixed investment, consumption expenditure and employment.
Liu et al. [25] measured the impacts of U.S. dollar appreciation on three Asian economies including Korea, Japan, and China. They included two latent factors into their FAVAR framework. The one latent factor is a country’s aggregate economic activity, which generated from a large series. The other latent factor is a global conditions index, which generated from a large series of major trading partners. The results showed that a dollar appreciation shock reduces economic activity and inflation in all countries.
Overall, the results of literature review suggest that the use of FAVAR approach has several advantages over the use of a standard VAR model as traditionally applied. One initial advantage of FAVAR approach makes it possible to obtain impulse response function (IRF) of all series used, and not just for series directly included in a standard VAR model. Another advantage suggests that there is not required to specify a series as a proxy for a theoretical concept. For instance, according to Bernanke et al. [19], it is not necessary to represent the concept of “economic activity” by selecting other series such as the industrial production index. In fact, the use of the series is not exclusive, and other ones such as employment and sales can also be included. It is, therefore, no need to rely on arbitrary choices.
Econometric framework: The FAVAR approach
The major feature of the FAVAR approach allows us to include a large number of series in the VAR framework, using “factor analysis”. According to Bernanke et al. [19], let’s consider a M×1 vector of observable economic series (Yt). Therefore, the dynamics of the economy can be analysed using a traditional VAR model as in Eq. (1):
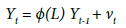 (1)
(1)
Where Ï•(L) is a lag polynomial, and νt is independently and identically distributed with mean zero and covariance Q. Let’s suppose that additional information obtained from observed variables is included in a N×1 vector Xt , where N is large and assume to be greater than the number of factors and observed variables in the FAVAR framework (Where K+M < N). Also, let’s assume that additional informational series Xt are related to the unobservable factors Ft and the observed variables Yt as in Eq. (2):
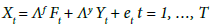 (2)
(2)
Where Ft is K×1 vector containing the K unobservable factors, Λf is a N×K matrix of factor loadings, Λy is an N×M, and the N×1 vector of error terms et are mean zero and uncorrelated. In Eq. (2), both Yt and Ft drive the dynamics of Xt. Therefore, Xt are noisy measures of the unobserved factors Ft. Stock et al. [26] refer to Eq. (2) without observable factors as a dynamic factor model. Finally, it is assumed that the joint dynamics of (Ft, Yt) can be presented as in Eq. (3):
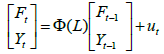 (3)
(3)
The error term ut is mean zero with covariance matrix Q. Bernanke et al. [19] called Eq. (3) as a FAVAR model. As it can be noticed, Eq. (3) is a VAR model in (Ft, Yt) which nests a traditional VAR approach represented by Eq. (1). Therefore, estimation of Eq. (1) as a standard VAR model in Yt will have bias issue because of the omission of the “factors”. Consequently, the estimated VAR coefficients and analysis of IRF and variance decompositions will be biased. For instance, let’s suppose that the dynamics of the economy can be represented by real output Yt potential output [Ft' Yt' ]' inflation πt, inflation expectation [Ft' Yt' ]' nominal exchange rate St, and a nominal interest rate rt in the framework of 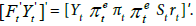
If all series are observable, then 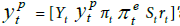 and Ft will be a null vector. In this case, the dynamics of the economy can be analysed by using a traditional VAR approach. If potential output and inflation expectation are unobservable, then
 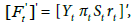 and
and 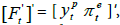 then it is needed to estimate the dynamics of the economy by using a FAVAR approach.
Data Analysis and Empirical Results
Data analysis
The choice of time series was based on pioneer work of Bernanke et al. [19]. Then, the data used in this article is quarterly series of Iran’s economy for the period of 1988: Q2 and 2011, which collected from the Central Bank of Iran’s website. Quarterly series for the impulse response function include gross domestic product (GDP), investment (I), private consumption (PC), government consumption (GC), capacity utilization (CU), consumer price index (CPI), liquidity (M2), money base (MB), and exchange rate (IER), as monetary policy instruments and oil price (OILP) in the ‘log forms’ category. The point worth mentioning is that a series of several other series are nonexistent at the national level with quarterly periodicity. Therefore, it was not possible to include all information in the model to cover all aspects of the economy and make all decision. Data descriptions are presented in Table 1.
| Data | Description |
|---|---|
| LGDP | The Log of Gross Domestic Product |
| LI | The Log of Investment |
| LPC | The Log of Private Consumption |
| LGC | The Log of Government Consumption |
| LCU | The Log of Capacity Utilization |
| LCPI | The Log of Consumer Price Index |
| LM2 | The Log of Liquidity (or Money Stock) |
| LMB | The Log of Money Base |
| LIER | The Log of Exchange Rate |
| LOILP | The Log of Oil Price Index |
| F1 | Latent Factor used in FAVAR Model |
| F2 | Latent Factor used in FAVAR Model |
Table 1: Data Description.
In this article, I considered two individual VAR and FAVAR models. I estimated the FAVAR model using two latent factors including F1 and F2, which both generated from a large series (Not reported in this article). The two factors with the largest eigenvalues explained only 41.2% of the variability of set Xt. As shown in Figure 1, F1 and F2 explain 26.68% and 14.52% percent, respectively.

Figure 1: Observations and Biplot of F1 and F2.
In analyzing time series properties, the results of Johanson’s method showed that there is a long-run relationship between all-time series. Since the non-stationary series of the model are cointegrated, the regression on the levels of these series is not spurious. Then, I used all-time series in level.
used Schwarz information criterion (SIC) as a measure for selecting the appropriate lags in the VAR and FAVAR models. The response function of the important factors for the monetary policy instrument was obtained by using the Cholesky decomposition method. The standard error of the estimates was calculated by using the Monte Carlo method with 100 repetitions. Based on the impulse response functions (IRF) of the factors, F1 and F2, it was possible to evaluate the IRF of all series included in the dataset of Xt in a FAVAR model.
Empirical results
Overall, one way to evaluate the informational contribution of the factors is to compare the results obtained using a FAVAR model with those obtained using traditional VAR approach. It is important to confirm that FAVAR approach is not a purely factorial model since includes a vector of observable variables. Therefore, the observable series generally included in a standard VAR model can be included in Yt. This section briefly illustrates the main results of the response function in both VAR and FAVAR model.
The response of all series to one standard deviation shock in the log of consumer price index (LCPI), the log of liquidity (LM2), the log of money base (LMB), the log of exchange rate (LIER), as monetary policy instruments and the log of oil price index (LOILP) in terms of VAR and FAVAR models are shown in Figures 2-11. One observes that response of the log consumer price index (LCPI) as a measure of inflation and the log of GDP yield the same results in both a standard VAR and FAVAR estimated models and the impact of contractionary monetary policy shocks was more persistent in a VAR estimated model.

Figure 2: IRF of Variables to LCPI Changes in VAR.

Figure 3: IRF of Variables to LCPI Changes in FAVAR.

Figure 4: IRF of Variables to LM2 Changes in VAR.

Figure 5: IRF of Variables to LM2 Changes in FAVAR.

Figure 6: IRF of Variables to LMB Changes in VAR.

Figure 7: IRF of Variables to LMB Changes in FAVAR.

Figure 8: IRF of Variables to LIER Changes in VAR.

Figure 9: IRF of Variables to LIER Changes in FAVAR.

Figure 10: IRF of Variables to LOILP Changes in VAR.

Figure 11: IRF of Variables to LOILP Changes in FAVAR.
The response of the log exchange rate was consistent with theory, which means that the log of exchange rate increased in response to a contractionary monetary shock. It was followed by low-depreciation until the impact returned to zero. This behavior showed the existence of overshooting, which is a common phenomenon in the related empirical literature [27,28]. The log of exchange rate series was included in the model because of its major role in the context of inflation targeting. Taylor et al. [29] argues that the positive effect of the exchange rate on inflation depends on the persistence of inflation. Conversely, Calvo et al. [30] showed that the pass-through is high for emerging countries. Therefore, the monetary authority should respond to the exchange rate fluctuation in order to contain the passthrough.
The inclusion of factors only increased a little the size and time of the impact of monetary policy contraction on inflation, and it might be related to the low explanatory power of series. However, the responses indicated by using a standard VAR model were not significant. The log of money base (LMB) reduced after occurring the shock, which was reasonable. Therefore, there was no evidence of the log of liquidity (LM2) puzzle, which usually appears in empirical studies using a traditional VAR approach. It should be noted that the response of the log of money base (LMB) was more erratic than other ones. In addition, it could be also observed that the contractionary monetary shock reduced the log of capacity utilization (LCU). The findings were consistent with the monetary policy contraction impact theory. The log of GDP decreased after occurring a contractionary monetary policy shock, which reached a minimum three quarters after the monetary policy contraction. After more quarters, the impact becomes null, which is consistent with the long-term neutrality of money.
The response paths of the log of consumer price index (LCPI), the log of money base (LMB), and the log of capacity utility (LCU) were less erratic based on the estimation results of FAVAR model. The findings for the two-factor in FAVAR model were imprecise and the logs of money base (LMB) figures were not significant. Additionally, the other variables showed significant responses only for the initial three quarters. In response to the log of money base (LMB) shocks, the oil price decreased after a period slight growth, and then the effect was negligible. The log of real GDP showed a negative impact in response to an increase in the log of money base. The log of consumer price index dropped in response to the log of exchange rate shock. The negative effect reached its peak at four quarter, and at the end of ten quarter, the response returned to zero. As a result, the existence of two factors in FAVAR model can capture additional information to indicate the price behavior based on theory.
A positive oil price shock was expected to boost the log of GDP instantaneously. In contrast, the response of the log capacity utilization (LCU) was not significant in early quarters.
Conclusions
This work used a traditional VAR model and a FAVAR approach which proposed by Bernanke et al. [19] to study the effects of monetary policy shocks on Iran’s quarterly data for the period 1988: Q2 to 2011: Q3. The results were consistent with the existing theory regarding the impact of contractionary monetary shocks. The findings showed that there was no change in the response of the principal variables in both VAR and FAVAR models. Also, the estimation results of FAVAR model were consistent with theory and better than the results of VAR model. Furthermore, the results of a standard VAR model showed the existence of the log of consumer price index (LCPI) and the log of liquidity (LM2) puzzles while FAVAR model did not provide any evidence of puzzles.
References
- Walsh CE (2010) Monetary Theory and Policy, Cambridge Massachusetts, USA.
- Sims CA (1980) Macroeconomics and Reality. Econometrica 48: 1-48.
- Bernanke BS, Blinder AS (1992) The Federal Funds Rate and the Channels of Monetary Transmission. Am Econ Rev 82: 901-921
- Sims CA (1992) Interpreting the Macroeconomic Time Series Facts: The Effects of Monetary Policy. Eur Econ Rev 36: 975-1000.
- Christiano L, Eichenbaum M (1992) Current Real-Business-Cycle Theories and Aggregate Labor-Market Fluctuations. Am Econ Rev 82: 430-450.
- Gordon D, Leeper E (1994) The Dynamic Impacts of Monetary Policy: An Exercise in Tentative Identification. J Polit Econ 102: 1228-1247.
- Strongin S (1995) The Identification of Monetary Policy Disturbances Explaining the Liquidity Puzzle. J Monetary Econ 35: 463-497.
- Lastrapes WD, Selgin G (1995) The Liquidity Effect: Identifying Short-run Interest Rate Dynamics using Long-run Restrictions. J Macroecon 17: 387-404.
- Gerlach S, Smets F (1995) The Monetary Transmission Mechanism: Evidence from the G-7 Countries. BIS Working Paper No. 26.
- Leeper EM, Sims CA, Zha T (1996) What Does Monetary Policy Do? Brookings Pap Eco Ac 2: 1-78.
- Bernanke BS, Mihov I (1998) Measuring Monetary Policy. The Q J Econ 113: 869-902.
- Christiano L, Eichenbaum M, Evans C (1999) Chapter 2 Monetary Policy Shocks: What Have We Learned and to What End? Handbook of Macroecon 1: 65-148.
- Peersman G, Smets F (2001) The Monetary Transmission Mechanism in the Euro Area: More Evidence from VAR Analysis. ECB Working Paper 91.
- Mojon B, Peersman G (2001) A VAR Description of the Effects of Monetary Policy in the Individual Countries of the Euro Area. ECB Working Paper 92.
- Angeloni I, Kashyap A, Mojon B, Terlizzese D (2003) Monetary Transmission in the Euro Area: Does the Interest Rate Channel Explain It All? NBER Working Papers 9984.
- Stock J, Watson M (2002) Forecasting Using Principal Components from a Large Number of Predictors. J Am Stat Assoc 97: 1167-1179.
- Bernanke BS, Boivin J (2003) Monetary Policy in a Data-rich Environment. J Monetary Econ 50: 525-546.
- Miyao R (2002) The Effects of Monetary Policy in Japan. Journal of Money, Credit and Banking 34: 376-392.
- Bernanke BS, Boivin J, Eliasz P (2005) Measuring the Effects of Monetary Policy: A Factor Augmented Vector Autoregressive (FAVAR) Approach. Q J Econ 120: 387-422.
- Lagana G, Mountford A (2005) Measuring Monetary Policy in the UK: A Factor-Augmented Vector Autoregression Model Approach. Manchester School 73: 77-98
- Shibamoto M (2007) An Analysis of Monetary Policy Shocks in Japan: A Factor Augmented Vector Autoregressive Approach. The JPN Econ Rev 58: 484-503.
- Carvalho MD, Junior JLR (2009) Identification of Monetary Policy Shocks and its Effects: FAVAR Methodology for the Brazilian Economy. Braz Rev Econometrics 29: 285-313
- Soares R (2011) Assessing Monetary Policy in the Euro Area: A Factor-Augmented VAR Approach. Applied Economics 45: 2724-2744.
- Kabundi A, Ngwenya N (2011) Assessing Monetary Policy in South Africa in a Data-Rich Environment. S Afr J Econ 79: 91-107.
- Liu Z, Spiegel MM, Tai A (2017) Measuring the Effects of Dollar Appreciation on Asia: A FAVAR Approach. J Int Money Financ 74: 353-370.
- Stock J, Watson M (1998) Diffusion Indexes. NBER Working Paper 6702.
- Siami-Namini S, Hudson D, Trindade AA (2017) Commodity Price Volatility and U.S. Monetary Policy: Commodity Price Overshooting Revisited. SSRN.
- Siami-Namini S, Hudson D (2016) US Monetary Policy and Commodities Price Fluctuations. Washington DC, USA.
- Taylor J (2000) The Monetary Transmission Mechanism and the Evaluation of Monetary Policy Rules. Working Papers Central Bank of Chile, USA.
- Calvo GA, Reinhart CM (2000) Fear of Floating. NBER Working Paper 7993.