Spanish
  Chinese
  Russian
  German
  French
  Japanese
  Portuguese
  Hindi
Hindi Research Article, J Mar Biol Oceanogr Vol: 9 Issue: 1
The Potential Impact of the Erroneous Categorization of Shark Bites on Incident Modeling
Raid W Amin1, Erich K Ritter1,2*and Megan W Richardson2
1Department of Mathematics and Statistics, University of West Florida, Florida, USA
2Shark Research Institute, Princeton, New York
*Corresponding Author : Erich K Ritter, Department of Mathematics and Statistics
University of West Florida, Florida, USA.
E-mail: eritter@uwf.edu
Received date: February 18, 2020; Accepted date: February 27, 2020; Published date: March 05, 2020
Citation: Amin RW, Ritter EK, Richardson MW (2020) The Potential Impact of the Erroneous Categorization of Shark Bites on Incident Modeling. J Mar Biol Oceanogr 9:1.
Abstract
Historically, shark bite statistics have focused exclusively on what has been considered naturally occurring or “unprovoked” conflicts between sharks and people. However, the distinction between unprovoked and provoked bites is somewhat fluid and ambiguous to some extent, and so largely depending as it does on the interpretations of those who investigate these conflicts. In order to assess the subjectivity and potential for error inherent in these interpretations, we compared spatial and space-time clusters of incidents of aggregate bites, bites reported as unprovoked, and bites reported as provoked on the East coast of Florida, which is the shoreline where the largest number of shark bites is reported annually worldwide. The focus was on the primary-and secondary-high risk clusters, and the several activities leading to these bites.
Keywords: Activity; Bite; Shark;Statistically modeling;Unprovoked
Introduction
Few animals are more feared by humans than sharks [1-3], and this fear is responsible or all manner of misperceptions on the part of the general public [4-6]. Thus, though the frequency of shark bites worldwide is extremely low, social and mainstream media continue to draw attention to them [7,8]. There is a pressing need to correct the erroneous perception of sharks that results from this emphasis on negative encounters between sharks and humans [9,10]. To begin with, bite statistics must be presented and interpreted accurately [11-15]. A major problem with how these statistics are reported is the sole use of the so-called “ unprovoked ” bites, while bites that are seemingly provoked are excluded [16,17].
The classification of bites as either unprovoked or provoked was implemented in 1958 by the Shark Research Panel that the U.S. Office of Naval Research, created in order to shed light on incidents in which humans are harmed by sharks [18-20]. Other organizations dealing with the issue then adopted the panel’s classification scheme [21-23]. However, while there are obvious reasons to consider only those incidents in which humans do not seem to have provoked bites when compiling bite statistics, no definition has yet been established that distinguishes such bites unambiguously from unprovoked ones. Thus, for example, according to Midway and colleagues [16], an “unprovoked attack is defined as a bite or near bite (fended off by human intervention)(sic) of a person (or the board on which he/she is perched)(sic) in the shark’s natural environment.” Not only is the term “near bite” ambiguous, but the following parenthetical statement also leaves room for interpretation. Further, while the notion of provoked bites seems fairly straightforward-including, for example, bites that occur when individuals are feeding sharks or fishing for them-such incidents as stepping on a shark or falling onto one are more open to interpretation by investigators. Likewise, when individuals engaged in line fishing or spearfishing are bitten despite not having acted in a provocative manner, circumstances may nevertheless have motivated the shark to act, in which case the incident should be considered provoked [24-26]. It is possible, therefore, that the victims, in fact, trigger most or even all seemingly unprovoked bites. Put more bluntly; existing bite statistics may be inaccurate and in need of reconsideration.
To explore these issues, we looked at shark bites over the period from 1998 and 2017 on the East Coast of the U.S. state of Florida, which is the shoreline where the largest number of bites is reported annually worldwide [12,14,27]. As a means to substantiate our evaluation, we compared simple bite counts with a valid proxy for the number of individuals entering the water in a given area, thereby generating bite rates [12,14]. More specifically, we created statistical models and sought to identify spatial and space-time high-risk clusters in space and in time of unprovoked and provoked incidents as well as aggregated unprovoked and provoked incidents. We then examined the bite rates over this period in relation to activities that bring humans into contact with sharks in order to assess the impact of erroneously assigning incidents to one or the other bite type. Then, in order to put these results in perspective, we considered how such errors would affect the interpretation of incidents on other shorelines.
Materials and Methods
Our research consisted of two parts. First, we identified high-risk areas for shark bites along Florida’s East Coast. Second, we quantified the human activities that preceded the two types of bites (i.e., unprovoked and provoked) generally.
Data sources
We obtained the shark bite data for Florida’s East Coast from the ‘Shark Research Institute’s Global Shark Attack File’ [28]. These data included the investigators’assessments of bites as either provoked or unprovoked, which we took at face value. The criteria for the inclusion of incidents in the first part of the study were occurrences where at least some harm was done to the human involved or to his or her equipment in the water (e.g., a bite that damaged a surfboard). Incidents in which no harm or damage occurred were, however, considered in the second part of the study in order to shed further light on the effect of their inclusion on incident modeling. Also, for this study, all forms of fishing, except for spearfishing, including shore fishing, cast net fishing, and others, were used combined, labeled as “fishing.” We suggest below that the modeling might be rendered more accurate by approaching the general category of fishing on a more granular level and considering specific activity-driven trends.
Bite rates
Shark bites occur more often in proximity to populated beaches. To account for the beachgoing population, we used the annually reported shark bites for a given region against the annual estimated beach attendance. The best available beach population estimates are those provided by the United States Lifesaving Association. The association compiles annual attendance data for the beaches where lifeguards are present, which include most beaches along the East Coast of Florida. These data represent visitors to various beaches rather than individuals who enter the water. However, since it seems reasonable to assume that most of these visitors indeed do enter the water, we used the beach attendance data as a proxy for the numbers of individuals who had the potential to encounter a shark at any of the beaches on Florida’s East Coast during the period of study. In cases in which the relevant data were unavailable, we relied on a regression-based on known data points for an approximation. Likewise, to make the analysis more precise in spatial terms-a particular concern for counties with large shorelines, such a Broward, Palm Beach, and Volusia-we divided some stretches of beach into smaller units (Figure 1). In this manner, we resolved Florida’s East Coast into 25 units for analysis.
Data analysis

Figure 1: The 25 coastal regions of the Eastern Florida shoreline for the purpose of this analysis.
In order to perform this analysis, we relied on SaTScan, software that synthesizes spatial, temporal, and space-time data to detect clusters within a given geographical region and assess their statistical significance [29-31]. SaTScan can analyze both discrete and continuous data and detect temporal trends. The data were used for both a two-dimensional spatial analysis and a three-dimensional space-time analysis. In order to identify the centroid of each beach, which is one of the values required by the software, we used ‘Google Maps’ to obtain the needed longitudes and latitudes.
The two-dimensional, purely spatial analysis generated a circular or elliptical window, according to the user’s specifications, moving along the 25 centroids. For each location in this file, the radius of the test window increased continuously from zero to a specified limit. In this way, we created a theoretically infinite number of unique geographical circles within which the data sets of various locations could be placed to form potential clusters [29-31].
For the three-dimensional space-time analysis, a cylindrical window was formed using a circle or elliptical shape as the geographical base, with the height of the cylinder corresponding to the time window. Thus the cylinder moved simultaneously in time and space to create a theoretically infinite number of unique overlapping cylinders, with each cylinder also representing a potential cluster.
The spatial and space-time scan function of SatScan then tested, for each window, the null hypothesis that the risk of shark bite was the same across all coastal regions-against the alternative hypothesis that areas of elevated or even high bite risk could be identified within the scan window compared with areas outside the window.
In order to utilize SaTScan, it was necessary to determine the distribution of incidents within the data set. Since each shark bite incident could be counted as independent, and, since they were also rare, it was reasonable to assume that the data would follow a Poisson distribution. Under such circumstances, the probability of an incident occurring is given by
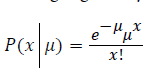
where x represents the actual number of incidents (and is, therefore, a whole number), and μ represents the mean number of incidents.
Since SaTScan assesses the statistical significance of clusters, then, it was suitable for testing the hypotheses using
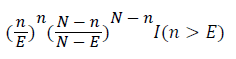
where N is the total number of shark incidents along Florida’s East Coast, n is the number of incidents in the region covered by the scanning window, E is the expected number of incidents in this region under the null hypothesis, and I (n>E) is the indicator function [29-31].
In order to identify clusters, this likelihood function was maximized across all scanning windows. SaTScan uses a likelihood ratio test to identify the cluster with the highest existing probability, that is, the “most likely cluster.” All of the other clusters are arranged in order according to the values established by the likelihood ratio test as “secondary clusters.” We excluded from the analysis clusters that were not significant at the set significance level of 0.05. To obtain the pvalue associated with each likelihood ratio, SaTScan uses the Monte Carlo method, which generates 999 random replications of the data set.
Activity-related analysis of primary high-risk areas
The activities associated with the primary high-risk areas for unprovoked and provoked bites in the area of study were expressed as percentages for comparison with each other, with the US East Coast in general, and with the world’s top ten bite incident countries. Incidents that could not be confirmed, that occurred in aquariums, or for which the victim’s activity at the time of the bite could not be established, were excluded from the analysis.
Results
From 1998 to 2017, 449 verified shark bite incidents occurred along Florida’s East Coast, of which 429 were categorized as unprovoked. The unprovoked bite rates revealed a statistically significant primary high-risk cluster for Reg9 in Volusia County as well as a statistically significant secondary high-risk cluster between Reg11 and Reg18, covering the shoreline from Brevard County down to Palm Beach County.
The 20 provoked incidents also showed spatial clustering in Reg9 but no secondary high-risk clusters. Owing to the large overlap of the bite types within Reg9, the combined bites likewise showed the same primary and secondary high-risk clusters. Table 1 lists the regions with high-risk clusters, the relative risks in these regions, the actual and expected numbers of incidents, and the p-value of the log-likelihood ratio test for unprovoked and provoked bites.
| Bite type | Region | Cluster type | RR | Ntrue | Nexp | p |
|---|---|---|---|---|---|---|
| Unprovoked | R9 | Primary high | 11.18 | 176 | 25.14 | <0.0001 |
| Unprovoked | R11-R18 | Secondary high | 9.34 | 322 | 104.57 | <0.0001 |
| Provoked | R9 | Primary high | 13.14 | 9 | 1.17 | <0.0001 |
RR: Relative risk (the estimated risk within and without a cluster); Ntrue: True number of bites; Nexp: Expected number of bites (the theoretical average bite number based on the chosen population size); p: p-value of log-likelihood ratio rest
Table 1: Spatial high-risk clusters along Florida’s East Coast for unprovoked and provoked bites between 1998 and 2017.
The space-time clustering for unprovoked bites also showed Reg9 in Volusia County to have been the primary high-risk area in the period from 2000 to 2009 and Reg11 to Reg18 to have been secondary high-risk areas from 1998 to 2007 (Table 2). The space-time clustering likewise pinpointed R9 as the primary high-risk region for provoked bites from 2001 and 2008 but did not identify any secondary high-risk cluster of provoked bites.
| Bite type | Region | Cluster type | RR | Ntrue | Nexp | Time | p |
|---|---|---|---|---|---|---|---|
| Unprovoked | R9 | Primary high | 8.79 | 113 | 12.86 | 2000-2009 | <0.0001 |
| Unprovoked | R11-R18 | Secondary high | 3.6 | 68 | 21.31 | 1998-2007 | <0.0001 |
| Provoked | R9 | Primary high | 26.88 | 8 | 0.48 | 2001-2008 | <0.0001 |
RR: Relative risk (the estimated risk within and without a cluster); Ntrue: True number of bites; Nexp: Expected number of bites (the theoretical average bite number based on the chosen population size); Time: Years during which cluster remained; p: p-value of log likelihood ratio rest
Table 2: Space-time high-risk clusters along Florida’s East Coast for unprovoked and provoked bites between 1998 and 2017.
Due to the primary and secondary-high risk clusters overlap for provoked and unprovoked incidents, aggregate bites reveal the same spatial and space-time clusters.
Activity-related incidents in Volusia County, Florida’s East Coast generally, and beyond
Volusia County, consisting of Reg8 to Reg10, was the site of 216 verified incidents over the period of interest, 186 of them in Reg9, thus representing 41.4% of all incidents reported in that time on Florida’s East Coast. In terms of activity, 80% of these incidents in Reg9 occurred while the victims were engaged in surfing and 20% when the victims were wading. Along the entirety of Florida’s East Coast, 4.7% of total bites were reported as provoked; among these incidents, 45% occurred while the victims were surfing, 15% while they were wading, and 30% while they were fishing.
Over this same period (1998-2017), 643 incidents were reported along the entire U.S. East Coast, of which 42 were considered provoked. Again, the activities in which the victims were engaged were primarily fishing (52.5%), surfing (21.4%), and wading (7.1%), most of the remaining bites having been received when the victims were diving or handling sharks. Worldwide, 1,790 shark bites were reported in this period, 145 of them considered provoked. Of the 1,645 filed unprovoked incidents, 7% were incidents where neither the person was injured nor was there any damage to their equipment mentioned. The main activities in which the victims were engaged during the provoked incidents were fishing (53.8%), spearfishing (11.9%), swimming/ snorkeling (7.6%), surfing (6.3%), and wading (2.8%).
Discussion
In the past, shark bite statistics consisted of simple bite numbers together with the activities in which the victims were involved that served to shed some light on negative shark-human interactions [32-34]. Now that the statistics have come to include bite rates, which measure the bite numbers against a proxy for the actual numbers of individuals entering the sea, more qualitative research into shark bites is possible [11-15]. Nevertheless, the problem of identifying incidents that are suitable for modeling has remained owing to the lack of a clear distinction between unprovoked and provoked incidents. Historically, only incidents considered to represent “natural” interactions between sharks and humans have been used for statistical purposes while those in which humans trigger shark bites, thus called provoked, have been ignored [34,35]. Because of the definition’s ambiguity between the two-bite categories [16,33,36] and, in extension, the investigators ’ latitude in interpreting incidents, it has been difficult to ascertain the significance of apparent trends in shark-human interactions.
Some activities, such as feeding or harassing a shark, are relatively unambiguous in terms of humans’ potential to provoke a bite. Other activities, though, may result in either type of incident. In the case of surfing, for example, an incident in which a shark knocks an individual from a surfboard into the water would be considered unprovoked by the person, while an incident in which an individual falls from a surfboard onto a shark would be considered provoked by the person. Similar ambiguity is associated with the activities of wading and even various types of fishing. For a bite statistic to be valid, however, the distinction between the two-bite types should be clear and not leave room for any interpretation. This problem with the statistics is particularly acute concerning hotspots, such as Reg9 of Volusia County, should the activities associated with the bites be more diverse, which is, however, not the case for Reg9. This region in Volusia County covers only around 15 km of the beach but was where we found the primary spatial and space-time high-risk clusters for both unprovoked and provoked bite rates along Florida ’ s entire shoreline, with essentially the same activities leading to bites in both contexts. In this case, erroneous attribution of incidents would only be relevant to the significance of trends but would not affect the outcome for the rest of Florida’s East Coast. As long as the significant high-risk clusters for both incident types that are identified in the same region involve mostly the same activities, the bite numbers could even be combined to avoid the difficulty of distinguishing between unprovoked and provoked bites. However, a clear distinction between these incident types is necessary for situations in which the high-risk clusters of the two incident types do not overlap.
Nowhere else in the world do bites occur as frequently as in Reg9 in Florida’s Volusia County, nor do the activities of the two bites types overlap to such an extent, at least not consistently. Along the rest of the world’s shorelines, bites, whether provoked or not, are not only less frequent but also distributed more evenly, and involve more diverse activities. However, even under these circumstances, the erroneous categorization of events would only then have a significant effect in situations in which activity trends over time are of interest. Such diachronic analysis could be crucial, especially in the context of incident mitigation efforts at popular beaches [37,38] or when there is concern about over-reported local shark bite cases, and the spreading of inaccurate perception [3,39,40]. Even so, since the number of annual incidents worldwide rarely reaches 100 [28], even a small false positive would take years to develop should an activity be erroneously categorized consistently. Therefore, so long as bite numbers around the world remain low, and no other region becomes as active as Reg9 in Florida, the erroneous interpretation of incidents should not have a significant impact on their modeling.
In light of this discussion, it may reasonably be asked whether a clear distinction between unprovoked and provoked bites matters after all. We conclude, though, that a clear separation is indeed very much needed, especially as proxies for beachgoing populations become increasingly available outside the U.S., and demand increases for insights into activity-related trends in incident-prone countries. In the meantime, the erroneous allocation of an incident is more a matter of statistical precision than a source of bias in the identification and assessment of bite trends.
A possible cultural dimension of provoking sharks
We found that, while surfing and wading were the main activities in which the recipients of shark bites in Florida were engaged, various forms of fishing were the dominant activities elsewhere on the U.S. East Coast. Worldwide, surfing and wading are even less often reported in this context and fishing activities even more common, including spearfishing, as are swimming/snorkeling [28]. However, since statistics for the beachgoing population or valid proxies, which are necessary to determine actual bite rates, are unavailable outside the U.S., the only way to compare countries is based on the relative frequencies of the various activities. It must also be pointed out that no activity leading to shark bites has ever been looked at from the viewpoint of its relative risk. This is due to the inability of quantifying the number of people practicing a particular activity, as well as time spent doing so. This incapability always needs to be kept in mind when comparing different activities with each other.
Individuals who are spearfishing are very rarely bitten in Florida or elsewhere on the U.S. East Coast. This statistic appears to reflect the limited popularity of this activity in the U.S. since it is permitted in state and federal waters. However, it could also just reflect more local popularity like the Florida Keyes [41], lower temperatures along the coasts up north, or the lack of a suitable environment for the sport in U.S. waters, as compared to e.g., the Bahamas [28].
Further study is needed to establish the actual popularity of this activity and the availability of spearfishing grounds in the US. Since the only regulations concerning spearfishing in the ten countries in which the most shark bites are reported to involve the e.g., length of the season for some species, types of equipment or the exclusion of doing it commercially (e.g., Australia), incidents are likely to continue occurring in these countries at the same frequencies since humans fish in the same places where sharks forage and roam [42]. Further, the impacts of commercial shore fisheries, the overfishing effects of spearfishing itself [43-45], and so the increasing depletion of resources [46] make it likely that shark bites will occur with greater frequency among individuals engaged in spearfishing activities in the years to come.
Like spearfishing, shore fishing seems less popular in the U.S., at least on the East Coast, than in other countries. In any case, for studies such as this one, it would make sense to treat (sport)fishing, not collectively, but in terms of specific forms of the activity (i.e., shore fishing, cast netting, and so on).
In contrast with the U.S., sportfishing and spearfishing are popular activities in countries such as South Africa [47-50] and Australia [50-52] which are the countries that report the second and third highest numbers of shark bites after the U.S. [27], and can be considered ingrained in their societies. Sportfishing in all its forms, as well as spearfishing, will likely keep happening, and as long as these activities will not get more prominent in the U.S., these mostly provoked incidents will likely not increase along the eastern U.S. Coast.
The more incidents, the more inaccuracies
Owing to the lack of clarity regarding the distinction between unprovoked and provoked incidents, then, even those that do not result in injury to a person or damage to equipment are included in the bite statistics. Such incidents, which usually cannot be assigned to one or the other bite category, accounted for nearly 7% of total incidents worldwide during the period covered by this study and thus constitute a prominent source of error.
Conclusion
In light of the issues discussed here, we conclude that the phenomenon of negative encounters between humans and sharks, which are generally referred to with the umbrella term “shark attacks,” needs to be reconsidered with the addition of clarity regarding the nature of specific incidents. Until such clarity is achieved, bite statistics and trends therein should be treated with at least some caution, with particular attention to the country or region being discussed. If trends in sharks bites worldwide are to be identified and assessed accurately, there is a need for not only a clear distinction between unprovoked and provoked bites but also a rigorous definition of what qualifies as an actual incident. For research into trends relating to the activities in which shark bite victims are engaged when incidents occur, there is a further need to compile beach population data or suitable proxies thereof, especially when the effort is made to compare countries.
Acknowledgments
Special thanks go to “ProWin ” for financially supporting this project.
References
- Crossley R, Collins CM, Sutton SG, Huveneers C (2014) Public perception and understanding of shark attack mitigation measures in Australia. Hum Dimensions Wildlife 19: 154-165.
- Neves JPCD, Moneiro RCR (2014) How full is your luggage? Background knowledge of zoo visitors regarding sharks. Environ Edu Res 20: 291-312.
- Sabatier E, Huveneers C (2018) Changes in media portrayal of human-wildlife conflict during successive fatal shark bites. Conserv Soc 16: 338-350.
- Curtis TH, Bruce BD, Cliff G, Dudley SFJ, Klimley AP, et al. (2011) Responding to the risk of a white shark attack: Updated statistics prevention control methods and recommendations, In: Global Perspective on the Biology and Life History of the White Shark. Domeier ML (ed) CRC Press, Boca Raton, pp: 477-460.
- Muter BA, Gore ML, Gledhil KS, Lamont C, Huveneers C (2012) Australian and US news media portrayal of sharks and their conservation. Conserv Biol 27: 187-196.
- Myrick JG, Evans SD (2014) Do PSAs take a bite out of Shark Week? The effects of juxtaposing environmental messages with violent images of shark attacks. Sci Commun 36: 544-569.
- Philpott R (2002) Why sharks may have nothing to fear more than fear itself: an analysis of the effect of human attitudes on the conservation of the great white shark. Colo J Int Environ Law Policy 13: 445.
- Peschak T (2006) Sharks and shark bite in the media, In: Finding a Balance: White Shark Conservation and Recreational Safety in Inshore Waters of Cape Town South Africa. Nel DC, Peschak T (eds) Proceedings of a specialist workshop WWF South Africa Report Series Die Boord South Africa, WWF South Africa, pp: 159-163.
- Finucane M (2000) Improving quarantine risk communication: Understanding public risk perceptions. Decision Research: Eugene Oregon.
- Botterill L, Mazur N (2004) Risk and risk perception: A literature review. Report for the Australian Government Rural Industries Research and Development Corporation. Kingston, ACT.
- Amin R, Ritter E, Bonell (2018) Shark bite rates along the US Gulf coast: a first investigation. Environ Sci 6: 1-12.
- Amin R, Ritter E, Bonell (2019) Using human population numbers to compare the incidence of shark bite on the East and West coasts of Florida. Fla Scientist 82: 82-94.
- Amin R, Ritter E, Cossette L (2012) A Geospatial Analysis of Shark Attack Rates for the Coast of California. J Environ Ecol 3.
- Amin R, Ritter E, Kennedy P (2012) A geospatial analysis of shark attack rates for the East coast of Florida: 1994-2009. Mar Freshw Behav Physiol 45: 185-198.
- Amin R, Ritter E, Wetzel A (2014) An estimation of shark attack risk for the North and South Carolina coastline. J Coast Res 31: 1253-1259.
- Midway SR, Wagner T, Burgess GH (2019) Trends in global shark attacks. PloS One 14: e0211049.
- Taglioni F, Guiltat S, Teurlai M, Delsaut M, Payet D (2019) A spatial and environmental analysis of shark attacks on Reunion Island (1980-2017). Mar Policy 101: 51-62.
- Gilbert PW (1963) The AIBS shark research panel, In: Sharks and Survival. Gilbert PW (ed) Heath and Co, Boston, pp: 505-507.
- Schultz LP (1963) Attacks by sharks as related to activities of man, In: Sharks and Survival. Gilbert PW (ed) Heath and Co, Boston, pp: 425-452.
- Baldridge HD (1974) Shark attack: A program of data reduction and analysis. Contributions from the Mote Marine Laboratory, 1.
- Klimley AP, Curtis TH (2006) Shark attack versus ecotourism: Negative and positive interactions. Proc Vert Pest Conf, 22.
- Afonso AS (2013) Bioecology and movement patterns of sharks off Recife Brazil: applications in the mitigation of shark attack hazard (Doctoral dissertation) Universidade do Algarve, Portugal.
- Ryan LA, Lynch SK, Harcourt R, Slip DJ, Peddemors V, et al. (2019) Environmental predictive models for shark attacks in Australian waters. Mar Ecol Prog Ser 631: 165-179.
- Ritter EK, Levine M (2004) Use of forensic analysis to better understand shark attack behavior. J Forens Odonto-Stomatol 22: 40-46.
- Ritter EK, Levine M (2005) Bite motivation of sharks reflected by the wound structure on humans. Am J Forens Med Path 26: 136-140.
- Ritter EK, Quester A (2016) Do white shark bites on surfers reflect their attack strategies on pinnipeds? J Mar Biol 16.
- Ritter E, Amin R, Cahn K, Lee J (2019) Against common assumptions: the world’s shark bite rates are decreasing. J Mar Biol 19.
- Global Shark Attack Fil/Shark Research Institute (2019) Incident log. Accessed November 20, 2019.
- Kulldorff M (2018) SaTScan user guide. accessed August 27, 2019.
- Kulldorff M, Athas WF, Feurer EJ, Miller BA, Key CR (1988) Evaluating cluster alarms: A space-time scan statistic and brain cancer in Los Alamos, New Mexico. Am J Public Health 88: 1377-1380.
- Kulldorff M, Heffernan R, Hartman J, Assuncao RM, Mostashari FA (2006) Space-time permutation scan statistic for the early detection of disease outbreaks. PLoS Med 2: 216-224.
- Caldicott DGE, Mahajani R, Kuhn M (2001) The anatomy of a shark attack: a case report and review of the literature. Injury 32: 445-453.
- Spirulis P (2014) Western Australia coastal shark bites: A risk assessment. Australas Med J 7: 137-142.
- West JG (2011) Changing patterns of shark attacks in Australian waters. Mar Freshw Res 62: 744-754.
- Chapman BK, McPhee D (2016) Global shark attack hotspots: identifying underlying factors behind increased unprovoked shark bite incidence. Ocean Coast Manage 133: 72-84.
- Nelson DR (1983) Shark attack and repellency research: an overview, In: Shark Repellents from the Sea: New Perspectives. Zahuranec BJ (ed) AAAS Selected Symposiums 83, pp: 11-74.
- Gray GME, Gray CA (2017) Beach-user attitudes to shark bite mitigation strategies on coastal beaches; Sydney, Australia. Hum Dimension Wildlife 22: 282-290.
- Weltz K, Kock AA, Winker H, Attwood C, Sikweyiya M (2013) The influence of environmental variables on the presence of white sharks Carcharodon carcharias at two popular Cape Town bathing beaches: A generalized additive mixed model. PLoS One 8: e68554
- Kasperson R, Renn O, Slovic P, Brown H, Emel J, et al. (1988) The social amplification of risk: a conceptual framework. Risk Anal 8: 177-187.
- Scheufele DA, Tewksbury D (2007) Framing agenda setting and priming: the evolution of three media effects models. J Comm 57: 9-20.
- Hale KK, De Sylva DP (1992) History of marine research in the Florida Keys. Bull Mar Sci 54: 1076-1077.
- Frisch AJ, Baker R, Hobbs JPA, Nankervis L (2008) A quantitative comparison of recreational spearfishing and line fishing on the Great Barrier reef: implications for management of multi-sector coral reef fisheries. Coral Reefs 27: 85-95.
- Johannes RE (1978) Traditional marine conservation methods in Oceania and their demise. Annu Rev Ecol Syst 9: 349-364.
- Jouvenet JY, Pollard DA (2001) Some effects of marine reserve protection on the population structure of two spearfishing target-fish species in shallow waters along a rocky coast in the north-western Mediterranean sea. Aqua Conserv 11: 1-9.
- Gillett R, Moy W (2006) Spearfishing in the Pacific islands: current status and management issues. Secretariat of the Pacific Community Noumea.
- Newton K, Cote IM, Pilling GM, Jennings S, Dulvy NK (2007) Current and future sustainability of island coral reef fisheries. Curr Biol 17: 655-658.
- Smale MJ, Buxton CD (1985) Aspects of the recreational ski-boat fishery off the Eastern Cape South Africa. S Afr J Mar Sci 3: 131-144.
- Mann BQ, Scott GM, Mann-Lang JB, Brouwer SL, Lamberth SJ, et al. (1997) An evaluation of participation in and management of the South African spear fishery. S Afr J Mar Sci 18: 179-193.
- Brouwer SL, Buxton CD ( 2002) Catch and effort of the shore and ski-boat linefisheries along the South African Eastern Cape coast. S Afr J Mar Sci 24: 341-354.
- Henry GW, Lyle JM (2003) The national recreational and indigenous fishing survey. Australian Government Department of Agriculture Fisheries and Forestry, Canberra, FRDC Project No. 1999/158.
- Lincoln-Smith MP, Bell JD, Pollard DA, Russell BC (1989) Catch and effort of competition spearfishermen in South-Eastern Australia. Fish Res 8: 45-61.
- Kingsford MJ, Underwood AJ, Kennelly SJ (1991) Humans as predators on rocky reefs in New South Wales. Mar Ecol Prog Ser 72: 1-14.