Spanish
  Chinese
  Russian
  German
  French
  Japanese
  Portuguese
  Hindi
Hindi Research Article, J Biodivers Manage Forestry Vol: 14 Issue: 1
The Prototype of Forest Structural Instability in Persian Oak (Quercus brantii) Slash and Burn Agricultural Areas in the Zagros, Western Iran
Mohsen Javanmiri Pour*
Department of Natural Resources, University of Tehran, Tehran, Iran
*Corresponding Author: Mohsen Javanmiri Pour,
Department of Natural Resources, University of Tehran, Tehran, Iran
E-mail: mm.javanmeri@gmail.com
Received date: 10 May, 2024, Manuscript No. JBMF-24-134689;
Editor assigned date: 13 May, 2024, PreQC No. JBMF-24-134689 (PQ);
Reviewed date: 28 May, 2024, QC No. JBMF-24-134689;
Revised date: 03 January, 2025, Manuscript No. JBMF-24-134689(R);
Published date: 10 January, 2025, DOI: 10.4172/jbmf 2327-4417.1000070
Citation: Pour MJ (2025) The Prototype of Forest Structural Instability in Persian Oak (Quercus brantii) Slash and Burn Agricultural Areas in the Zagros, Western Iran. J Biodivers Manage Forestry 14:1.
Abstract
In the Zagros ecosystem, many local communities rely on traditional slash-and-burn agriculture for their livelihoods, yet this practice has resulted in significant forest damage. This study delves into the structural impact on trees within these agricultural zones. We conducted a comprehensive 100% sampling, documenting both quantitative and qualitative traits of all trees in the study area. Quantitative data encompassed species type, regeneration method (coppice or standard), Diameter at Breast Height (DBH), tree height, crown major and sub-diameters, tree health, and the proportion of cut and damaged roots. To ascertain the number and volume of felled trees across three locations, we analyzed reports of natural resource violations spanning 2001 to 2021. In the absence of available 2001 data, samples were extracted radially from the diameter at breast height using an increment borer to detect structural changes by 2021. We calculated diameter increment during this period. Comparison of canopy areas in 2021 to those in 2001 at Kasehkaran, Avalviar, and Cheshmeh Pahn-e Rashid sites revealed declines from 54,686 to 43,180 m2, 15,830 to 12,762 m2, and 22,232 to 19,064 m2 respectively. Over the second period, tree frequency in diameter classes decreased across all three areas compared to 2001. Initially, total tree volumes in Kasehkaran, Avalviar, and Cheshmeh Pahn sites were 153 m3, 1,174.5 m3, and 565.6 m3 respectively in 2001. However, by 2021, these volumes decreased to 144 m3, 822 m3, and 515 m3 respectively. Over the past two decades, 118, 523, and 132 trees were removed from these areas. A paired t-test with a 99% confidence level demonstrated significant mean volume differences between the two periods in all habitats. Despite appearances, shifting agriculture has undergone structural degradation over time. We recommend specialized monitoring by relevant agencies, in addition to implementing standard protective measures.
Keywords: Slash-and-burn farming; Canopy; Frequency; Density; Volume; Quality status
Introduction
Deforestation, also known as forest clearance, refers to the process of removing trees from land, which is then transformed into non-forest use such as farms, ranches, or urban areas [1]. Currently, forests cover only 31% of the Earth's land surface, which is one-third less than their original coverage before the expansion of agriculture [2]. Half of this loss has occurred in the last century [3]. Deforestation is a widespread problem, with 15 to 18 million hectares of forest destroyed every year, an area equivalent to the size of Bangladesh [4]. On average, 2,400 trees are cut down every minute. This alarming trend has resulted in habitat loss, biodiversity decline, and aridity, causing extinction, changes in climatic conditions, desertification, and displacement of populations [5]. Deforestation also contributes to global warming by reducing the bio-sequestration of atmospheric carbon dioxide, leading to negative feedback cycles [6]. This, in turn, can put increased pressure on communities who need food security by clearing forests for agricultural use and reducing arable land [7].
Cropping systems differ from farm to farm based on a variety of factors such as available resources, geographical location, climate, government policies, economic, social and political pressures, as well as the farmer's philosophy and culture. One such system is shifting cultivation, also known as slash and burn, where forests are burned to release nutrients to support the cultivation of crops for several years, after which the plot is left fallow for the forest to regrow. The farmer then moves to a new plot and returns after many years (between 10-20 years) [8]. However, if population density increases, the fallow period is shortened, requiring the use of fertilizers or manure and manual pest control to compensate for the loss of nutrients [9]. The next phase of intensity is annual cultivation, where there is no fallow period, which requires even greater nutrient and pest control inputs [10].
The Zagros forest stands have been developed with less than 50% canopy cover, and their mean stand volume ranges between 10 to 20 m3 per hectare. The growth rate of these forests is less than approximately 11 m3 per hectare per year [11]. These forests currently face various strains, such as climate change and oak decline, as well as unsustainable exploitations like livestock grazing, cultivation under forest stands, fuel supply, and rural uses of trees [12]. These threats have led to destruction and the beginning of the regression process in the succession of forests [13]. Additionally, fundamental changes in the forest structure and the transformation of the ecosystem are among the dominant causes of disturbances and hazards to the biodiversity of fauna and flora [14].
Cultivation agriculture is a farming method that involves cutting and burning plants in a forest or forestland to create a field called Swidden. This practice is known as Jhum or Jhoom in Bangladesh and India [15]. However, this type of agriculture poses a significant threat to the forest ecosystems of Zagros [16]. To address this issue, understory should be applied for shifting cultivation in large parts of Zagros forest areas on different slopes, due to the traditional and forest-dependent livelihood of the local forest-dwelling communities [17].
The practice of rain-fed agriculture in the forest understory and changes in land use within the Zagros forest areas pose a significant threat to the ecosystem's sustainability [18]. The impact of this threat is further exacerbated by population growth, inadequate development aligned with nature, insufficient income of economic units, and job creation needs. These issues are gradually leading to soil erosion and deforestation in the region [19]. Activities such as shifting cultivation, plowing of pastures, changes in land use, destruction of habitats and regeneration, use of poisons and fertilizers, and other agrarian activities are negatively affecting the vegetation and fauna of the region [20].
Castro-Luna, et al. found that there were noticeable differences in plant composition, diversity, and physiology among different types of vegetation in a tropical forest located in southeastern Mexico. After shifting cultivation, the tree cover, crown height, and canopy cover were significantly higher in the primary vegetation cover than in the secondary vegetation cover. However, the herbaceous vegetation cover was similar in both types of regeneration. Additionally, the dominant tree and shrub species differed between the two types of regeneration.
According to Dalle, et al. the landscape in southeastern Mexico underwent significant changes between 1976 and 1997. The study found that during this period, the local population observed a transformation from a diverse mixture of mature forests and various stages of land use to a landscape dominated by young forests and agriculture that relied on slash and burn practices.
According to Molinario, et al., there is a high frequency of villages and agriculture development in the forest understory in Congo, which has various consequences on forest ecology and habitat fragmentation. Between 2000 and 2010, the number of villages increased from 11.9% to 13.1% (a 1.2% change), while forest slash-and-burn agriculture grew from 0.8% to 1.5%. As a result, primary forest decreased from 38% to 36.6% in 2010.
Wallenfang, et al. conducted a study on the effects of slash-andburn agriculture on tropical forests in southeastern Angola. The study found that the species composition and structure of dense stands are significantly different from the surrounding open forests. The longer the land is used for this type of agriculture, the greater the impact on the diversity of vegetation, species composition, regeneration, and nutrient content in the soil.
In 2016, Mukul conducted a study on upland secondary forests in the Philippines. The study revealed that the oldest shifting cultivation habitats had a significantly higher number of tree species. On the other hand, diversity and forest structure indices were higher in old-growth forest habitats. The study also noted homogeneous species composition in older shifting cultivation and old-growth forests. Additionally, secondary forests that were disturbed by slash-and-burn agriculture showed rapid recovery in species richness and abundance.
A study conducted by Gogoi, et al., in Southeast Asia, revealed that the species composition significantly differed (P<0.05) between shifting cultivation and old-growth forests. The density of trees varied from 28 per hectare in 5-year-old shifting cultivation to 163 per hectare in old-growth forests. Additionally, Kadoya, et al. study showed that shifting agriculture is the primary cause of forest disturbance in the distribution of globally threatened forest species.
While understory agriculture has been recognized as a major contributor to the destruction of Zagros forests, there haven't been any studies conducted on its impact across different parts of the ecosystem. Therefore, the present study aims to monitor and analyze the structure of trees in the understory agriculture areas of the Semi-Mediterranean Zagros landscape.
Material and Methods
Site description
The Gilan-e Gharb basin, situated in the western border of the Kermanshah region, spans across an expansive area of 224,500 hectares, making it the second-largest municipality in the vicinity. Bordered by Sarpol-e Zahab and Islamabad-e Gharb regions to the north, Ivan-e Gharb area in Ilam province and the Iraq border to the south, Qasr-e Shirin to the west, and Sarableh in Ilam province to the east, the basin enjoys a strategically significant location.
Elevation within the Gilan-e Gharb basin varies greatly, ranging from 250 meters in the Sumar region to a towering 2,355 meters at the Kachel peak. This substantial disparity in altitude gives rise to three distinct climatic zones: warm, temperate, and cold. Geographically, the Gilan-e Gharb location extends from 33°41'24" to 34°25'43" north, encompassing a diverse range of landscapes and environmental conditions (Figure 1).

Figure 1: The location of the studied area in Iran.
The Chelleh area experiences an average yearly rainfall ranging between 400 and 600 mm, with precipitation primarily occurring from October to April. Moreover, the mean annual temperature fluctuates between 12 to 18°C. In this region, understory farming is a longstanding tradition, while sub-story agriculture takes place in specific areas such as Kasehkaran, Avalviar, and Cheshmehpahn, which were the focal points of our study.
To gather comprehensive data, our study adopted a 100% sampling approach, capturing quantitative information on all trees within these locations. Parameters assessed included species identification, reproductive form (branches or seeds), diameter at breast height, tree height, primary crown diameter, and sub-crown diameter, facilitating thorough field measurements.
Data collection
For this study, three understory cultivation areas were strategically chosen based on their spatial distribution across various landscapes, their diverse scales ranging from small to large, and their vegetative forms, which could be either standard or coppice. Selection criteria were informed by careful analysis of Google Earth images spanning from 2001 to 2021.
The Kasehkaran region, characterized by a predominantly coppice form, spans an area of 7 hectares. In contrast, the Avalviar area comprises a mix of both coppice and standard vegetative forms, covering an extensive area of 113 hectares. Finally, the Cheshmeh Pahn region, primarily dominated by the standard form, encompasses 103 hectares (Table 1).
| Row | Sites | Location (UTM) | Area (ha) | Vegetative form |
| 1 | Kasehkaran | 595573-3771993 | 7 | Coppice |
| 2 | Avalviar | 597168-3772782 | 113 | Coppice-standard |
| 3 | Cheshmeh Pahn | 600999-3769993 | 103 | Standard |
Table 1: The characteristics of the studied slash-and-burn agricultural sites.
The study meticulously collected quantitative data pertaining to all trees within the selected locations. This encompassed species identification, reproductive form (branches or seeds), diameter at breast height, tree height, primary and secondary crown diameters. Furthermore, qualitative factors such as tree health and the presence of cut or eliminated individuals were also documented.
Additionally, statistics on the number and volume of removed trees due to various causes including girdling, uprooting, burning, and drying were obtained from the natural resources office for the years 2001-2021, across all three regions. This data was utilized to ascertain the number and volume of removed trees in each of these forms across the three sites.
In 2001, due to the unavailability of required diameter data, samples were extracted from the north side of the trunk at breast height in the radial direction to compare structural changes between 2001 and 2021. Five individuals of the standard form and three individuals of the coppice form were sampled in each diameter class using an increment borer. Subsequently, sandpaper was employed to elucidate the vegetative circles, and annual rings were counted either through a magnifying glass or under an electro-microscope with 10x magnification in cases where direct counting was not feasible. The radial increase was then measured using a digital caliper over the 20- year period. Finally, the amount of diameter increase in this period at each diameter class was calculated for both the coppice and standard forms across the three slash-and-burn agriculture sites. Specifically, 75 standard trees were selected from the 10 to 80 cm diameter class, while 40 coppice individuals were chosen from the 5 to 40 cm diameter class in three shifting agricultural sites.
To investigate diameter and stock changes over time, the individual diameter of coppice and standard forms in 2001 was determined by subtracting the added thickness in 20 years from the diameter recorded in 2021.
It's noteworthy that tree selection was conducted using a lottery method, ensuring randomness among all trees in each site post-field sampling. Moreover, the holes created by the increment borer were filled with mud to prevent the penetration of fungi, pests, and diseases into the tree after sample preparation.
Equation 1 was used to determine the volume of trees in the analyzed sites.
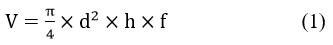
Where V is the volume m3, d is the diameter at breast height, h is the tree height, and f is the constant coefficient of the shape factor (0.5).
The radius of major and minor diameters at each crown tree was measured as quasi-circular to determine the canopy cover ratio of the examined habitats. As a result of the mean radius being calculated in each tree.
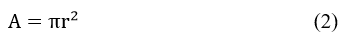
Where A is the crown area of each tree and r is the mean radius of the tree's crown.
Statistical analysis of data
The initial step involved normalizing the data using the Kolmogorov-Smirnov (K-S) test, followed by assessing the homogeneity of variances through the Levene test. Subsequently, the paired t-test was employed to compare the examined characteristics in the two periods, ensuring both normality of data distribution and homogeneity of desired data variance.
Results
Canopy cover area
Figure 2 illustrates the evolution of canopy cover in the sub-story farming area of the Avalviar site from 2001 to 2021. The Google Earth images distinctly reveal a reduction in both tree crown and canopy cover extent over this period. Upon analyzing the tree canopy area in 2021 and comparing it with that of 2001, it was observed that the canopy cover had diminished from 54,686 m2 to 43,180 m2 during this 20-year span. In essence, there has been a notable 21% decrease in canopy cover at the Avalviar site over this timeframe.

Figure 2: Slash and burn agriculture area in the Avalviar site.
Figure 3 showcases the status of canopy covers in the understory agriculture field on the Kasehkaran site for the years 2001 and 2021. Based on observations from Google Earth images, there has been a reduction in the tree crown area alongside an expansion of the canopy cover at this site. Upon comparing the tree crown area between 2021 and 2001, it was noted that the canopy cover had decreased from 15,830 m2 to 12,762 m2. In essence, approximately 19.4% of the canopy cover measurement has decreased in the Kasehkaran site during the studied period.

Figure 3: Slash and burn agriculture area in Kasehkaran site.
Figure 4 presents the changes in the state of canopy in the field of sub-story agribusiness in the Cheshme Pahn habitat from 2001 to 2021. Google Earth images vividly showcase the shifts, reduction of tree crowns, and the extent of canopy cover in this location. Upon comparing the tree crown area in 2021 with that of 2001, it becomes evident that the amount of canopy cover has decreased from 22,232 m2 in 2001 to 19,064 m2 in 2021. In other words, the rate of the canopy cover area on the Chesmeh Pahn site has dropped by 14.25% over the course of 20 years.

Figure 4: Slash and burn agriculture area in Cheshmehpahn site.
Abundance and density of trees
The distribution diagrams depicting the frequency of tree diameter classes during the studied periods reveal a pseudo-Gaussian (bell-like) curve across the three areas (Figures 5-7). This indicates that there are fewer trees with smaller diameters, while the number of trees peaks in the middle diameter range before gradually decreasing as the diameter of the trees increases. Furthermore, it is notable that the highest number of trees with smaller diameters comprises those of the coppice form.

Figure 5: Distribution of the trees on diameter class in standard and coppice forms in the Kasehkaran region.

Figure 6: Distribution diagram of the trees on diameter class in standard and coppice forms in the Avalviar.

Figure 7: Distribution of the trees on diameter class in standard and coppice forms in the Cheshmehpahn.
The abundance of trees across various diameter classes has exhibited a decrease in the studied sites during the second period compared to the first period. In both the Kasehkaran and Avalviar regions, the frequency of coppice oak trees peaks at the 15 and 20 cm diameter classes, respectively. However, as the diameter classes increase, the frequency gradually diminishes. Notably, the maximum distribution of abundance in diameter classes for oak coppice is observed at the 40 cm diameter class for both regions, as depicted in Figures 5 and 6.
There is a decreasing trend in the volume stock in the standard and the coppice form in the second period compared to the first period; (Table 1). The only exception is the volume inventory of standard form on the Kasehkaran site, which did not differ in both periods. The total volume in 2001 was 153, 1174.5, and 565.6 m3, respectively, which decreased to 144, 822, and 515 m3 in 2021, respectively on the Kasehkaran, the Avalviar, and the Cheshmehpahn sites (Table 2).
| Site name | Volume 2001 | Volume 2021 | ||||
| Total | Standard | Coppice | Total | Standard | Coppice | |
| Kasehkaran | 152.85 | 5 | 147.85 | 144.25 | 5.25 | 139 |
| Avalviar | 1174.5 | 992.5 | 182 | 822 | 678 | 144 |
| Cheshmeh pahn | 565.6 | 462.6 | 103 | 515.35 | 414.5 | 100.5 |
Table 2: Total, standard and coppice volume in the study areas in 2001 and 2021.
Qualitative situation
According to Figure 8, the understory agricultural area in Kasehkaran currently exhibits a high abundance of healthy trees. However, there is a notable presence of dead trees in this field, totaling 70 individuals. Additionally, from 2001 to 2021, a significant number of trees, totaling 118, were removed from this location.

Figure 8: Abundance of trees in terms of quality status in the Kasehkaran area.
On the Avalviar site, there is indeed an abundance of trees in the under-story agricultural area. However, the quality status of these trees reveals a concerning imbalance, with a higher prevalence of girdled, dried, and decayed trees compared to healthy ones. Specifically, Figure 9 illustrates that there are 1,011 unhealthy trees compared to 980 healthy stems. Additionally, the data indicates that a total of 523 trees have been removed or eradicated from the site between 2001 and 2021.

Figure 9: Plenty of trees in terms of quality standing in the Avalviar area.
In the Cheshmeh Pahn site, the data indicates that trees categorized as dead and decaying exhibit the highest frequency of being unhealthy, with 138 and 109 stems, respectively. Additionally, this habitat displays a notable presence of girdling trees, totaling 45 stems, consistent with observations from other sites studied. Over the period from 2001 to 2021, a total of 132 stems have been removed through various means (Figure 10).

Figure 10: The prosperity of trees in terms of quality standing in the Cheshmeh Pahn area.
According to the paired t-test with a probability of 99% (p=0.01), the mean comparison analysis of the under-story agriculture fields showed significant differences between the diameter, volume stock, and tree crown factors for all three sites during the two periods (Tables 3-6).
| Differences of pairs | |||||||||
| Number of pairs | Areas of cutting and burning | Mean | Standard deviation | Standard error | Confidence interval 99% | t value | Degree of freedom | Significance | |
| Lower limit | Upper limit | ||||||||
| Pair 1 | Avalviar | 0.1824 | 1.1435 | 0.0256 | 0.1163 | 0.2485 | 7.11 | 1987 | 0.000** |
| Pair 2 | Kasehkaran | 0.015 | 0.0934 | 0.0042 | 0.0042 | 0.0258 | 3.59 | 497 | 0.000** |
| Pair 3 | Cheshmeh Pahn | 0.0627 | 1.0038 | 0.0354 | 0.0287 | 0.1541 | 1.77 | 803 | 0.077** |
| Note: **Significance at the 99% level; *Significance at the 95% level; ns: non-significance | |||||||||
Table 3: Comparison analysis of means in slash and burn agriculture by paired t test.
| Levene's test for equality of variances | t-test for equality of means | |||||||||
| F | Sig. | t | df | Sig. (2-tailed) | Mean difference | Std. error difference | 95% confidence interval of the difference | |||
| Lower | Upper | |||||||||
| Diameter | Equal variances assumed | 0.746 | 0.388 | 2.127 | 3981 | 0.033 | 1.14703 | 0.53924 | 0.08982 | 2.20423 |
| Equal variances not assumed | 2.127 | 3828.886 | 0.033 | 1.14703 | 0.53921 | 0.08986 | 2.20419 | |||
| Crown | Equal variances assumed | 23.478 | 0 | -4.609 | 3981 | 0 | -6.49211 | 1.40843 | -9.25343 | -3.73079 |
| Equal variances not assumed | -4.609 | 3734.024 | 0 | -6.49211 | 1.40853 | -9.25366 | -3.73055 | |||
| Note: **Significance at the 99% level; *Significance at the 95% level; ns: non-significance | ||||||||||
Table 4: Independent samples test results for diameter and tree crown in the Avalviar site.
|
Levene's test for equality of variances |
t-test for equality of means |
|||||||||
|
|
F |
Sig. |
t |
df |
Sig. (2-tailed) |
Mean difference |
Std. error difference |
95% confidence interval of the difference |
||
|
Lower |
Upper |
|||||||||
|
Diameter |
Equal variances assumed |
0.746 |
0.388 |
2.127 |
3981 |
0.033 |
1.14703 |
0.53924 |
0.08982 |
2.20423 |
|
Equal variances not assumed |
|
|
2.127 |
3828.886 |
0.033 |
1.14703 |
0.53921 |
0.08986 |
2.20419 |
|
|
Crown |
Equal variances assumed |
58.323 |
0 |
-8.284 |
3981 |
0 |
-13.2252 |
1.59644 |
-16.3551 |
-10.0953 |
|
Equal variances not assumed |
|
|
-8.283 |
3379.368 |
0 |
-13.2252 |
1.59661 |
-16.3556 |
-10.0948 |
|
|
Note: **Significance at the 99% level; *Significance at the 95% level; ns: non-significance |
||||||||||
Table 5: Independent samples test results for diameter and tree crown in the Kasehkaran site.
| Levene's test for equality of variances | t-test for equality of means | |||||||||
| F | Sig. | t | df | Sig. (2-tailed) | Mean difference | Std. error difference | 95% confidence interval of the difference | |||
| Lower | Upper | |||||||||
| Diameter | Equal variances assumed | 1.26 | 0.262 | 2.038 | 1563 | 0.042 | 1.81529 | 0.89087 | 0.06786 | 3.56273 |
| Equal variances not assumed | 2.051 | 1509.305 | 0.04 | 1.81529 | 0.88496 | 0.0794 | 3.55118 | |||
| Crown | Equal variances assumed | 5.934 | 0.015 | -1.994 | 1563 | 0.046 | -4.66206 | 2.33788 | -9.24777 | -0.07635 |
| Equal variances not assumed | -1.983 | 1467.238 | 0.048 | -4.66206 | 2.35088 | -9.2735 | -0.05062 | |||
| Note: **Significance at the 99% level; *Significance at the 95% level; ns: non-significance | ||||||||||
Table 6: Independent samples test results for diameter and tree crown in the Chesmeh Pahn site.
Discussion
The reduction in canopy area, a crucial aspect of sub-understory farming areas, is evident in the studied habitats during the second period compared to the first. In the Kasehkaran region, there's been a 21.05% decrease, 19.4% in Avalviar, and 14.25% in Cheshmeh Pahn. To date, there haven't been comparable studies across various Zagros ecosystem regions to juxtapose our findings. However, findings from Castro-Luna, et al. resonate with ours, indicating higher tree cover, crown height, and canopy cover in tropical forests compared to secondary vegetation post-shifting cultivation. Similarly, Wallenfang, et al. highlight how prolonged land use affects vegetation diversity and species composition, further supporting our findings.
Comparing transitions across the three sites reveals that the coppice habitat has undergone more changes than the coppice-standard field and the standard site. This disparity arises from the selective loss of shoots within groups over time, leading to the cutting down of more vulnerable shoots. This gradual process, often unnoticed, results in a decline in both the number and area of tree canopies. In some instances, owners of agricultural understory fields first remove crowns in groups and subsequently eliminate stems through girdling or other means.
In the examined sites, both coppice and standard forms of trees have exhibited a decline in abundance during the second period compared to the first. The pseudo-bell-shaped distribution of diameter classes indicates the removal and destruction of trees across both lower and upper diameter classes. These findings align with those of Gogoi, et al. suggesting a consistent trend across different regions. Our research indicates varying tree densities, ranging from 28 individuals per hectare in 5-year-old shifting cultivation to 163 individuals per hectare in old forests without understory cultivation. This spectrum underscores the impact of understory agriculture on tree density.
Additionally, Dalle, et al. findings shed light on the detrimental effects of understory agriculture on landscapes, echoing the challenges observed in our study.
Farmers typically clear young trees and saplings from underground agriculture fields annually, employing manual or mechanized tools, driven by short-term economic gains. This practice leads to a reduction in the number of trees in higher diameter classes while eliminating those in lower diameter classes. Additionally, farmers often resort to burning thick trees affected by decay or hollowing of stumps. Consequently, these trees undergo a gradual decline,ultimately succumbing to environmental factors such as storms, compounded by their weakened structural integrity.
Overall, it's crucial to recognize that the reduction in tree numbers over the two periods is often subtle and inconspicuous in this agricultural practice. Farmers typically remove trees in a manner that minimizes attention and may go unnoticed. Consequently, the distribution curve depicting the number of trees across diameter classes exhibits a consistent pattern across both periods, despite the decrease in tree count observed in 2021 compared to 2001.
Based on the data presented in Table 1, it's evident that the volume of stock for both standard and coppice forms decreased during the second period compared to the first period across the studied site. However, an exception to this trend is observed in the Kasehkaran site, where the volume of stock for the standard form remained unchanged between the two periods. This suggests that trees with the standard form have a higher likelihood of survival. These results are consistent with the findings reported by Molinario, et al. and Mukul.
It's reasonable to expect a decrease in volume, although exceptions like the Kasehkaran habitat may occur. This decline is primarily attributed to the reduction in the number of trees in understory agriculture sites. Despite farmers' annual use of chemical fertilizers to boost crop growth, the trees in these areas often don't benefit directly. This limitation arises from the trees' deeper root systems compared to the shallow roots of agricultural plants. Consequently, the application of fertilizers doesn't directly influence the volume growth of forest trees in these lands.
The assessment of tree quality in shifting agriculture fields across the analyzed habitats indicates a significant removal of trees through various methods during the study period. Human activities, including girdling, burning stumps, lighting fires in tree trunks, uprooting, using petroleum products and derivatives to kill standing trees, cutting, and manipulating the top branches of trees and coppice stems for animal feed, are the primary reasons for this removal. Additionally, the understory agriculture fields contain a considerable number of naturally occurring dead trees, along with those affected by human factors.
In the affected regions, oak trees are experiencing mortality due to various natural causes, including climate change and global warming. These factors have led to reduced rainfall, longer droughts, temperature variations, lower humidity levels, and frost. Moreover, trees are being impacted by air pollution, including fine dust, as well as pests and diseases such as mistletoe, wood-borer beetles, fungi, pathogenic bacteria, and charcoal fungus disease. Other contributing factors include ecological characteristics, habitat quality, and the age, diameter, and height of the trees, which collectively exacerbate the issue, akin to other forest areas.
Human activities, particularly in slash-and-burn agriculture, are significantly contributing to the destruction of oak trees. In the Zagros forests, these activities within the understory agriculture fields are hastening the degradation of forest ecosystems. Practices such as land plowing, the use of fertilizers and pesticides, and the movement of agricultural machinery are resulting in the loss of vegetation and fauna, soil erosion, and the depletion of water resources. Moreover, these activities elevate the risk of forest fires. While in agriculture, many invertebrates and plants are regarded as pests and are eliminated to boost crop yield, these organisms play vital roles in maintaining the sustainability of forest ecosystems.
Under-tree agriculture is a customary practice among local communities residing in forest habitats, serving as a traditional livelihood dependent on forests. However, there have been attempts to introduce this practice as a form of agroforestry, which contradicts the principles of agroforestry activities. Agroforestry entails the integration of various activities such as forestry, agriculture, and animal husbandry on farmlands, aiming to generate income, enhance food security, and promote environmental sustainability through the sustainable production of agricultural products.
Understory cultivation, which involves growing crops beneath the canopy of forest trees, is prevalent in forested areas. Nonetheless, this practice can lead to the degradation of forest ecosystems over time. While employment and income are crucial concerns for local communities, alternative methods can be explored to achieve these objectives without causing harm to the environment. For example, promoting nature tourism and planning for the sustainable utilization of medicinal plants are viable options. Additionally, investing in knowledge-based agricultural activities that optimize water and land usage can create employment opportunities while ensuring environmental sustainability.
Ensuring the sustainability of vulnerable ecosystems in the Zagros forests necessitates the exploration of alternative livelihood options for local communities. This involves adopting practices that are environmentally friendly and contribute to the conservation of forest resources.
Conclusion
It's crucial to recognize that while the physical boundaries and extent of underground agriculture fields and existing trees remain consistent, their structural attributes have undergone changes over time despite existing legal restrictions and challenges. To unveil these changes, it is recommended that relevant governing bodies conduct regular monitoring of these areas through periodic sampling, alongside implementing standard protective measures. This approach will facilitate the monitoring of both quantitative and qualitative characteristics over time, enabling better understanding and management of these ecosystems.
References
- Barbier EB, Burgess JC (2001) The economics of tropical deforestation. J Econ Surv 15: 413-433.
- Byerlee D, Stevenson J, Villoria N (2014) Does intensification slow crop land expansion or encourage deforestation? Glob Food Secur 3: 92-98.
- Castro-Luna AA, Castillo-Campos G, Sosa VJ (2011) Effects of selective logging and shifting cultivation on the structure and diversity of a tropical evergreen forest in south-eastern Mexico. J Trop for Sci 17-34.
- Cullotta S, Boncina A, Carvalho-Ribeiro SM, Chauvin C, Farcy C, et al. (2015) Forest planning across Europe: the spatial scale, tools, andinter-sectoral integration in land-use planning. J Environ Plann Man 8: 1384-1411.
- Dalle SP, Pulido MT, Blois SD (2011) Balancing shifting cultivation and forest conservation: lessons from a “sustainable landscape” in southeastern Mexico. Ecol Appl 21: 1557-1572.
- De Sy V, Herold M, Achard F, Beuchle R, Clevers JGPW, et al. (2015) Land use patterns and related carbon losses following deforestation in South America. Environ Res Lett 10: 124004.
- Fitzherbert EB, Struebig MJ, Morel A, Danielsen F, Brühl CA, et al. (2008) How will oil palm expansion affect biodiversity? Trends Ecol Evol 23: 538-545.
[Crossref] [Google Scholar] [PubMed]
- Gogoi A, Sahoo UK, Saikia H (2020) Vegetation and ecosystem carbon recovery following shifting cultivation in Mizoram-Manipur-Kachin rainforest eco-region, Southern Asia. Ecol Process 9: 1-13.
- Goudarzian P, Erfanifard U, Sadeghi H (2013) Detection and classification of available agroforestry systems in Fars province (case study: Kazerun city). J Agric Sci Sustain Prod 23: 55-70.
- Karimi H, Karami G, Mousavi SM (2019) Investigating of characteristic and contexts of agroforestry system development. Hum Environ 17: 79-90.
- Kadoya T, Takeuchi Y, Shinoda Y, Nansai K (2022) Shifting agriculture is the dominant driver of forest disturbance in threatened forest species’ ranges. Commun Earth Environ 3: 108.
- Keenan RJ (2015) Climate change impacts and adaptation in forest management: a review. Ann for Sci 72: 145-167.
- Kukla J, Whitfeld T, Cajthaml T, Baldrian P, Frouz J, et al. (2019) The effect of traditional slashâ?ÂÂÂÂÂÂandâ?ÂÂÂÂÂÂburn agriculture on soil organic matter, nutrient content, and microbiota in tropical ecosystems of Papua New Guinea. Land Degrad Dev 30: 166-177.
- Makana JR, Thomas SC (2006) Impacts of selective logging and agricultural clearing on forest structure, floristic composition and diversity, and timber tree regeneration in the Ituri Forest, Democratic Republic of Congo. Forest Diversity Manag 315-337.
- Molinario G, Hansen MC, Potapov PV (2015) Forest cover dynamics of shifting cultivation in the Democratic Republic of Congo: a remote sensing-based assessment for 2000–2010. Environ Res Lett 10: 094009.
- Rudel TK, Schneider L, Uriarte M, Turner BL, DeFries R, et al. (2009) Agricultural intensification and changes in cultivated areas, 1970–2005. Proc Natl Acad Sci USA 106: 20675-20680.
[Crossref] [Google Scholar] [PubMed]
- Porter-Bolland L, Ellis EA, Guariguata MR, Ruiz-Mallén I, Negrete-Yankelevich S, et al. (2012) Community managed forests and forest protected areas: An assessment of their conservation effectiveness across the tropics. For Ecol Manag 268: 6-17.
- Pretzsch H (2021) Trees grow modulated by the ecological memory of their past growth. Consequences for monitoring, modelling, and silvicultural treatment. For Ecol Manag 487: 118982.
- Wallenfang J, Finckh M, Oldeland J, Revermann R (2015) Impact of shifting cultivation on dense tropical woodlands in southeast Angola. Trop Conserv Sci 8: 863-892.
- Zabihollahi S, Fathizadeh O, Jamshidi Bakhtar A, Shabanian N, Namiranian M, et al. (2021). Horizontal and vertical structure of northern Zagros forests in relation to traditional forestry system (Case study: Havare-Khol Forests). Ecol Iran For 9: 62-74.