Research Article, Int J Cardiol Res Vol: 14 Issue: 1
Three and Four Dimensional Characteristics of Color Doppler M-Mode Echocardiography
Seyed Babak Moosavi Toomatari1*, Kamal Khademvatani2, Seyedeh Zahra Karimi Sarabi3
1Department of General Surgery, Tabriz Azad University of Medical Sciences, Tabriz, Iran
2Department of Cardiology, Urmia University of Medical Sciences, Urmia, Iran
3Department of Anesthesiology, Noor Nejat Hospital, Tabriz, Iran
*Corresponding Author:Seyed Babak Moosavi Toomatari
Department of General Surgery, Tabriz Azad University of Medical Sciences, Tabriz, Iran
E-mail: bmoosavit@gmail.com
Received date: 13 November, 2023, Manuscript No. ICRJ-24-119919;
Editor assigned date: 15 November, 2023, PreQC No. ICRJ-24-119919 (PQ);
Reviewed date: 29 December, 2023, QC No. ICRJ-24-119919;
Revised date: 24 February, 2025, Manuscript No. ICRJ-24-119919 (R);
Published date: 03 March, 2025, DOI: 10.4172/2324-8602.1000601
Citation:Toomatari SBM, Khademvatani K, Sarabi SZK (2025) Three and Four Dimensional Characteristics of Color Doppler M-Mode Echocardiography.
Int J Cardiol Res 14:1.
Abstract
This article introduces a novel approach to displaying three and four-dimensional color M-mode echocardiography, focusing on the descending aorta. Traditionally, echocardiography primarily utilizes B-mode and M-mode imaging, but this study innovatively explores the visualization of color Doppler M-mode echocardiography. By analyzing Doppler data extracted from the descending aorta using a vivid-6 echocardiography device, the authors developed a Windows-based software for comprehensive analysis. The method involves extracting data from one complete heart cycle, analyzing color-coded data of systole and diastole, and representing each pixel's Doppler data on a three-dimensional chart. Additionally, the authors propose a method to spread a heart cycle in 360 degrees around the Y-axis, resulting in a four-dimensional visualization. The results demonstrate the visualization of major and minor flows in the descending aorta, with potential applications in assessing conditions such as aortic valve insufficiency.
Keywords: Color Doppler; M-mode echocardiography; Visualization; Aortic valve
Introduction
Edler and Hertz recorded heart movement by means of ultrasound in 1954 that displayed heart's structures based on ultrasound waves and their reflections [1,2]. But, two-dimensional echocardiography as a reliable modality to examine heart morphology and function was developed in 1970’s and equipped by Doppler and also color Doppler in 1980’s [3-5].
Generally, B-mode (Brightness mode) and M-mode (Motion mode) are two main modes of ultrasonography that display images of body structures. Unlike B-mode that is used in general imaging including heart imaging, M-mode is especially used in echocardiography [6,7]. B-mode images are combination of pixels that each pixel has a position and brightness. The position is determined based on the depth of reflected echo and the brightness is determined based on the amplitude of reflected echo. So, real-time B-mode images are created by recording of each point gray-scale continuously [8,9].
In M-mode echocardiography as an old echography mode, an ultrasonic wave is sent and received in a single line to produce one dimensional image. High frequency repetition of sending and receiving signal can produce a two dimensional image by placing a cursor on heart structures.
When a sound source or receiver moves, frequency is changed; this change named as Doppler’s effect [10]. Doppler effect is used to reveal the direction and velocity of blood flow (exactly blood cells). If blood cells move toward the transducer, the returning frequency will be higher than main frequency and vice versa.
Pulse Wave (PW) Doppler, Continuous Wave (CW) Doppler, color Doppler and power Doppler are most common Doppler modes that used in medical purposes. One crystal is used to send and receive ultrasonic waves in pulse Doppler mode. PW cannot measure velocity of high blood flow. To solve this, CW Doppler mode is used that contains two crystals, one for sending and one for receiving ultrasound waves continuously [11].
In medical utilization, direction and velocity of blood flow is displayed in colors: Blue for blood flow direction away from transducer and red for blood flow toward transducer, conventionally [12].
In this article we introduce a new approach to display and analyze color Doppler M-mode echocardiography of Descending aorta.
Materials and Methods
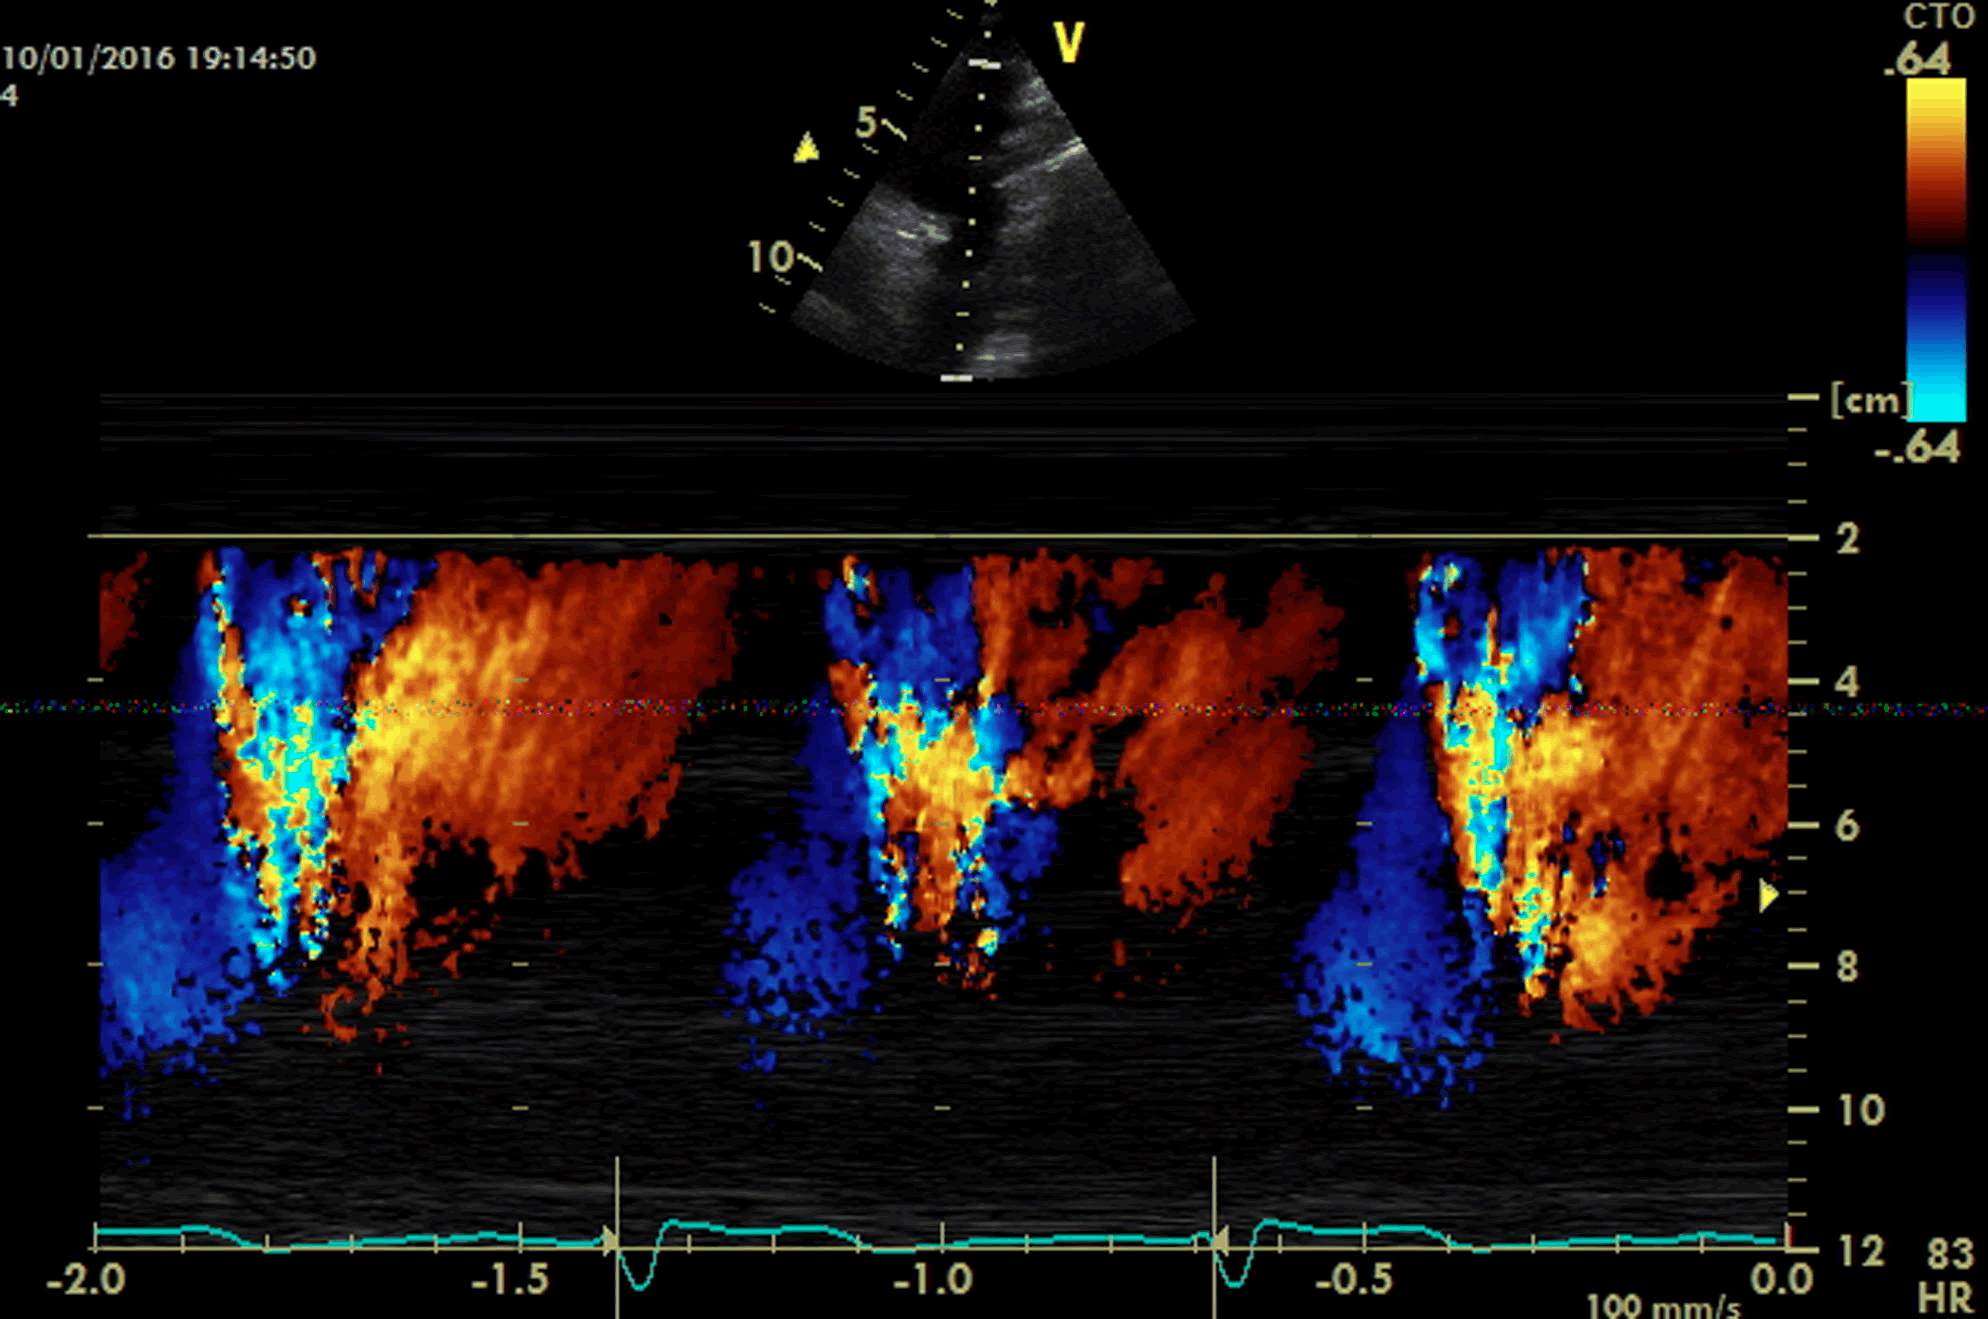
We analyze color Doppler M-mode of descending aorta by using a vivid-6 echocardiography device. Color Doppler M-mode data is extracted at the beginning of descending aorta and saved as a two dimensional jpeg image in 24 bits RGB color format (Figure 1).
Figure 1: Color Doppler M-mode echocardiography of descending aorta.
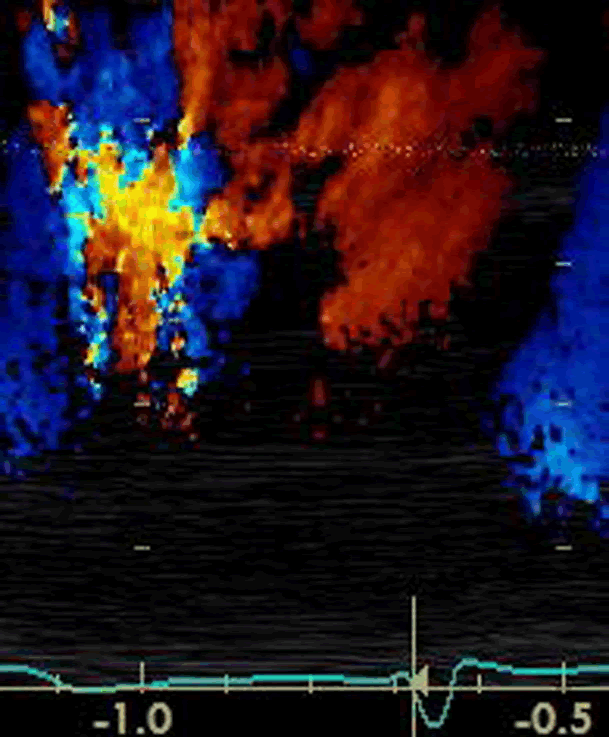
We designed a Windows-based software to analyze Doppler images. At the 1st step, jpeg image is opened and one complete heart cycle is extracted in a rectangular that contains all Doppler data (Figure 2).
Figure 2: Extracted data of one complete heart cycle.
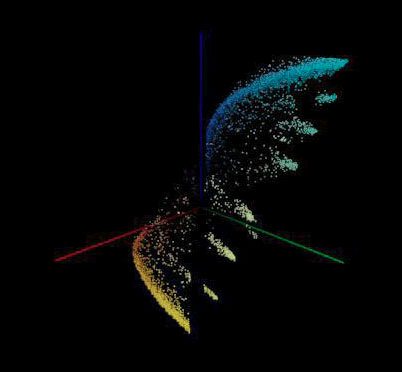
At the 2nd step extracted color-coded data of systole and diastole analyzed; each pixel which contains Doppler data is displayed on a three dimensional chart with X, Y and Z axis, where any axis divided into 256 equal parts (0 to 255). X axis represents green color, Y axis represents blue and Z axis represents red color of each pixel and a three dimension chart of color Doppler M-mode of descending aorta is displayed (Figure 3).
Figure 3: Three dimensional view of color Doppler M-mode echocardiography.
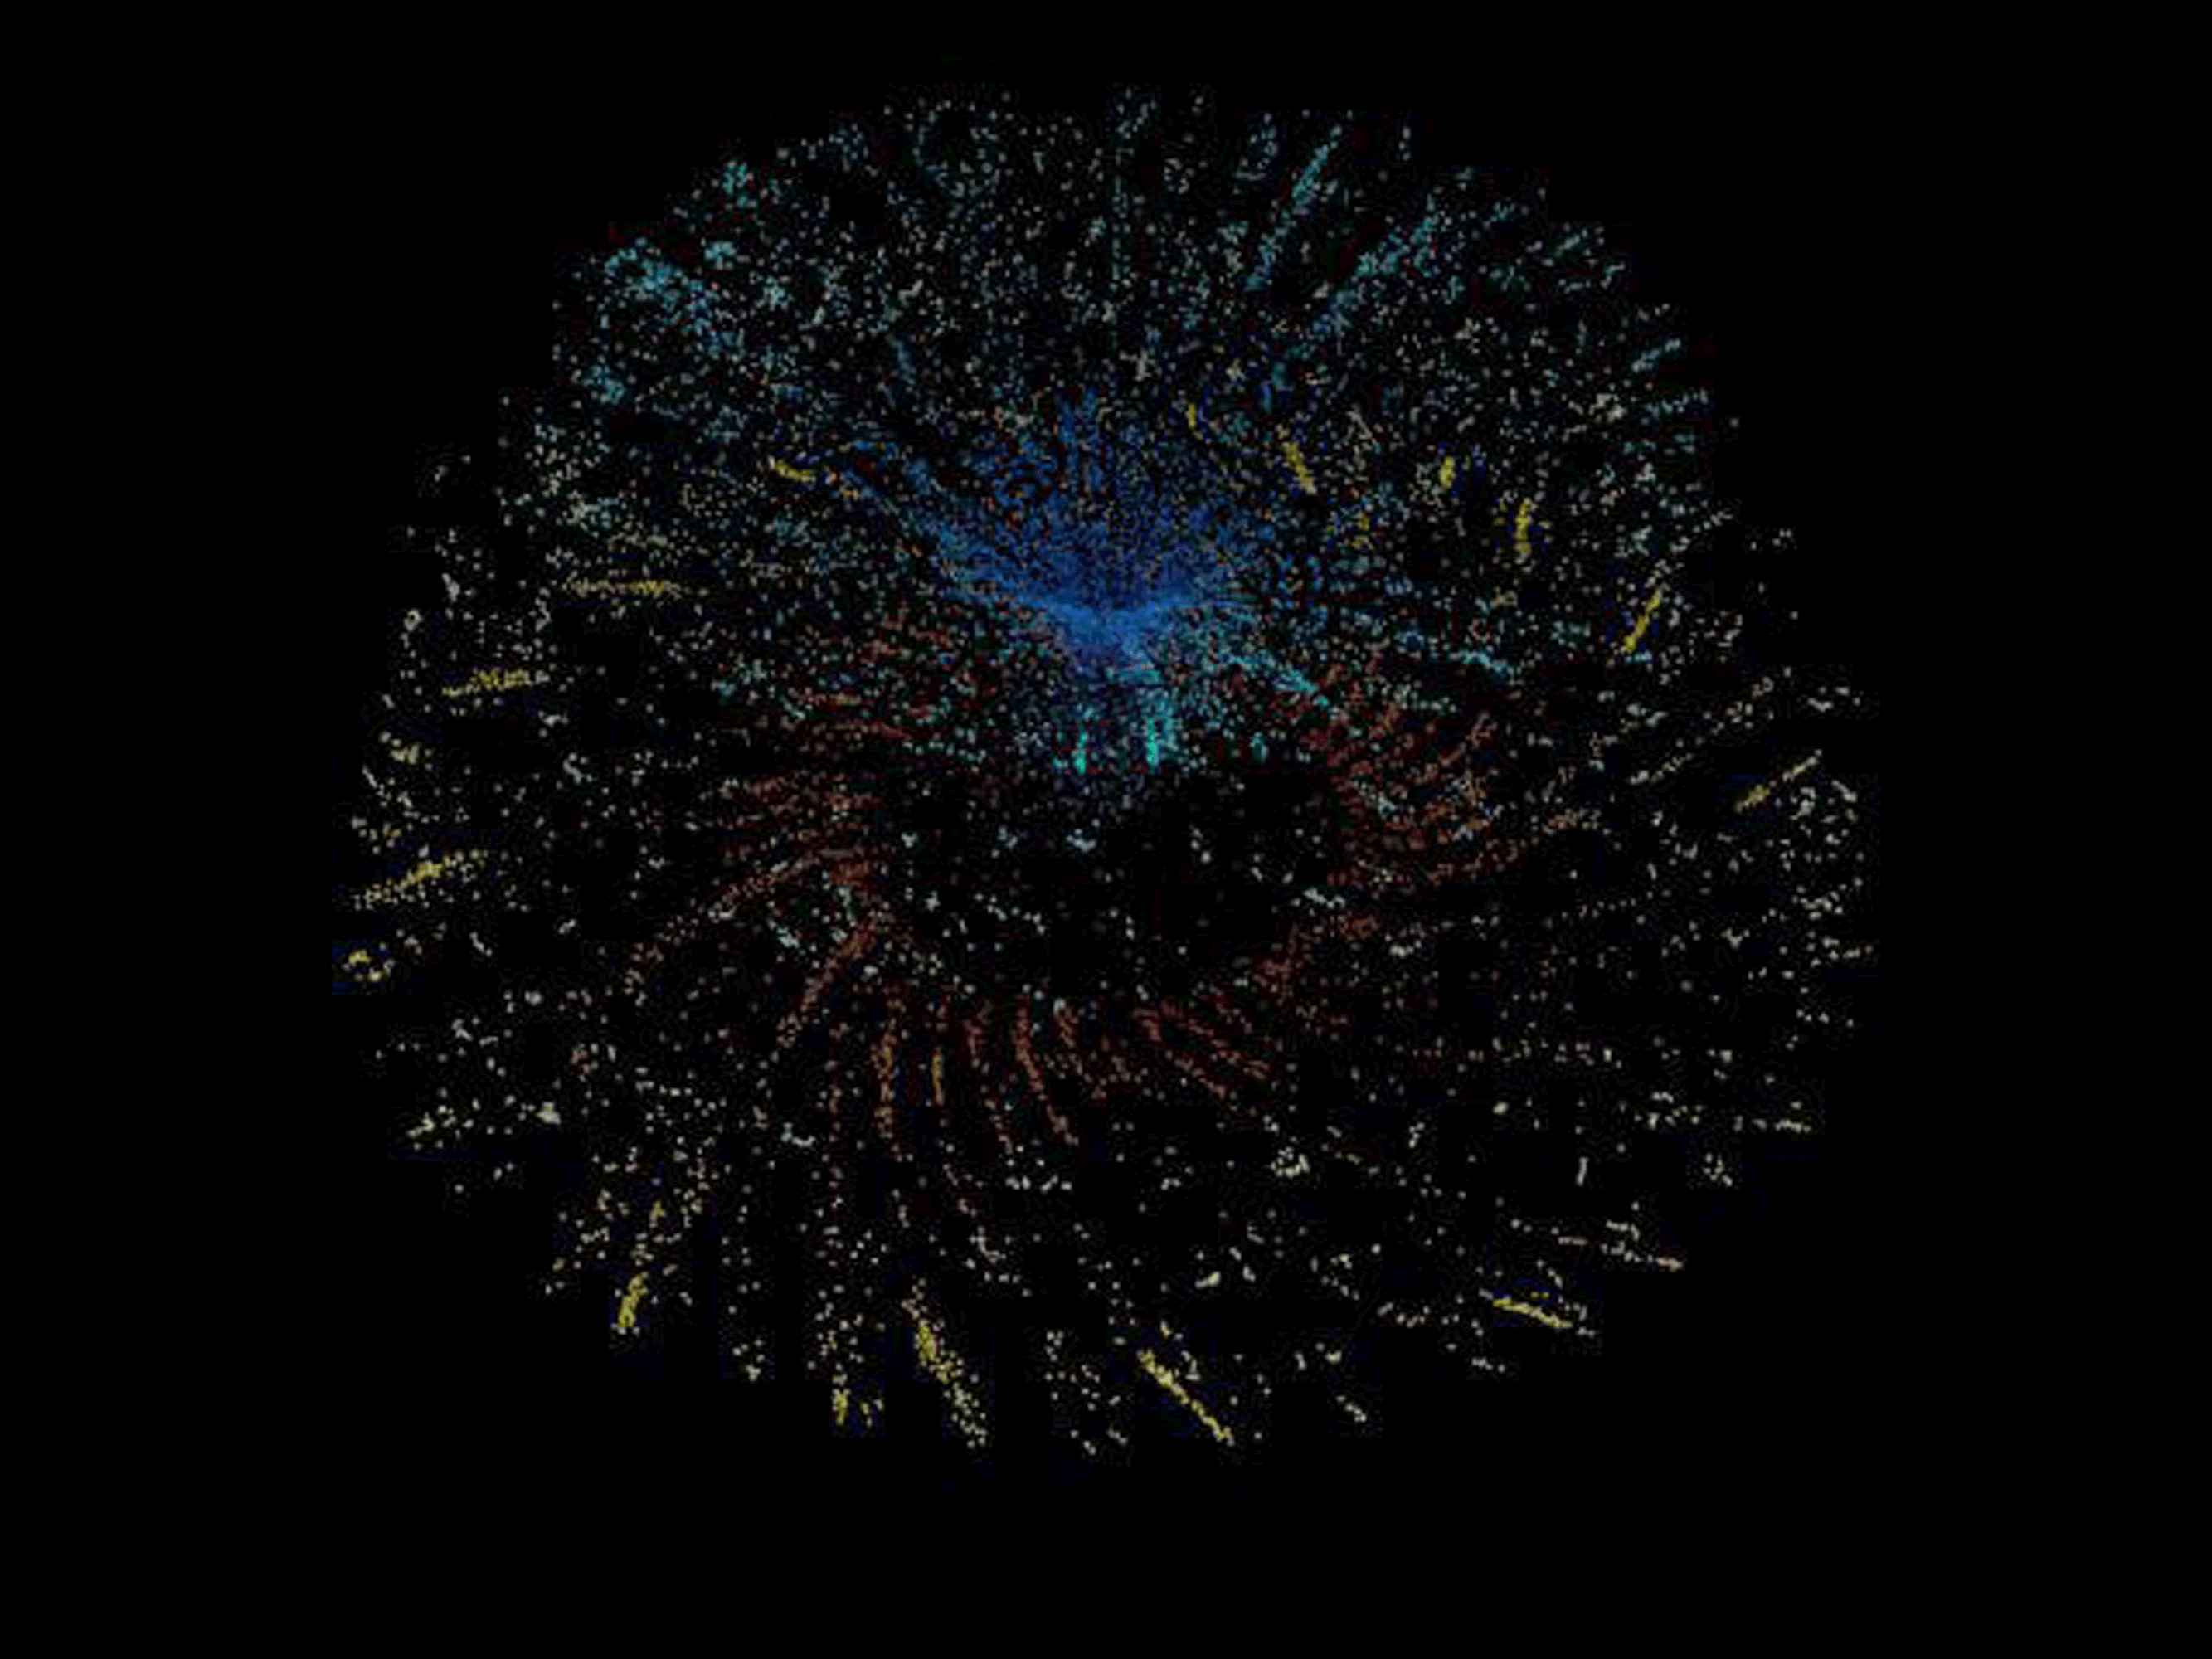
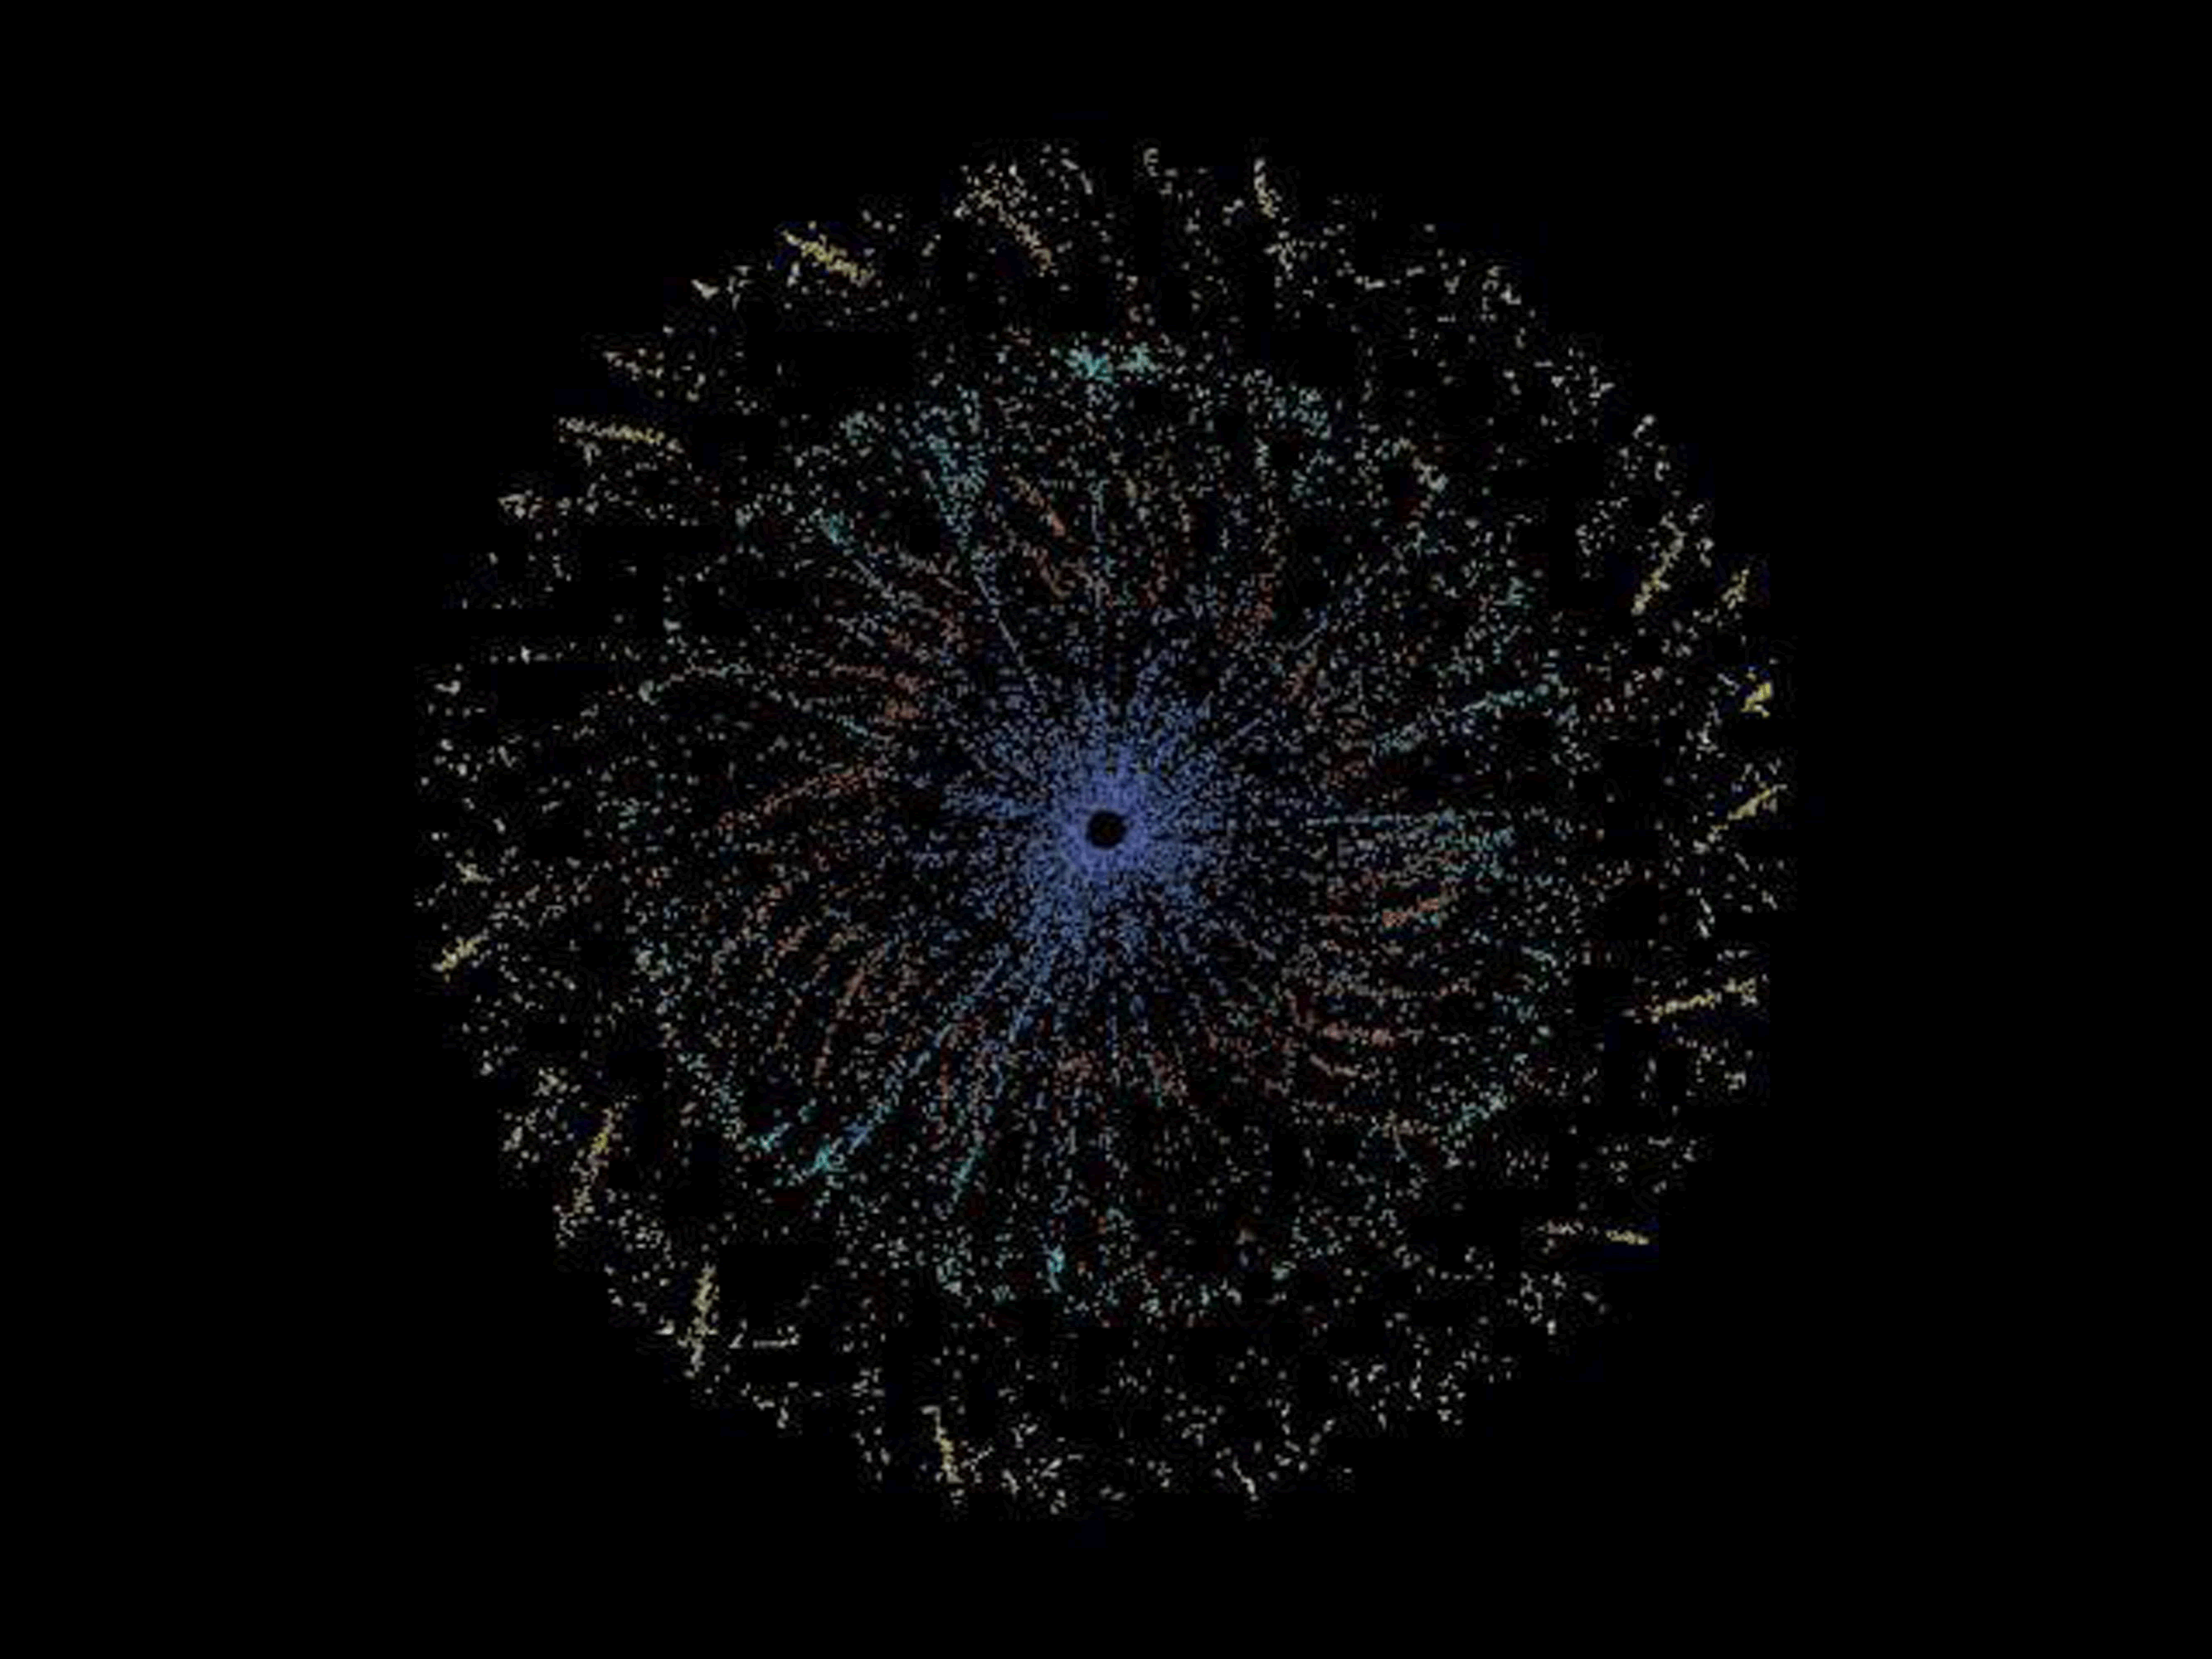
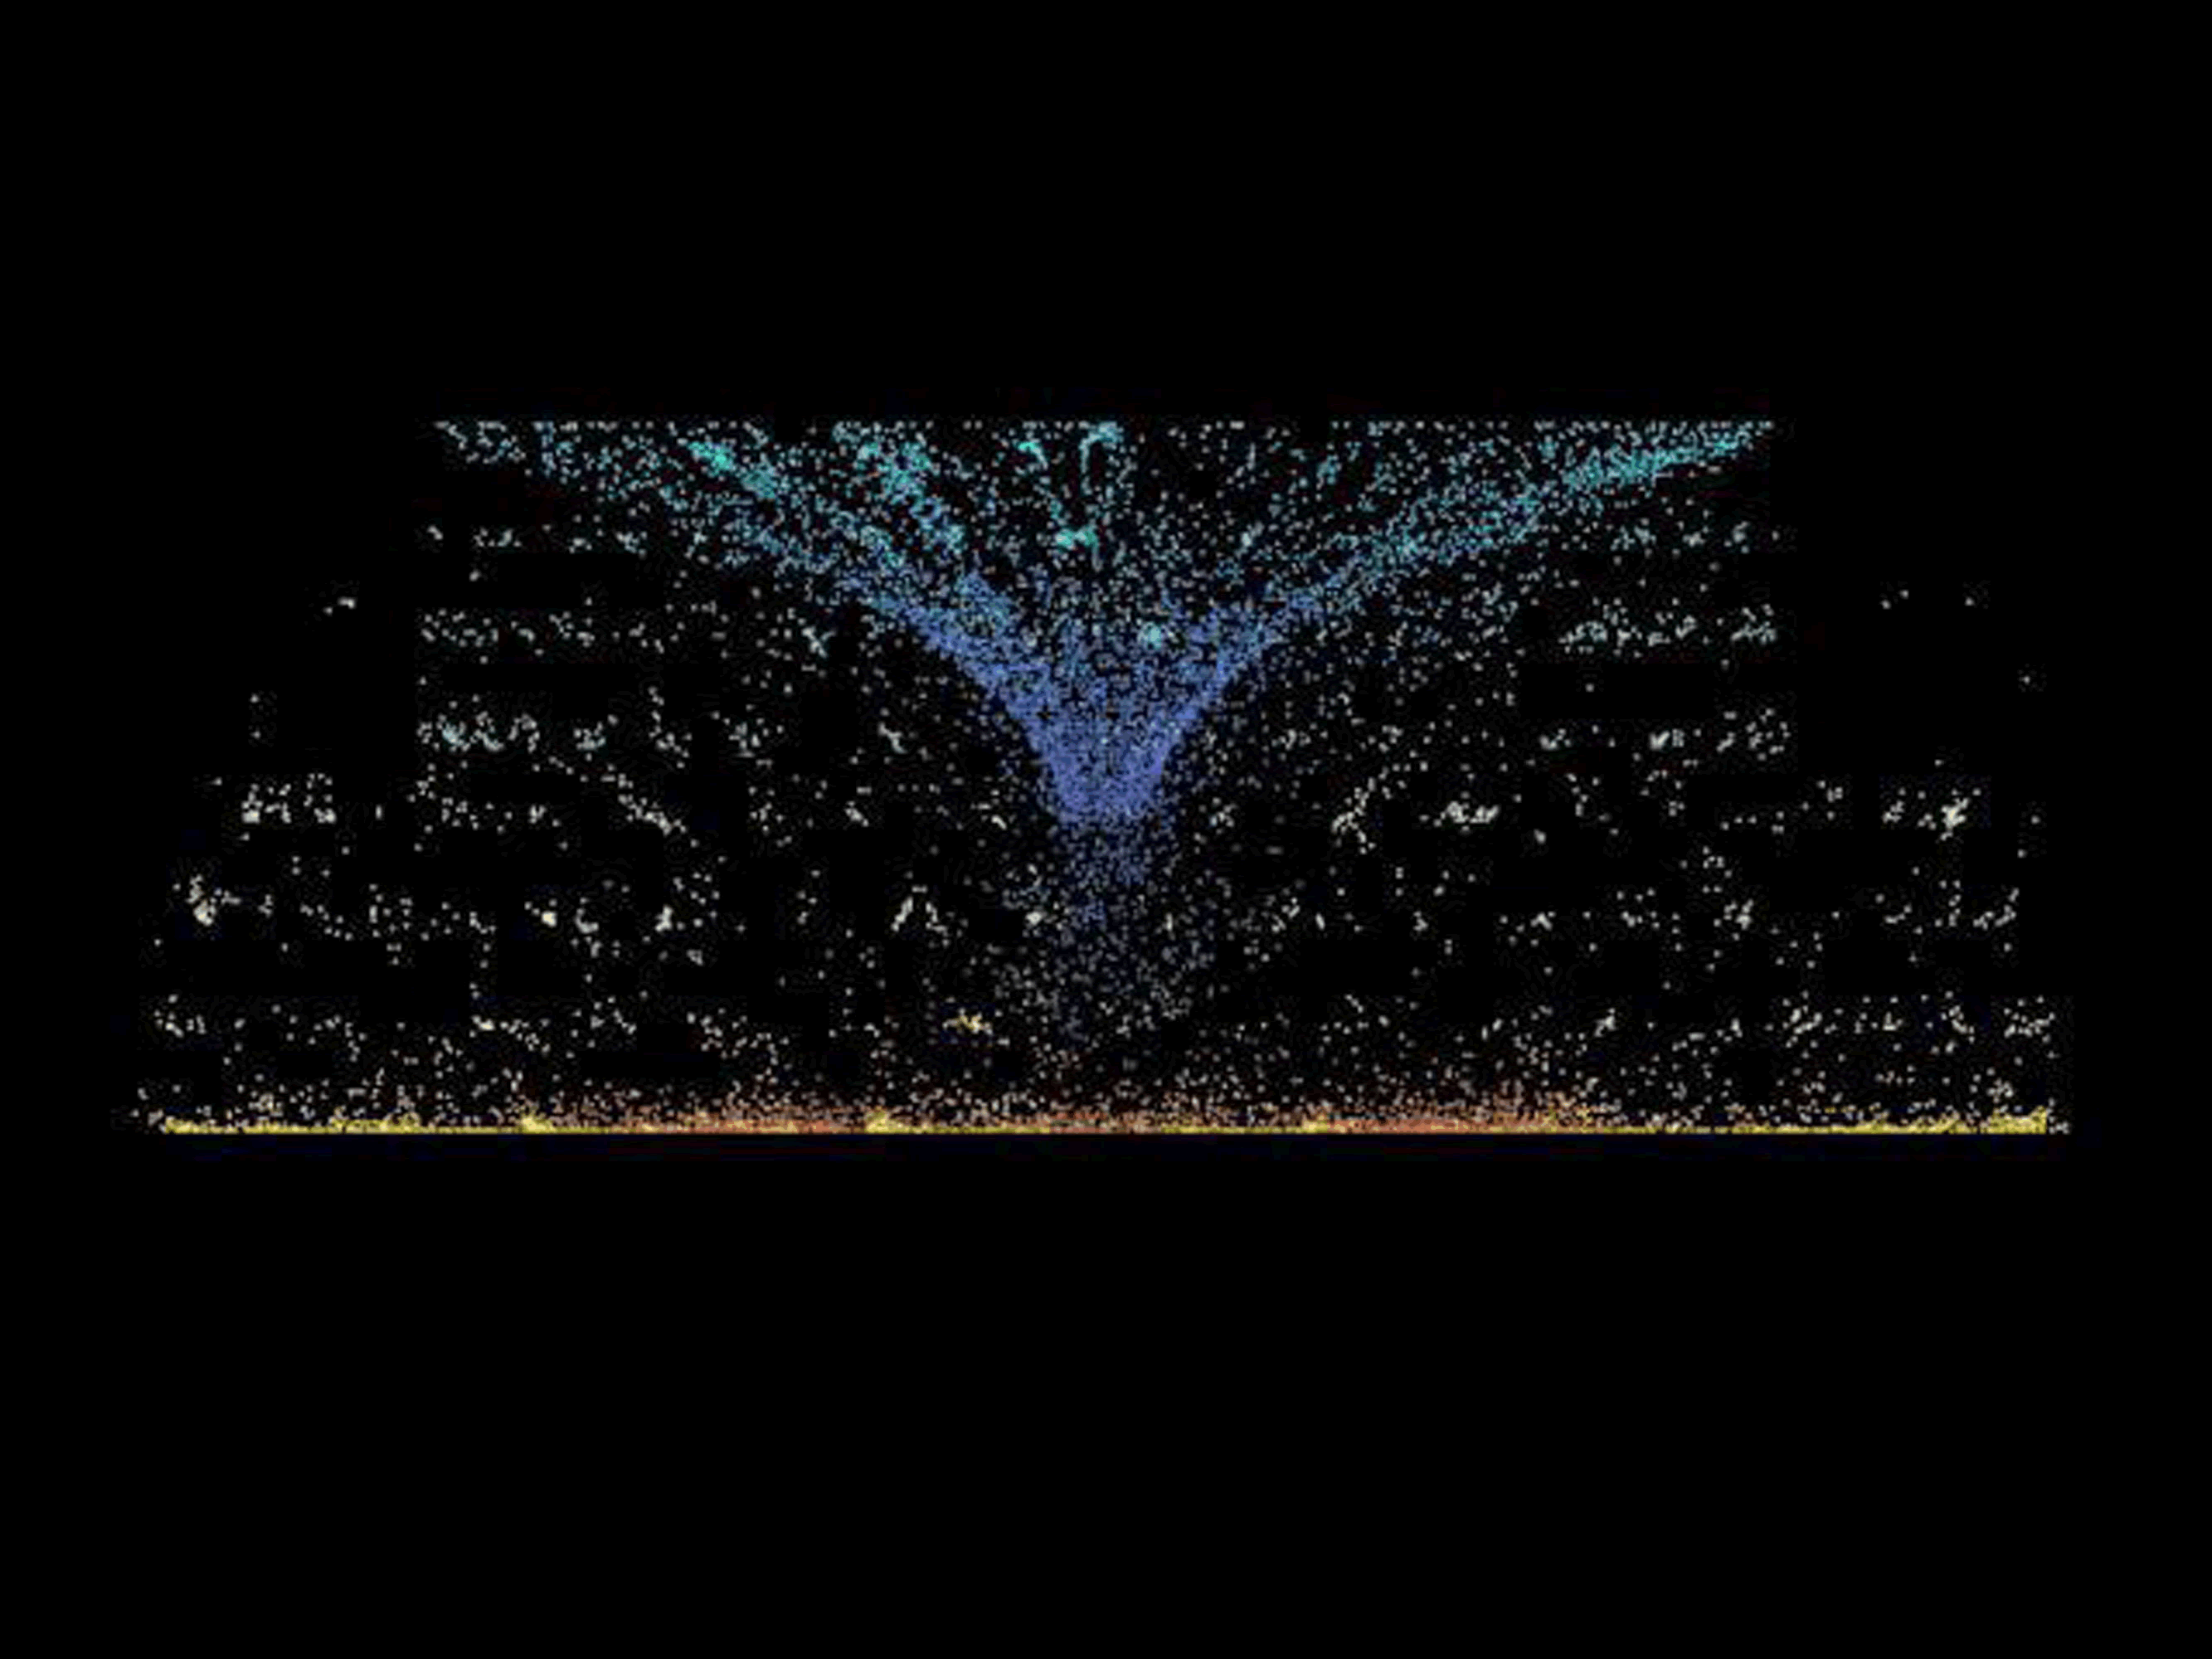
Now, we decide to display each pixel of color Doppler data in any time of a heart cycle. So, we spread a cycle of heart bit in 360 degree around Y axis. Therefore, 1 millisecond of a complete heart cycle will be equal to 360/duration. Finally, a four dimensional diagram will display as perspective, top and lateral view (Figures 4-6).
Figure 4: Four dimensional view of color doppler M-mode echocardiography, perspective view.
Figure 5: Four dimensional view of color Doppler M-mode echocardiography, top view.
Figure 6: Four dimensional view of color Doppler M-mode echocardiography, lateral view.
Results and Discussion
Two major flows (toward and away from transducer) and six minor flow (toward and away from transducer) is displayed in Figure 3. Major flows are main aortic flow and minor flows belong to first three branches of descending aorta. While turbulence of descending aorta is increased, such as aortic valve insufficiency, flow toward transducer is increased.
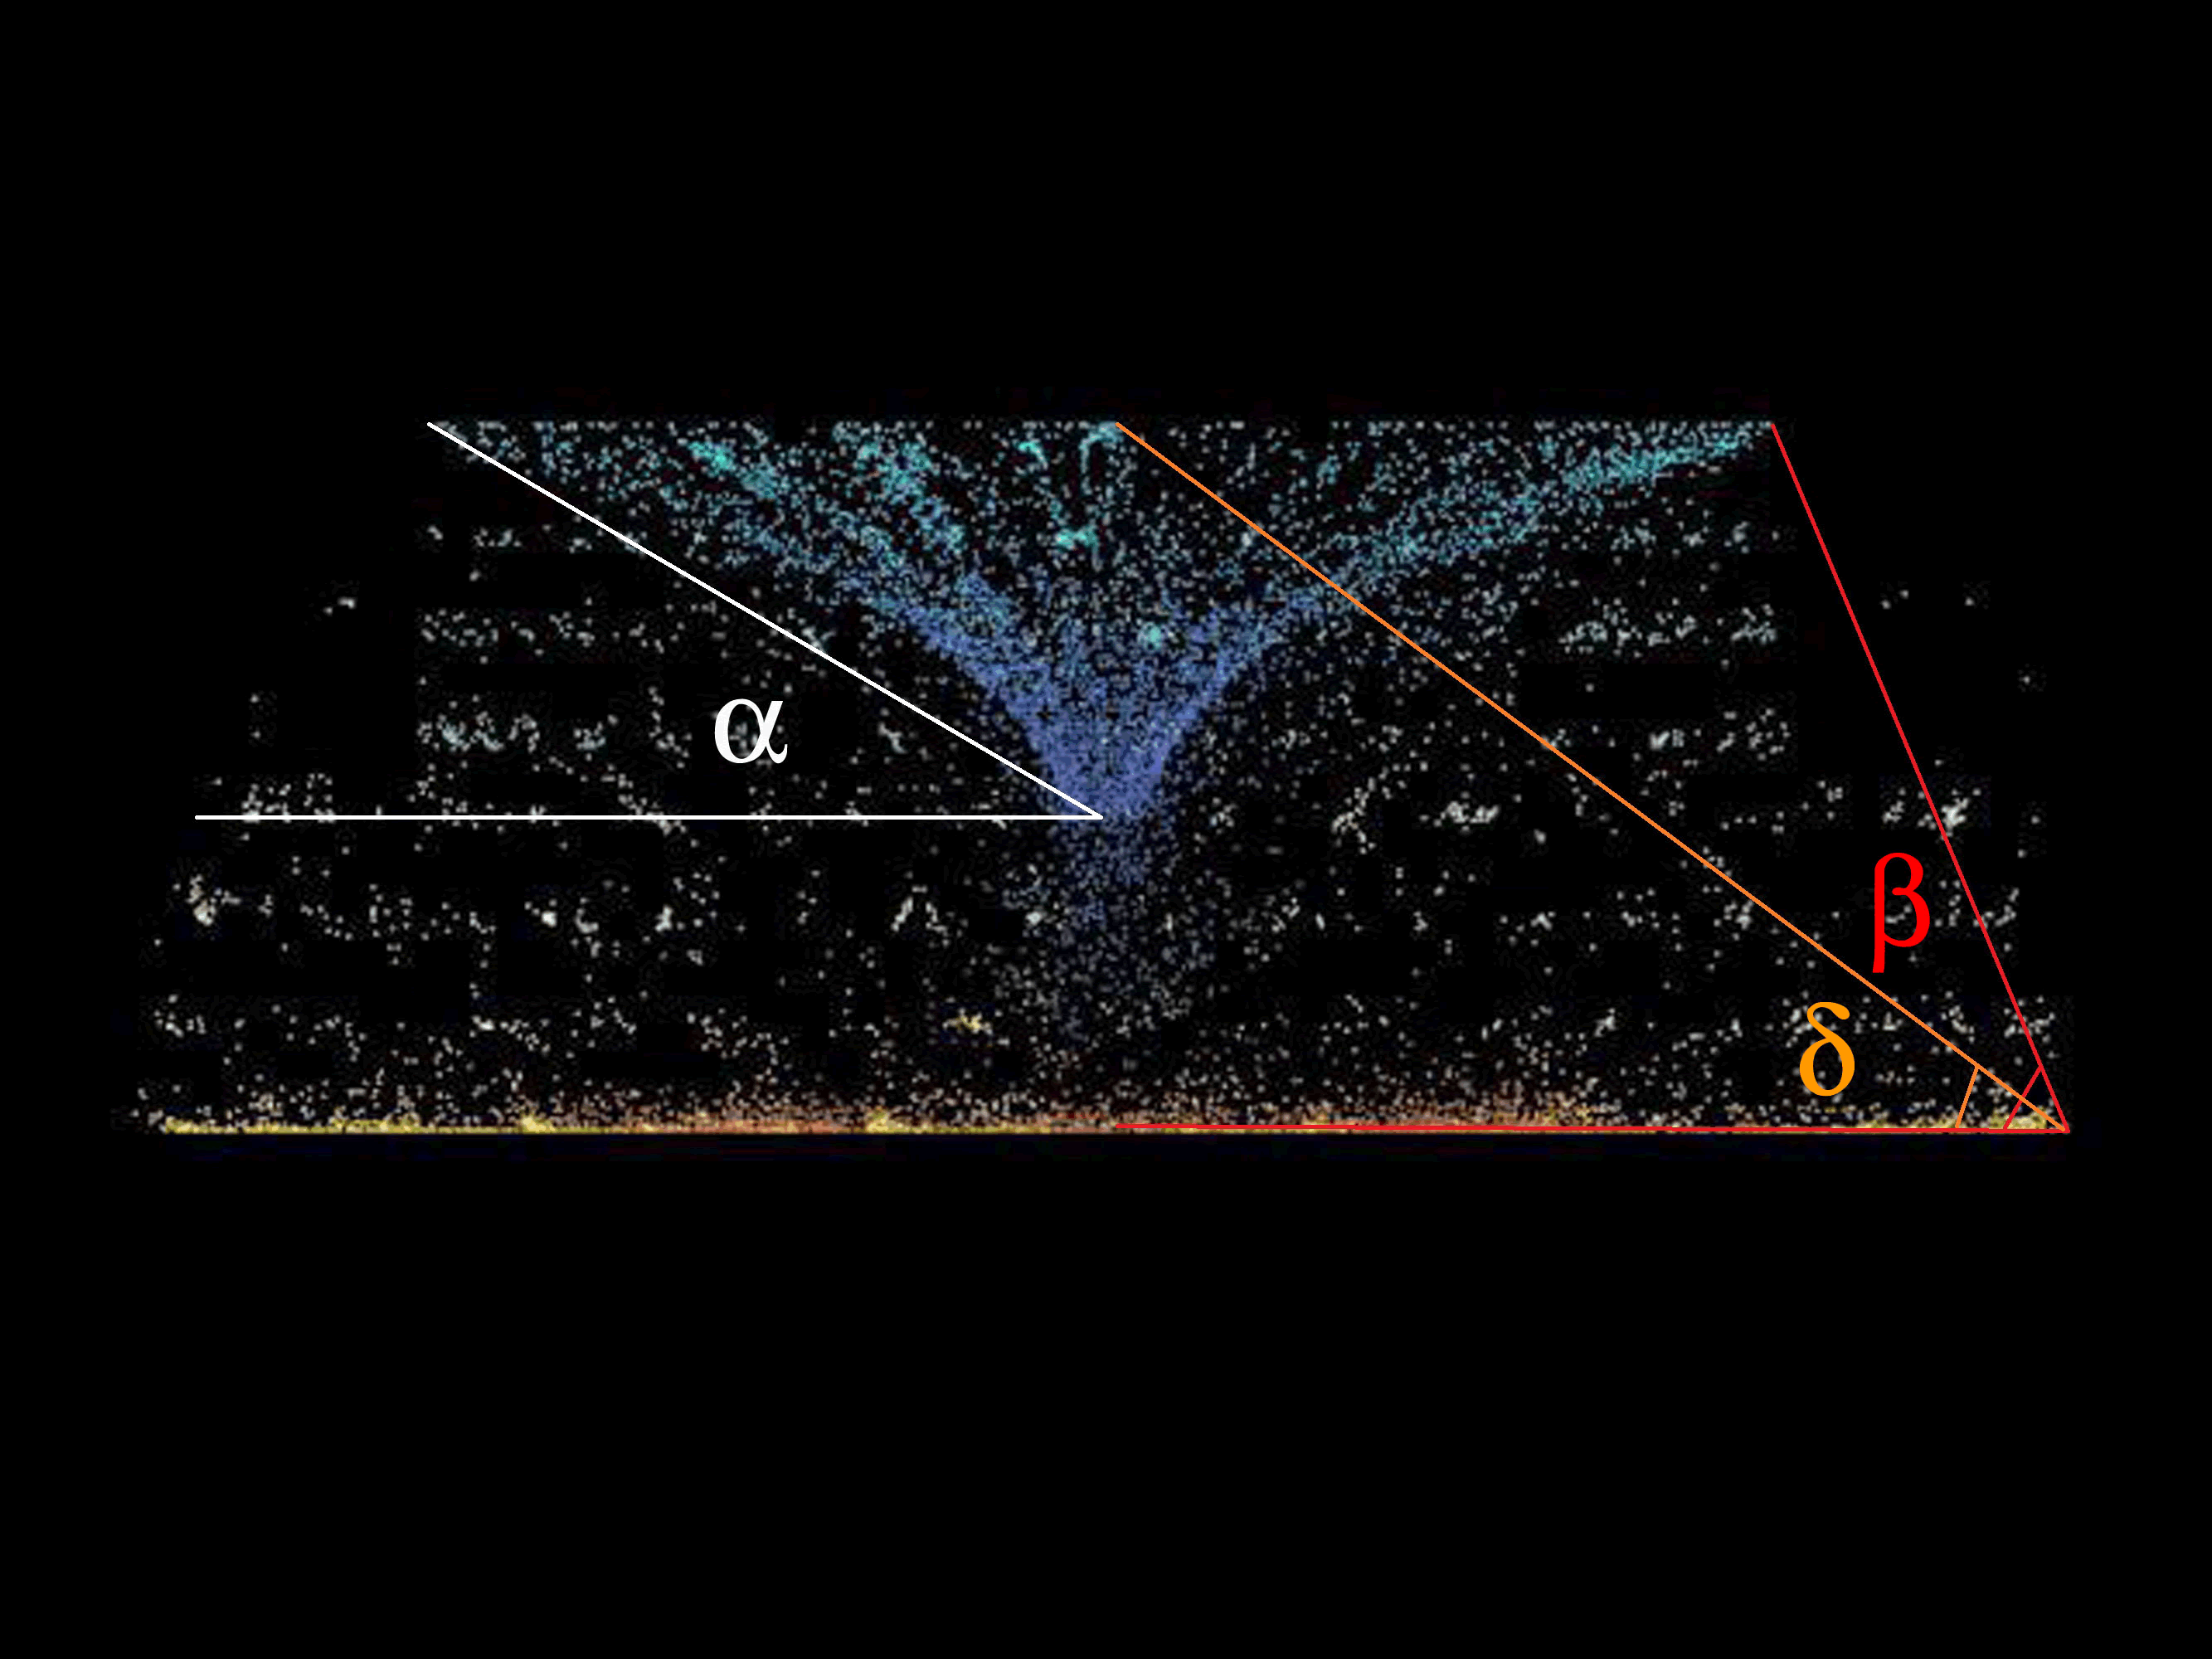
We introduce a new approach to display color Doppler M-mode echocardiography in three dimension and four dimension view. To quantified analysis at least four parameters could be extracted as number of pixels: Systolic Flow toward Transducer (SFT), Systolic Flow Away from transducer (SFA), Diastolic Flow toward Transducer (DFT), Diastolic Flow Away from transducer (DFA). We decide additional equation that may be useful: SFA/SFT, DFT/DFA, SFA/DFT and (SFA/SFT)/(DFT/DFA). Also, geometric analysis of color Doppler M-mode echocardiography such as sinus of angles α, β and δ may be valuable (Figure 7).
Figure 7: Geometric data of color Doppler M-mode echocardiography.
Conclusion
In conclusion, this study presents an innovative approach to enhance the visualization and analysis of color Doppler M-mode echocardiography, particularly focusing on the descending aorta. The introduced method offers a comprehensive understanding of blood flow dynamics and turbulence, crucial for diagnosing cardiovascular conditions. By incorporating three and four-dimensional views, along with quantitative parameters and geometric analyses, this approach provides valuable insights for clinicians in assessing cardiac function and identifying abnormalities. Further research and clinical validation are warranted to explore the full potential of this technique in improving diagnostic accuracy and patient care in cardiovascular medicine.
References
- Edler I (1954) The use of ultrasonic reflectoscope for the continuous recording of the movements of heart walls. Clin Physiol Funct Imaging 24: 1-9.
- Fraser AG (2001) Inge Edler and the origins of clinical echocardiography. Eur J Echocardiogr 2: 3–5.
[Crossref] [Google Scholar] [PubMed]
- Armstrong WF, Ryan T (2010) Feigenbaum’s echocardiography. 7th ed., Lippincott Williams & Wilkins, Philadelphia, USA.
- Tajik AJ, Seward JB, Hagler DJ, Mair DD, Lie JT (1978) Two-dimensional real-time ultrasonic imaging of the hean and great vessels: Technique, image orientation, structure identification, and validation. Mayo Clin Proc 53: 271–303.
[Google Scholar] [PubMed]
- Edler I, Lunstorm K (2004) History of echocardiography. Ultrasound Med Biol 30: 1565–1644.
[Crossref]
- Dillon JC, Feigenbaum H, Konecke LL, Davis RH, Chang S (1973) Echocardiographic manifestations of valvular vegetations. Am Heart J 86: 698–704.
[Crossref] [Google Scholar] [PubMed]
- Huda W, Slone R (1996) Review of radiologic physics. Phys Med Biol 41: 2807.
- Kremkau FW (2010) Sonography principles and instruments. Elsevier Health Sciences, Amsterdam, Netherlands.
- Curry TS, Dowdey JE, Murry RC (1990) Christensen’s physics of diagnostic radiology. Lippincott Williams & Wilkins, Philadelphia, USA.
- Anavekar NS, Oh JK (2009) Doppler echocardiography: A contemporary review. J Cardiol 54: 347–358.
[Crossref] [Google Scholar] [PubMed]
- Quinones MA, Otto CM, Stoddard M, Waggoner A, Zoghbi W (2002) Recommendations for quantification of Doppler echocardiography: A report from the Doppler quantification task force of the nomenclature and standards committee of the American society of echocardiography. J Am Soc Echocardiogr 15: 167–184.
[Crossref] [Google Scholar] [PubMed]
- Zoghbi WA, Adams D, Bonow RO, Enriquez-Sarano M, Foster E, et al. (2017) Recommendations for noninvasive evaluation of native valvular regurgitation: A report from the American society of echocardiography developed in collaboration with the society for cardiovascular magnetic resonance. J Am Soc Echocardiogr 30: 303-371.
[Crossref] [Google Scholar] [PubMed]
 Spanish
  Chinese
  Russian
  German
  French
  Japanese
  Portuguese
  Hindi
Hindi 