Spanish
  Chinese
  Russian
  German
  French
  Japanese
  Portuguese
  Hindi
Hindi Research Article, J Phys Res Appl Vol: 7 Issue: 4
Towards a Decarbonized Individual Mobility - Challenges and Solutions
Alfred Rufer*
School of Engineering, EPFL, Ecole Polytechnique Fédérale de Lausanne, Switzerland
*Corresponding Author: Alfred Rufer
School of Engineering, EPFL, Ecole Polytechnique Fédérale de Lausanne, Switzerland
E-mail: alfred.rufer@epfl.ch
Received date: 25 November, 2023, Manuscript No. JPRA-23-121089;
Editor Assigned: 27 November, 2023, Pre QC No. JPRA-23-121089 (PQ);
Reviewed Date: 11 December, 2023, QC No. JPRA-23-121089;
Revised Date: 18 December, 2023, Manuscript No. JPRA-23-121089 (R);
Published date: 25 December, 2023, 10.4172/JPRA.1000047.
Citation: Rufer A (2023) Towards a Decarbonized Individual Mobility-Challenges and Solutions. J Phys Res Appl 7:4.
Abstract
Internal Combustion Engine (ICE) vehicles contribute significantly to the global warming through their immense quantity of CO2 emissions and are on the way to be replaced by zero emission alternative solutions. Several replacement techniques with scientifically sound performances are proposed for the propulsion equipment including the related supply chains from renewable sources, but they often cannot fulfill the huge demand quantitatively. The paper discusses the quantitative aspects of the real demand with the example of the actual automotive park in Switzerland and analyses different alternatives like conventional EV’s, fuel-cell vehicles or energetic chains based on sustainable fuels like e-methanol or synthetic solar fuels. The analysis comprises energy efficiency considerations.
Keywords: Decarbonization; Automotive vehicles; Supply
chains; Energy efficiency; Quantitative analysis.
Introduction
In the context of climate change and global warming, humanity has today recognized that its greenhouse gas emissions must be urgently and drastically reduced. CO2 is one of the most important components being significantly produced by the transportation system worldwide. Personal transportation by cars is today considered an important element for the reduction or cancellation of a significant part of all CO2 emissions.
In addition to the well-known contribution of Electrical Vehicles (EVs), whose most important disadvantages are the limited autonomy and the poor capacity to be rapidly recharged, other alternatives can be seen in the recently proposed Fuel-Cell Vehicles (FCVs) supplied by hydrogen pressurized in a specific reservoir [1,2]. These vehicles have the advantage of their rapid refuelling capacity, and the production of hydrogen is currently receiving innovative approaches [3-5]. However, FCVs must be placed in the category of “low efficiency chain” vehicles. The supply chain consists of a water electrolysis system followed by a pressurization step, and then a vehicle’s internal fuel cell supplying the electric propulsion train. Such a chain represents a cascade of successive transformations with individual low efficiency, leading to a severely debatable result.
Another way of reducing CO2 emissions can be found in using alternative renewable fuels for conventional vehicles moved by Internal Combustion Engines (ICEs). Such solutions include most often so-called biofuels or biogases, with the added advantage of maintaining a nearly unchanged infrastructure in the vehicles and for distribution of the carburant [6]. Similarly, a propulsion system for cars based on sustainable methanol or green methanol (e-methanol) has been proposed [7-9]. This e-methanol system is based on hydrogen and CO2 combination, where hydrogen is produced by water electrolysis powered by photovoltaic electricity, and CO2 is captured from the ambient air. Compared to conventional fuels, renewable methanol reduces carbon dioxide emissions by up to 95%, reduces Nitrogen Oxide (NO) emissions by up to 80%, and completely eliminate Sulphur Oxide (SO) emissions and emissions of particulate matter. However, in addition to these advantages, the use of ICEs for vehicle propulsion has the disadvantage of presenting very low energy efficiency between the tank and the wheels.
The present paper evaluates the actual demand of conventional fuel for a representative automotive park and evaluates the corresponding needed quantities for alternative solutions which are further presented and analyzed from the point of view of their global efficiency, also from the point of view of the needed infrastructure for a powering from sustainable sources.
Materials and Methods
Quantities and efficiencies
Thermal and electric propulsion techniques: The evolution of automotive vehicles for the reduction of emissions is in many cases linked to the elimination of the ICE engine and its replacement by an electric propulsion chain. For comparison and design purposes of the alternative propulsion and supply system an evaluation of the demand starts with a calculation of the mechanical energy transmitted to the wheels from typical fuel consumption. An example of a consumption of 8l/100 km is chosen for the evaluation. This value represents a mass consumption of 6.64 kg/100 km and corresponds to an energy amount of 282 MJ/100 km when the fuel energy density is equal to 42.5 MJ/ kg. When the tank-to-wheel efficiency of the ICE vehicle is of 15% according to the values given in Table 1, the energy consumption at the level of the wheels becomes 43.5 MJ/100 km or 11.75 kWh/100 km [10].
| Efficiency of the propulsion system | |||
|---|---|---|---|
| ICE Propulsion | Electric Vehicle | ||
| Fuel in Tank-Gasoline | 100% | Battery El energy | 100% |
| Losses due to heat | 62% | Losses El. Motor and converter (90% and 95%) | 14% |
| Standby-Idle losses | 17% | Standby-Idle losses | 8% |
| Driveline losses | 6% | Driveline and auxil. | 6% |
| Tank-to-wheel efficiency | 15% | Battery-to-wheel efficiency | 72% |
Table 1: Comparison of the efficiencies of the propulsion systems.
In Table 1 a comparison is made between an ICE propulsed vehicle and a classical EV. The table shows the different losses of the systems, beginning from the full capacity of the reservoir, respectively from the battery. The losses of the motorization are given, the losses related to standby-idle mode as well as the losses related to the driveline. The resultant efficiencies are respectively 15% for the ICE and 72% for the electric propulsion.
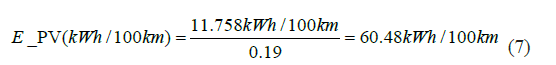
In Figure 1, a schematic representation of the compared systems is given. Near the efficiencies of the propulsion systems, the efficiency of the charging infrastructure is indicated, in order to calculate a comparable (electric) energy demand of the EV. This demand is then calculated with an inverse principle from the previously calculated energy demand at the level of the wheels. The energy demand at the interconnection point of the charger becomes

Figure 1: Comparison of the system structures of ICE and EV.

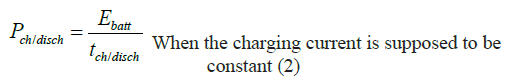
In Figure 1, the efficiency of the charge and discharge of the battery is not represented but is supposed to be included in the efficiencies of the charging infrastructure on one side and of the propulsion chain on the other side. In reality the battery shows variable losses, mainly depending on the charging power, respectively on the discharging one [11]. The charging /discharging power is a 1/x function of the charging/discharging time for a given battery capacity, namely:
The charging/discharging power further depends on the internal resistance of the battery elements as represented in Figure 2. The different curves in the figure correspond to different values of the series resistance of the battery. The energy capacity of the battery used for this representation is of 25 kWh. The necessary high power needed for a short charging time causes strong internal losses inside of the battery that must be specifically cooled to avoid unacceptable rise of the temperature. The internal losses of the battery have a direct consequence on the energy efficiency of the charging/discharging process. The different efficiency curves corresponding again to different values of the internal resistance of the battery elements are represented in Figure 3 in function of the charging/discharging time.

Figure 2: Power level of the charging/discharging of a battery. 


Figure 3: Energy efficiency of the charging/discharging process. 

The important internal losses of a battery have to be covered by an increased installed electricity production infrastructure and finally contribute to higher CO2 emissions when the generation means use fossil resources. Regarding renewable sources, fast charging not only requires a higher installed power but requires an increase in the energy produced and is ultimately responsible for unnecessary costs.
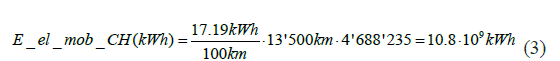
Example: Annual quantity and equivalent production facility for the Swiss automotive park: In Figure 1 the electric supply is represented by a conventional power station. In this study, the additional power needed for a hypothetic 100% conversion of the automotive park in Switzerland will be first calculated. Knowing that the actual number of vehicles in that country is equal to 4’688’000 units and that an average of 13’500 km is covered yearly per car, the yearly electric energy to be produced in addition to the actual electric production becomes:
Considering that the actual energy demand in Switzerland is of 59.9 TWh, the full conversion to an electric mobility connected to the grid would need an increase of 18 percent of the production infrastructure. One important question is in what form the installed capacity should be expanded with a scenario compatible with a decarbonized mobility. The actual share of the electricity market in Switzerland is characterized by 80% of renewable sources (68% of hydraulic power, 11% for the PV, wind, small hydraulic and biomass). The nuclear energy has a contribution of 19% and the remaining 2% come from waste and fossil resources. Certainly the Swiss example is an exception in comparison with other countries, but the example of France is also unusual with its 62.6% of nuclear power which is considered as a CO2 free resource. The significant quantity of additional electrical energy of 10.8 TWh for electric mobility raises the question of the validity of a societal-political choice to simultaneously abandon fossil fuels and nuclear energy.
Decarbonized solutions
Electric vehicle powered by photovoltaic sources: In the example of the EV shown in the lower part of Figure 1, the conventional power station could be replaced by an equivalent photovoltaic plant as represented in Figure 2. As an alternative to the 18% increase of the electric power station production indicated in the previous section, the amount of 10.8 TWh could be installed as an equivalent large PV plant. A political decision of the Swiss Federal Council has initiated in Switzerland the so-called “Solar Express” initiative, where alpine places in altitude should be equipped with large solar PV facilities, encouraging especially the winter production. Alternative PV solutions can be easier installed on roofs and façades of buildings but do not benefit from the lower temperature conditions as in altitude and suffer from winter fog situations. The next section is a tentative design of an equivalent PV plant to show the dimensions of such a dedicated infrastructure [12].
Footprint of the renewable power source: The dimensions of the equivalent photovoltaic infrastructure as represented in Figure 4 are calculated. For this evaluation, the yearly earnings of an existing reference plant are considered, namely the Agua Caliente photovoltaic plant in Arizona [13]. In order to have a physical representation of the needed footprint area, a geographic illustration with the lake of Geneva as reference is chosen. This example is related to Switzerland but can be easily extrapolated to other countries. For example, Germany has around ten times the number of vehicles, and the surface would be adapted proportionally.

Figure 4: EV supplied from a renewable source.
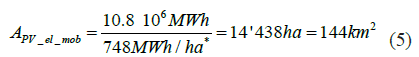
The specific yearly production of a PV plant is calculated from the earnings of the Agua Caliente plant for one year divided by the ground surface of the facility, namely:

This value can be compared to another reference as has been evaluated for one of the future Solar Express facilities, the Grengiol plant as 1100 MWh/ha per year [14].
Then, an idealized surface for the annual quantity needed for the converted Swiss park is:
This surface corresponds to approximately one quarter of the surface of the lake of Geneva. Figure 5 shows the needed surface as a square of 12 km edge superposed on the lake of Geneva for comparison.

Figure 5: Comparative surface of the PV plant for a 100% electrification (CH).
Regarding the power to be installed, the calculation is again referred to the Agua Caliente plant which has a nameplate power of 290 MW. Thus, the power to be installed for the 10.8*106 MWh production becomes:
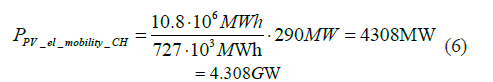
This value is just an evaluation, and a real design would have to take into account the geographic and climatic conditions of the place where the infrastructure will be installed.
Further considerations must address the aspect of intermittency and meteorological and seasonal conditions. The constancy and variability of the already installed production facilities as well as the presence of large storage installations is another aspect to be considered.
Fuel-cell vehicle powered by green hydrogen: A second solution for a decarbonized mobility is given by fuel-cell powered and electrically driven vehicles. In such systems the propulsion unit is a conventional electric motor chain. The electric power is provided by a fuel-cell where an electrochemical transformation combines on one side gaseous Hydrogen stored in a high-pressure reservoir and on the other side Oxygen taken from the ambient air. For being considered as a fully CO2-free solution these vehicles must be fuelled with green Hydrogen that means Hydrogen produced by electrolysis of water. The electric supply of the electrolyser is expected to be provided by a renewable source like photovoltaic panels. In Figure 6 the main components of a fuel-cell based vehicle system is represented together with its supply chain comprising the water electrolyser, the photovoltaic power supply and the Hydrogen compression stage. In the same representation the efficiency of the different components is noted. The electric propulsion train has an efficiency of 72% as was mentioned previously, the fuel-cell converter is indicated with 50% efficiency, the high-pressure storage is supposed to have 90% efficiency and the electrolyser with 60%. The resulting efficiency of the complete chain from the PV panels to the wheels has then a value of only 19%. This poor value is the main problem of the FC vehicles. In a more general context the cascade of an electrolyser, a compression stage and a fuel-cell appears several times in the energy sector as for example for hydrogen based storage facilities. In fact, this solution is often argumented as one of the possibilities for long term energy storage for summer-to-winter shift, when in the summertime production surpluses cannot be used otherwise. In such conditions the question of the efficiency plays only a second role.

Figure 6: Fuel-cell powered vehicle with Hydrogen production.
Yearly demand of electric energy for the fuel-cell vehicles: In a similar way as for the pure electric vehicle, the specific energy demand is calculated with the low value of the system efficiency.
With the same distance covered per year of 13’500 km, the Swiss automotive vehicle park would consume:

= 38.2.TWh This value corresponds to an increase of the global electricity production in Switzerland of 68%.
A different way to estimate the hydrogen powered vehicle efficiency is to analyze the performances claimed by an actual manufacturer. In the example of the BMWiX5, the hydrogen needed to power the fuel cell is stored in a pair of 700-bar reservoirs made from Carbon-Fibre-Reinforced Plastic (CFRP). Together, these tanks can hold around six kilograms of hydrogen. This storage capacity gives the car a range of 504 km (313 miles) in the WLTP cycle.
The energy consumption per 100 km becomes:

This is a similar value as calculated previously from Figure 6 and with the consumption at the level of the wheels of 11.75 kWh/100 km:

The difference can be associated to the heavier weight of the BMW car, or to the auxiliary devices as air-conditioning which was not considered in the previous calculations.
Footprint of the PV plant for the Hydrogen production: With the same value of 748 MWh/ha for the yearly earnings of the PV plant, the surface needed for a conversion of the Swiss park to FC vehicles becomes:

Or 88% of the surface of the lake of Geneva (Figure 7). The equivalent square surface would be of 22.6 km edge.

Figure 7: Footprint of the PV plant for the supply of FC vehicles.
ICE vehicles powered by e-Methanol
System structure and efficiency: Another solution for a decarbonized mobility is given by the synthesis of green Methanol or e-Methanol. The e-methanol system is based on the combination of hydrogen and CO2 in a specific reactor, and where hydrogen is produced by water electrolysis powered by photovoltaic electricity, and CO2 is captured from the ambient air. Figure 8 gives a schematic representation of the e-methanol powered vehicle system and will be the base for the calculation of an equivalent efficiency and to evaluate the needed production infrastructure in terms of electricity demand and further the needed footprint of the photovoltaic infrastructure. Figure 8 shows also a dedicated pump and desalination equipment when salt water is used [9].

Figure 8: ICE vehicle powered by e-Methanol.
Tremendous values are characterizing a first demonstration plant in Patagonia and have been calculated in [15]. For a production of 500000 tons of e-Methanol, a mass of 93000 tons of Hydrogen must be produced, as 687000 tons of CO2 must be captured from the ambient air. Here the main difficulty comes from the low CO2 concentration in the ambient air of 414 ppm. The necessary amount of water for the electrolyser is equal to 843000 tons. This amount is composed of 280000 tons produced internally from the hydrogenation process and an additional mass of 562000 tons of desalinized sea water.
Near the difficulties to be industrially produced, Methanol has certain advantages to be used for the fuelling of vehicles. The liquid form of the fuel allows a similar short refuelling time as for conventional gasoline vehicles, its transport and distribution does need only small modifications as also for the vehicle’s on-board equipment. The fuel consumption of ICE vehicles powered by e-methanol is not much higher than the consumption of classical ones.
In the system represented in Figure 8, the partial efficiencies are represented, namely the already mentioned efficiency of the ICE propulsion system (15%) and the efficiency of the e-methanol synthesis (0.51). This value is an approximation and includes the efficiency of the water electrolysis for the production of Hydrogen and the power needed for the direct air caption. The cascade of the e-methanol synthesis and the use of this fuel in an ICE vehicle lead to the poor value of 7.7%. For comparison, the global efficiency of the electric vehicle directly fed from a photovoltaic installation has been calculated in section 2 (68%). On the base of these two values, it is evident that the PV power should be preferably used for the charge of the EV battery, even if the methanol solution presents the advantage of a much shorter refuelling time.
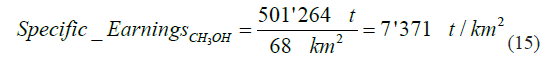
Footprint of the PV for e-Methanol production: In reference, the footprint of an e-Methanol production facility of 500’00 tons of fuel has been evaluated when the electric power is produced by a photovoltaic plant. The needed surface is 68 km² [15].
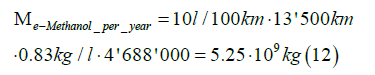
The methanol consumption in an ICE is estimated to 10l/100 km, the yearly methanol production for the Swiss automotive park becomes:
With the value of 68 kmZ² needed for the 500’00 tons of Methanol, the Swiss demand would be:
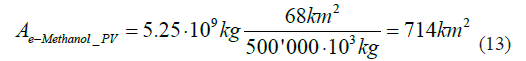
The equivalent square surface of the PV plant with an edge of 26.7 km is represented in Figure 9.

Figure 9: Footprint of the PV plant for the supply of the e-Methanol vehicles.
Solar fuels
The solar reactor: In a publication of November 2021 in the Journal “Nature” Aldo Steinfels from ETH Zurich has described a kind of synthetic photosynthesis where carbon dioxide and water, both captured from the ambient air were passed through a cerium oxide catalyst heated using a solar concentrator. The output product being a mixture of hydrogen and carbon monoxide, then transformed using the Fisher-Tropsch process into complex hydrocarbons for example methanol, a liquid fuel [16].
Figure 10 gives a schematic representation of the solar reactor comprising a mirror array for the concentration of the sun radiation, the thermochemical reactor placed on the top of a tower producing the syngas composed of H2 and CO. The system is shown with a simplified output stage where as well Kerosene or Methanol can be produced.

Figure 10: Solar reactor for synthetic fuel.
As indicated in Figure 11, the solar high temperature thermochemical reactor is divided into a two-step reaction. The first step corresponds to a solar reduction of a metal oxide producing that reduced base and excess Oxygen, the second step is a double oxidation, where a part of the reduced metal is transformed by water and producing Hydrogen, and the remaining part by carbon dioxide producing CO. The metal oxide is recycled to the first reaction of the solar reduction (Figure 11).

Figure 11: The 2 step thermochemical reactions for the syngas production.
Quantitative evaluation and footprint
“Scaling up could produce the 414 billion L (414 million m³ of jet fuel used in 2019 with an area of 45,000 km² (17,000 sq mi): 0.5% of the Sahara Desert” said Philipp Furler from Synhelion, which built a production unit for this fuel in Jülich, west of Cologne, in 2022, before another larger plant in Spain. The Swiss Airlines, a member of the Lufthansa group, is due to become its first customer in 2023.
An area specific calculation is done with the indicated values, namely:
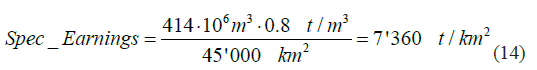
This value corresponds to a similar performance as with the case of the e-Methanol production where:
Consequently, the footprint for a syngas production plant would be similar to that represented in Figure 9.
Ambitious research
Following the example of the solar reactor for the production of synthetic fuels which was described in the previous section, several researches are on-going or are on the way to be developed for an industrial application.
Direct Solar-to Fuel energy conversion: For more than a decade physical chemistry research has shown ways to photo electrochemical and photo catalytic water splitting for the production of Hydrogen [17]. As an example, an organic semiconductor Photo electrochemical tandem cell for solar water splitting has been described in [18]. Demonstration cells with interesting properties have been realized and have been described as a kind of artificial leave, capturing as well as water as carbon dioxide from the ambient air. Larger cells with high performances must however be developed for an industrial application. The difficulties of realizing facilities at an industrial level are linked to quantitative aspects, namely the demand of 9 kg H2O for the production of 1 kg of H2, and a related mass of 225 kg (187 m³ vol.) of air to be processed when the water content in the air is of 4%.
Solar redox flow batteries: A flow battery, or redox flow battery, is a type of electrochemical cell where chemical energy is provided by two chemical components dissolved in liquids and which are pumped through the accumulator on either side of a membrane separator allowing the transfer of ions inside the cell when an electric current flows through an external circuit.
Flow batteries have the interesting property that the power capability and the energy capacity can be designed separately. The surface of the electrodes being defining the power of the battery and the volumes of the chemical liquid components defining the energy capacity [19].
Solar Redox Flow Batteries (SRFBs) are emerging technologies that can integrate solar energy conversion, storage, and discharge in a single device [20]. Such a solution could be used as a charging station for EV’s and directly powered with solar irradiation. The power capability and the resultant efficiency must be evaluated when the electric power is transferred from the SRBF to the battery of the vehicle. The main advantage of such a solution would be that energy storage is directly integrated in the production means, allowing for example accumulation during the day and recharging EV’s during the night. This emerging technology must be developed at a high power level for a future industrialization.
Results and Discussion
The paper has shown first the large difference between ICE propulsion and an electric one from the point of view of their efficiencies. In regards to a future decarbonized individual transportation, several solutions fulfilling the expectation of nearly zero emissions are considered with sound scientific and technical criteria. However, the quantitative considerations in terms of a possible implementation address the question of the needed footprints of the equipment’s and of the availability of the needed materials and components. An evaluation of the needed infrastructure for a 100% conversion of the automotive park in Switzerland has been given as an example and sets in evidence the real high number of vehicles and the difficulty to realize an adapted infrastructure.
An evolution of the share of solutions for individual mobility is highly difficult to predict, but finite resources and the difficulty to realize zero carbon systems will indisputably lead to a shrinking of the total number of vehicles worldwide as is tentatively represented in the diagram of Figure 12.

Figure 12: A vision of the evolution of the share of solutions for the individual mobility.
The decrease of the surfaces in the diagrams in Figure 12 can be associated to the decrease of the amounts of fuels consumed by the automotive park and means a global reduction of the demand. For short or mid-term, stabilization or eventually a decreasing of the global consumption can limit or reduce the greenhouse gas emissions even if alternative solutions cannot be introduced rapidly. In the context of the urgency of limiting CO2 emissions, rapid measures can be introduced as limiting the vehicle speed on highways (for example 90 km/hour instead of 120 actually in force), and on other interconnection roads (70 km/h instead of 80). Speed limitations could introduce instantaneously a significant reduction of around 15%. Other less popular measures like suppressing the vehicles of the upper categories of the energy labels or more generally limiting the number of new registrations could also reduce the emissions.
The last diagram on the right side of the figure indicates a long-term scenario where several alternative solutions are shown simultaneously, beneath a remaining part of fossil fuel [21].
Conclusion
In the evaluations of the impacts of the different mobility systems in this document, an assumption has been made on the number of kilometres driven yearly by each vehicle. This parameter has not been discussed before but represents a large potential for a reduction of the CO2 emissions of the individual mobility. The average kilometre covered by the personal vehicles is strongly linked with the housing styles, ranging from individual houses in the countryside to grouped housing or housing in rental or private buildings in urban areas. This reflection automatically leads to the notion of housing densification where public transport systems and soft mobility become more current. New urbanistic concepts appear today at the forefront, with even very extreme examples such as the proposed Neom-The Line project in Saudi Arabia. The 160 km long building with its 200 m width and 500 m height proposes to house up to 9 million people for an emission free living but has today an evident character of utopia [21]. An accelerated implementation of low carbon solutions is desirable and should be proposed by responsible politicians.
Funding
This research received no external funding.
Conflicts of Interest
The author declares no conflict of interest.
References
- Sun T, Chen G, Lan H, Guo J, Wang X, et al (2021) Experimental study on fuel economy of fuel cell truck under different driving cycle. ACEEE 38-43.
- Ahn BK, Lim TW (2006) Fuel cell vehicle development at Hyundai-Kia Motors. IFOST 199-201.
- Karatza D, Konstantopoulos C, Chianese S, Diplas S, Svec P, et al (2021) Hydrogen production through water splitting at low temperature over Fe3O4 pellet: Effects of electric power, magnetic field, and temperature. Fuel ProcessTechnol 211:106606.
- Singh T, Alhazmi A, Mohammad A, Srivastava N, Haque S, et al (2021) Integrated biohydrogen production via lignocellulosic waste: Opportunity, challenges & future prospects. Bioresour Technol 338:125511.
- Akca MS, Bostancı O, Aydin AK, Koyuncu I, Altinbas M (2021) BioH2 production from food waste by anaerobic membrane bioreactor. Int J Hydrogen Energy 46(55):27941-55.
- Elbehri A, Segerstedt A, Liu P (2013) Biofuels and the sustainability challenge: A global assessment of sustainability issues, trends and policies for biofuels and related feedstocks. FAO
- Hauri S (2022) Que faire du CO2 déjà émis. Rev Automob Nr 16-17.
- Meca VL, d’Amore-Domenech R, Crucelaegui A, Leo TJ (2022) Large-scale maritime transport of hydrogen: Economic comparison of liquid hydrogen and methanol. ACS Sustain Chem Eng 10(13):4300-11.
- MAN Energy Solutions to supply methanol reactor for Porsche AG eFuels pilot plant in Chile (2021) Press Release Augsburg.
- Serpa D (2011) Tank-to-wheel efficiency.
- Rufer A (2018) Energy storage-systems and components. 1st edn, CRC Press ISBN
- Zünd Marianne (2023) Le Conseil fédéral met en vigueur des modifications d’ordonnances pour la promotion de l’énergie solaire.
- Agua Caliente Solar Project. (2014)
- Centrale photovoltaïque Grengiols. (2022)
- Rufer A (2022) Quantitative Design of a New e-Methanol Production Process. Energies 15(24):9309.
- Zoller S, Koepf E, Nizamian D, Stephan M, Patané A, et al (2022) A solar tower fuel plant for the thermochemical production of kerosene from H2O and CO2 Joule6(7):1606-16.
- Sivula K (2015) Toward economically feasible direct solar-to-fuel energy conversion. J Phys Chem Lett 6(6):975-6.
- Caretti M, Mensi E, Kessler RA, Lazouni L, Goldman B, et al (2023) Transparent Porous Conductive Substrates for Gas‐Phase Photoelectrochemical Hydrogen Production. Adv Mater 35(9):2208740.
- Blanc C (2009) Modeling of a vanadium redox flow battery electricity storage system.
- Cao L, Skyllas-Kazacos M, Wang DW (2018) Solar redox flow batteries: mechanism, design, and measurement. Adv Sustain Syst 2(8-9):1800031.
- ET N, Urbain UF (2023) Neom and the line (saudi arabia) futuristic utopia or urban nightmare?. 87(1): 139 à 161.