Research Article, Int J Cardiovasc Res Vol: 9 Issue: 3
Trends in Hospitalization Rates for A First Myocardial Infarction In New Jersey 2000-2014
Ehab E Tuppo1*, Mihir P Trivedi2, Julian Daevmer2, Javier Cabrera1, John B Kostis1 and William J Kostis1
1Cardiovascular Institute of New Jersey, Rutgers, The State University of New Jersey, USA
2Rutgers, The State University of New Jersey, USA
*Corresponding Author: Dr. Ehab E. Tuppo
Cardiovascular Institute of New Jersey, Rutgers, The State University of New Jersey, New Brunswick, New Jersey
Tel: (201) 407-8615
E-mail: etuppo@hotmail.com
Received: April 24, 2020 Accepted: May 22, 2020 Published: May 29, 2020
Citation: Tuppo EE, Trivedi MP, Daevmer J, Cabrera J, Kostis JB, et al. (2020) Trends in Hospitalization Rates for A First Myocardial Infarction In New Jersey 2000-2014. Int J Cardiovasc Res 9:3. doi: 10.37532/icrj.2020.9(3).401
Abstract
There has been a remarkable decline in the incidence of myocardial infarction (MI) for the past several decades. However, scant data are available on whether this decline has increased, diminished, or remained stable in recent years. Using the Myocardial Infarction Data Acquisition System (MIDAS), a statewide database of all cardiovascular hospital admissions in New Jersey, we identified 168,966 patients with a primary diagnosis of MI. We examined time trends in incidence from the year 2000 to the year 2014. A steep decline in MI incidence was observed in all age groups with an overall decline of 30.2% over the period. The decline was seen in all age groups but was most pronounced in the 80-84 age group. Hispanics had the greatest decline followed by whites and finally blacks. Males had a greater decline than females. The decline was seen to level off after 2008. This remarkable pattern of incidence decline may be related to the increase in use of interventional and pharmacological therapies that plateaued after 2008. In conclusion, this study shows a decline in MI incidence that leveled off after 2008.
Keywords: Myocardial infarction; Incidence; Epidemiology
Introduction
Although the incidence of a Myocardial Infarction (MI) has declined in recent years [1-6], MI remains an important cause of morbidity and death with an American having an MI nearly every 40 seconds.
The annual incidence of new MIs was 605,000 in 2018 with 200,000 recurrent attacks and about 14% of persons who have an MI will die from it [7]. The age-adjusted hospitalization rate for MI in the US was 215 per 100,000 persons from the years 1979 to 1981, increased to 342 in the years 1985 to 1987, stabilized for the next decade, and declined thereafter 1996 to 242 per 100,000 during the period from 2003 to 2005 [8]. Data from the Cardiovascular Research Network for the period of 2000 to 2008 showed a decline in incidence from 230.5 to 168.6 per 100,000 person-years corresponding to an annual decline of 3.8% [9]. Krumholz and associates reported that the rates of hospitalization for MI had declined significantly across all age, sex and race groups, from 1283 to 801 per 100,000 person-years, between the years of 1999 and 2011 for an adjusted annual decline of 4.6% [10]. An analysis of the Atherosclerosis Risk In Communities (ARIC) data showed that in addition to the lower incidence, the severity of incident hospitalized MI had declined over a 16-year period from 1987 to 2002 [11]. The authors speculated that this decline in severity might have contributed to the decrease in the Coronary Heart Disease (CHD) death rates. However, as most of these reports indicate scant data are available on whether this decline in MI incidence in the general population has increased, diminished, or remained stable in recent years.
The purpose of this study was to examine the trends of first MI hospitalizations in the years of 2000-2014 in New Jersey, overall and separately in the different gender, race/ethnicity and age groups.
Methods
The present study uses data from the Myocardial Infarction Data Acquisition System (MIDAS) dataset from 2000 to 2014. MIDAS is a database of all hospitalizations for cardiovascular diseases in New Jersey (we did not access all available info) since the late 1980s. It includes all records with a primary diagnosis of MI (International classification of Diseases, Ninth Revision (ICD-9) codes 410.0 to 410.9), Ischemic Heart Disease (ICD-9 410-414), Congestive Heart Failure (ICD-9 428), cerebrovascular disease (ICD-9 430- 438) and diseases of arteries, arterioles, and capillaries (ICD-9 440- 449). MIDAS includes data on New Jersey residents that may have died in the US out of state. The database also contains basic sociodemographic clinical data on cardiovascular diseases and other coexisting conditions such as invasive cardiac procedures performed on inpatients. Data on deaths are obtained from the New Jersey death registration files and linked to the MIDAS records using automated record linkage software [12]. Persons younger than 40 or older than 84 years of age were excluded from this analysis because of small sample size. The diagnosis of acute MI in hospitalized patients has been validated previously using a random sample of medical charts of MI hospitalizations in New Jersey [13,14].
Data was age, sex and race adjusted to the 2010 Census limited to those aged 40 to 84. The gender outcomes were adjusted for age. This study focuses on trends of MI incidence. Statistical analysis was performed using R software [15]. Subjects having their first MI documented in MIDAS including primary or secondary diagnosis for admission or dying of CHD (ICD-9 codes 410-11, 413-14) without a prior MI in MIDAS were considered incident MI cases. Subjects with a previous diagnosis of MI (ICD-9 code 410) within the previous 10 years of the incident case in the MIDAS database were considered to have had a recurrent MI.
The study was approved by the Rutgers New Brunswick/ Piscataway Institutional Review Board. MIDAS was approved by the Rutgers New Brunswick/Piscataway Institutional Review Board and by the New Jersey Department of Health Institutional Review Board.
Results
Characteristics
A total of 168,966 MI subjects were discharged from New Jersey hospitals between the years of 2000 and 2014. Males made up 61.6% of the study population and whites made up 71.4%. Persons 65 years of age or older accounted 54.7% of the study population with the 80-84 age group making up the largest single age segment at 14.7% (Table 1).
| Year | 2000 | 2001 | 2002 | 2003 | 2004 | 2005 | 2006 | 2007 | 2008 | 2009 | 2010 | 2011 | 2012 | 2013 | 2014 | 15Yr Total | %of Total |
|---|---|---|---|---|---|---|---|---|---|---|---|---|---|---|---|---|---|
| Total | 13108 | 12782 | 13089 | 12459 | 11681 | 10980 | 10703 | 10211 | 10531 | 10302 | 10467 | 10368 | 10805 | 10581 | 10899 | 168966 | 100.00% |
| Male | 7991 | 7715 | 7946 | 7546 | 7017 | 6676 | 6520 | 6306 | 6468 | 6497 | 6518 | 6593 | 6706 | 6731 | 6843 | 104073 | 61.60% |
| Female | 5117 | 5067 | 5143 | 4913 | 4664 | 4304 | 4183 | 3905 | 4063 | 3805 | 3949 | 3775 | 4099 | 3850 | 4056 | 64893 | 38.40% |
| White | 10052 | 9589 | 9237 | 8644 | 8176 | 8116 | 7929 | 7261 | 7483 | 7319 | 7425 | 7216 | 7453 | 7300 | 7393 | 120593 | 71.40% |
| Black | 1125 | 1122 | 1081 | 1067 | 983 | 1060 | 1047 | 1076 | 1129 | 1172 | 1207 | 1250 | 1380 | 1239 | 1326 | 17264 | 10.20% |
| Hispanic | 851 | 1100 | 1336 | 1029 | 994 | 922 | 825 | 892 | 850 | 860 | 950 | 974 | 939 | 953 | 999 | 14474 | 8.60% |
| Other | 1080 | 971 | 1426 | 1714 | 1524 | 882 | 902 | 969 | 1069 | 951 | 885 | 928 | 1033 | 1089 | 1181 | 16604 | 9.80% |
| 40-44 | 486 | 492 | 515 | 503 | 483 | 458 | 448 | 404 | 393 | 435 | 432 | 386 | 415 | 414 | 403 | 6667 | 4.00% |
| 45-49 | 775 | 793 | 870 | 856 | 821 | 767 | 784 | 762 | 799 | 772 | 776 | 773 | 747 | 744 | 733 | 11772 | 7.00% |
| 50-54 | 1185 | 1122 | 1185 | 1152 | 1087 | 993 | 1088 | 1035 | 1078 | 1106 | 1074 | 1113 | 1137 | 1136 | 1202 | 16693 | 9.90% |
| 55-59 | 1364 | 1357 | 1507 | 1413 | 1331 | 1293 | 1294 | 1265 | 1228 | 1274 | 1348 | 1283 | 1416 | 1378 | 1429 | 20180 | 11.90% |
| 60-64 | 1442 | 1403 | 1450 | 1457 | 1380 | 1273 | 1348 | 1283 | 1354 | 1357 | 1400 | 1497 | 1504 | 1524 | 1503 | 21175 | 12.50% |
| 65-69 | 1629 | 1545 | 1641 | 1446 | 1361 | 1285 | 1222 | 1197 | 1310 | 1264 | 1346 | 1342 | 1506 | 1500 | 1546 | 21140 | 12.50% |
| 70-74 | 1981 | 1890 | 1862 | 1712 | 1546 | 1448 | 1319 | 1272 | 1261 | 1249 | 1211 | 1235 | 1305 | 1355 | 1436 | 22082 | 13.10% |
| 75-79 | 2228 | 2195 | 2056 | 1964 | 1835 | 1669 | 1640 | 1472 | 1501 | 1377 | 1357 | 1293 | 1271 | 1244 | 1322 | 24424 | 14.50% |
| 80-84 | 2018 | 1985 | 2003 | 1956 | 1837 | 1794 | 1560 | 1521 | 1607 | 1468 | 1523 | 1446 | 1504 | 1286 | 1325 | 24833 | 14.70% |
Table 1: First MI incidence in total, by sex, race/ethnicity and 5-year age group. New Jersey 2000-2014.
Changes in incidence
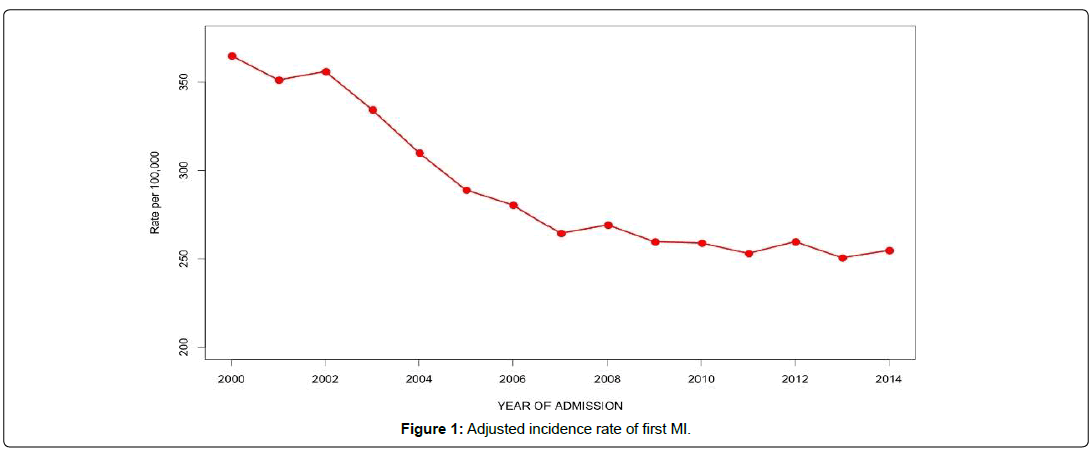
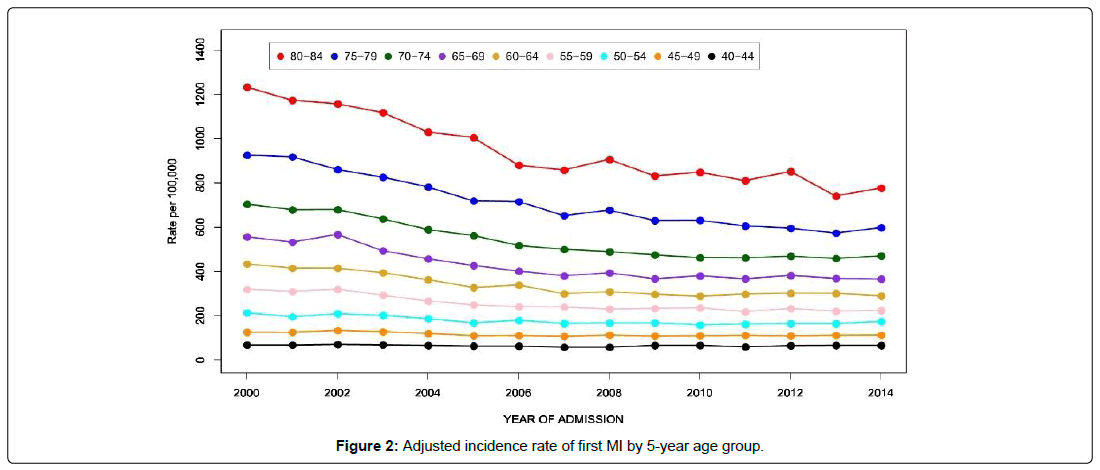
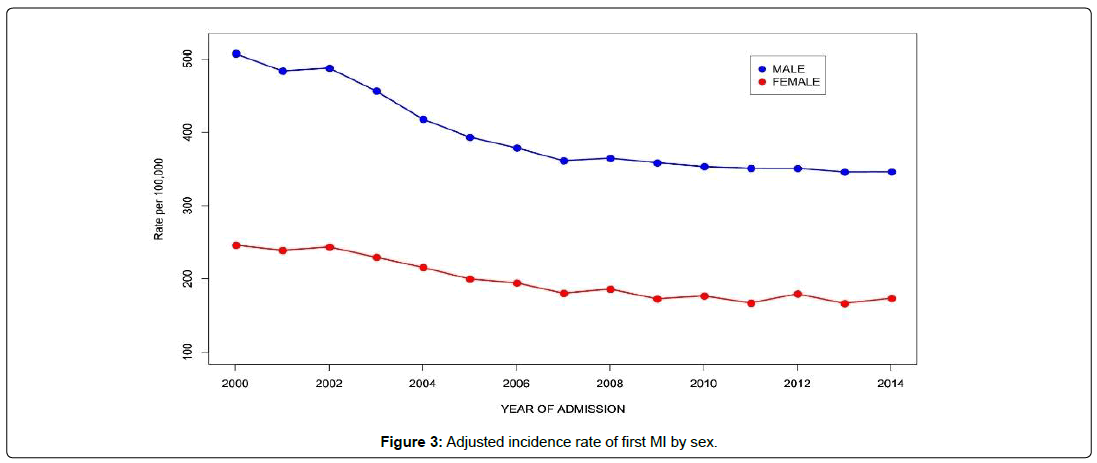
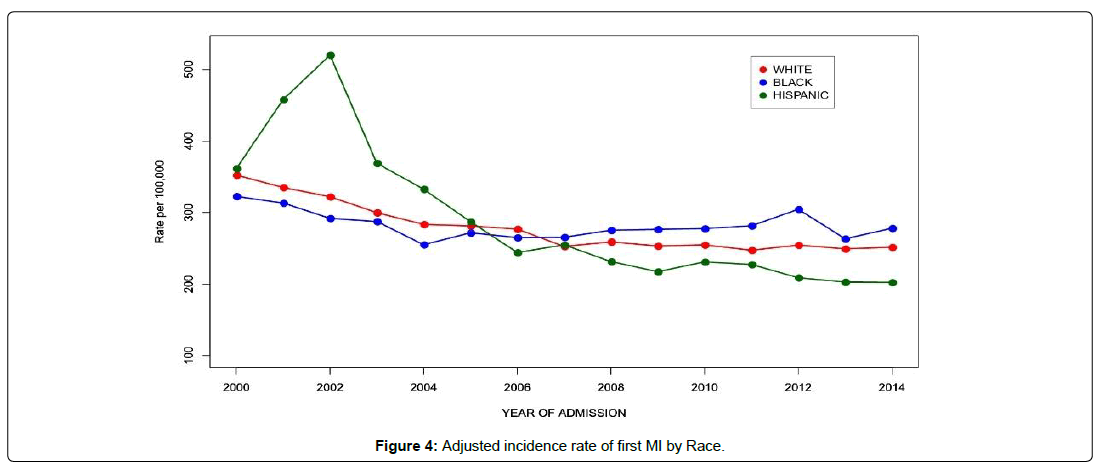
As shown in Table 2 the adjusted incidence rate of first MI by gender, race/ethnicity and 5-year age group. There was an overall decline of 30.2% in the incidence rate of first MIs from the year 2000 to 2014 (Figure 1). A steeper decline in MI incidence was observed in the older age groups and was most dramatic at ages 80-84, where the incidence rate decreased from 1233 per 100,000 in 2000 to 778 per 100,000 in 2014, a 36.9% decline (Figure 2). This was followed by the 75-79 age group, where the incidence rate dropped from 926 per 100,000 in 2000 to 599 per 100,000 in 2014 for a decline of 35.4%. The percent decline became progressively smaller with decreasing age so that at 40-44 it was only 3.1%, from 69 to 66 per 100,000. In the age groups older than 44, the decline occurred mainly between the years 2000 and 2008 showing an average yearly decline of 3.3% but after 2009 the rate of decline dropped to less than 0.4% per year. Males and females had similar patterns of decline in MI incidence, but females started with much lower rates and declined somewhat less, so that the male excess incidence narrowed modestly over the 15 years (Figure 3). The decline in whites at 28.6% was than in blacks (13.9%) so that the black-white disparity expanded over the study period (Figure 4). Hispanics had the biggest improvement with a decline in MI incidence of 44.0%, though inaccuracies or changes in the way ethnicity was coded on hospital admission or in the underlying population estimates are possible.
| Year | Total | Male | Female | White | Black | Hispanic | 40-44 | 45-49 | 50-54 | 55-59 | 60-64 | 65-69 | 70-74 | 75-79 | 80-84 |
|---|---|---|---|---|---|---|---|---|---|---|---|---|---|---|---|
| 2000 | 364.9 | 507.2 | 246.1 | 352.2 | 322.7 | 361.4 | 68.5 | 126.1 | 214.2 | 319.8 | 434.3 | 557.2 | 704.3 | 925.9 | 1233 |
| 2001 | 351.3 | 483.9 | 238.9 | 335 | 313.3 | 458 | 68.2 | 125.7 | 195.9 | 309.9 | 415 | 533.1 | 678.8 | 918.1 | 1173.5 |
| 2002 | 356.1 | 487.8 | 243.6 | 322.1 | 291.8 | 520.1 | 70.9 | 133.6 | 209.8 | 319.9 | 415.1 | 567.4 | 679.7 | 861 | 1157.4 |
| 2003 | 334.4 | 456.7 | 229.6 | 299.8 | 287.4 | 368.8 | 69.2 | 128.1 | 202.6 | 293.1 | 394.7 | 494.4 | 637.8 | 826.4 | 1118 |
| 2004 | 310 | 418.2 | 215.6 | 283.3 | 255 | 332.6 | 66.4 | 120.1 | 187.5 | 267.1 | 363.1 | 458 | 589.4 | 782.4 | 1030.2 |
| 2005 | 289 | 393.5 | 199.9 | 281.2 | 271.6 | 287.2 | 63.6 | 110.3 | 167.9 | 249.7 | 328 | 427.1 | 562.7 | 719.6 | 1005.5 |
| 2006 | 280.4 | 378.8 | 194.5 | 276.8 | 265 | 244 | 63.3 | 111.3 | 179.7 | 241.8 | 339.3 | 401.7 | 517.9 | 716 | 880.5 |
| 2007 | 264.4 | 361.4 | 180.2 | 252.6 | 265.5 | 254.8 | 58.5 | 107.8 | 165.8 | 240.1 | 299.8 | 380.7 | 500.7 | 652.6 | 858.3 |
| 2008 | 269.2 | 364.8 | 186 | 259 | 275.2 | 231.4 | 58.5 | 112.9 | 167.6 | 230.5 | 308.9 | 393.9 | 489.9 | 677.6 | 906.6 |
| 2009 | 259.7 | 358.6 | 172.7 | 253.2 | 276.4 | 217.2 | 66.5 | 108.8 | 168.2 | 233.4 | 297.3 | 367.6 | 475.5 | 630.2 | 832.1 |
| 2010 | 259 | 353.4 | 176.8 | 254.7 | 277.5 | 230.9 | 66.7 | 110.3 | 158.5 | 236.4 | 289.2 | 380.4 | 463.2 | 631.4 | 848.9 |
| 2011 | 253.1 | 351.2 | 167 | 247.2 | 281.3 | 227.2 | 60 | 111.6 | 162.4 | 218.6 | 298.2 | 367.4 | 462.3 | 605.9 | 810.4 |
| 2012 | 259.8 | 351 | 179.5 | 254.4 | 304.5 | 208.8 | 65.5 | 109.9 | 165.1 | 233.5 | 302.1 | 382.1 | 469.5 | 595.7 | 852.2 |
| 2013 | 250.6 | 346 | 166.5 | 249.1 | 263.3 | 202.8 | 66.7 | 112 | 164.8 | 221.1 | 301.5 | 369 | 459.6 | 573.8 | 741.7 |
| 2014 | 254.8 | 346.3 | 173.5 | 251.4 | 277.9 | 202.3 | 66.4 | 112.9 | 174.4 | 224.5 | 290.3 | 366.4 | 471 | 598.5 | 777.6 |
Table 2: Adjusted rates of first MI per 100,000 by gender, race/ethnicity and 5-year age group. New Jersey 2000-2014.
Discussion and Conclusion
This study provides evidence that there was a continuing decline in MI incidence, from 2000-2008, a change that may not have been due to invasive cardiac treatments alone. Thus, this study provides evidence for the value of lifestyle changes including lowering of the percentage of persons who smoke and pharmacological control of CHD risk factors such as hypercholesterolemia and Hypertension (HTN). However, this decline leveled off after 2008 and this may be related to the increase of the rate of cardiac risk factors such as obesity and Diabetes Mellitus (DM).
The average age of a first MI is 65.6 for males but is six years older at 72.0 for females [7]. For MI, 28.4% of hospital stays for people 45 to 64 years of age were for women, but this increased to 63.7% of stays for those 85 years of age or older. For women 55 years of age and younger, hospitalization rates for acute MI increased from 2000 to 2009 [16]. Towfighi and associates reported hospitalization rates among patients aged 35 to 64 years old from 1997 to 2006 declined in both genders but the decline was greater in men than in women [17]. The incidence of acute MI has been shown to be increasing in younger women and they have greater in-hospital, early and late mortality when compared to men [18]. An analysis of data from the Variation in Recovery: Role of Gender on Outcomes of Young Acute MI Patients (VIRGO) cohort study of men and women 55 years or younger hospitalized for acute MI showed that women with acute MI had higher rates of risk factors such as cardiovascular disease and comorbidities such as DM, congestive heart failure, chronic obstructive pulmonary disease, renal failure, and morbid obesity than men [19]. These same women also exhibited lower physical and mental health status than men along with higher levels of depression and stress and lower quality of life. Gupta and associates reported acute MI hospitalization rates and in-hospital mortality for patients with acute MI across 30–54 age groups from the years 2001 to 2010 showed no decline in hospitalization over the time period for either men or women but women had higher comorbidities and in hospital mortality than men [20]. Bucholz and associates reported that males had a greater rate of first MIs than females but they also had a greater decline in the incidence of MI than did females over the study period [21]. Blacks had a higher incidence of MI in all age groups [7] and a slower decline in CHD and MI incidence [1,22,23]. The same is true for black females when compared to white females [23]. A study showed that white men experienced a 24% decrease in hospitalized MI rates from 2002 to 2007, whereas black men experienced a decline of only 18% [24]. Another study looking at acute MI hospitalization in a Medicare population showed that while there was a decline across races over a 10-year period, from 2002 to 2011, the decline was greater for Whites than for Black [25]. Whites had a decline of 36.6% in hospitalization rates for an annual decline in of 5.1% while blacks had a smaller decline of 26.4% for an annual decline of 3.4%. A study using data from the Cooperative Cardiovascular Project, survival and life expectancy after acute MI were higher in whites than in blacks, 7.4% versus 5.7% [26]. Blacks were found to be less likely to undergo invasive procedures compared with white men [27]. Our study shows that Hispanics had the biggest improvement with a decline in MI incidence followed by whites and finally by blacks. Hispanics had the highest rate of MI in 2000 but by 2014, they had the lowest rate of the racial groups. This may indicate that we are doing a better job of diagnosing and treating CHD in the Hispanic population. All age groups showed a decline in MI incidence but this was most pronounced in the older age groups.
A lack of further decline in MI incidence was seen in all groups after 2008-2009. This is a disturbing finding that may indicate a slowdown in rates of decline in CHD mortality [28,29]. The reasons for this are not well understood but we speculate that this may be due to the plateauing in the use of interventional and pharmacological therapies seen after 2008-2009 and/or by the increase in the rate of cardiovascular risk factors. Although risk factors such as smoking rates [30] and hypercholesterolemia [7] have declined during the study period, there has been an increase in HTN [7], DM [31,32] and obesity [32,33] in the population. At the same time cardiac interventions such cardiac catheterization, percutaneous transluminal coronary angioplasty and coronary artery bypass grafting showed a decline [7].
Limitations of this study include the fact that out-of-state deaths of present and former New Jersey residents may be missing, marginally reducing the incidence rates shown, but this should be ameliorated since MIDAS includes records of New Jersey residents who died outside of the state but not of those who died outside the US. Data on former New Jersey residents living in other states with CHD who did not die maybe missing. A possible limitation maybe the misclassification of racial identity of patients in the hospital versus the census, which might distort rates calculated for Hispanics. Another limitation is the exclusion of Veterans Administration (VA) hospital data from the MIDAS study. The VA operates one medical center in the state of New Jersey but since they make up a small percentage of hospitalized persons in New Jersey (estimated to be about 3%) and most veterans with an emergency would be taken to the closest hospital, this is likely to be a small omission. Using the US 2010 census to adjust data makes the assumption that no change has occurred in the population structure under study which may not be valid. A review of the population changes in New Jersey between the years of 2000 and 2010 showed an increase of 4.4% in the Hispanic population, a decline of 3.8% in the white population and no change in the Black population. The years between 2010 and 2014 showed an increase of 1.8% in the Hispanic population, a decline of 1.2% in the white population and no change in the Black population. We presume that there may be over representation of a first MI in whites and an underrepresentation in Hispanics in the years following 2010 and vice versa before 2010 (especially in the early years of the study). Nonetheless, we feel the change in population before and after the US 2010 census does not alter the outcome and the interpretation of the study.
Strengths of the study include the very large and comprehensive database of patients with CVD, the linkage of these hospital admission data to the New Jersey death certificate file, and the long follow-up to 15 years. Along with this and having a population racial breakdown in New Jersey that is similar to the United States at large [34], we believe that our study findings are generalizable to other states.
This study provides evidence that there was a continuous decline in MI incidence from 2000 to 2008 but it leveled off after that year. Although the oldest age groups showed the biggest decline in incidence, the benefit was noted across all age groups. Females had improved outcomes over the study period to close the gap in incidence with males but more work still needs to be done for them to reach parity.
Aknowledgement
The authors would like to thank Dr. George Rhoads for his help in the research, data analysis and writing and Dr. John Pantazopoulos for his help in the discussion.
References
- Ford ES, Roger VL, Dunlay SM, Go AS, Rosamond WD (2014) Challenges of ascertaining national trends in the incidence of coronary heart disease in the United States. J Am Heart Assoc. 3: e001097.
- Gerber Y, Weston SA, Jiang R, Roger VL (2015) The changing epidemiology of myocardial infarction in Olmsted County, Minnesota, 1995-2012. Am J Med. 128:144-151.
- Yeh RW, Normand SL, Wang Y, Barr CD, Dominici F (2012) Geographic disparities in the incidence and outcomes of hospitalized myocardial infarction: does a rising tide lift all boats? Circ Cardiovasc Qual Outcomes. 5: 197-204.
- Johansson S, Rosengren A, Young K, Jennings E (2017) Mortality and morbidity trends after the first year in survivors of acute myocardial infarction: a systematic review. BMC Cardiovasc Disord. 17: 53.
- Talbott EO, Rager JR, Brink LL, Benson SM, Bilonick RA, et al. (2013) Trends in acute myocardial infarction hospitalization rates for US States in the CDC tracking network. PLoS One. 8: e64457.
- Yeh RW, Sidney S, Chandra M, Sorel M, Selby JV, et al. (2010) Population trends in the incidence and outcomes of acute myocardial infarction. N Engl J Med. 362: 2155-2165.
- Benjamin EJ, Virani SS, Callaway CW, Chamberlain AM, Chang AR, et al. (2018) Heart Disease and Stroke Statistics-2018 Update: A Report From the American Heart Association. Circulation. 137: e67-e492.
- Fang J, Alderman MH, Keenan NL, Ayala C. (2010) Acute myocardial infarction hospitalization in the United States, 1979 to 2005. Am J Med. 123: 259-266.
- Reynolds K, Go AS, Leong TK, Boudreau DM, Cassidy-Bushrow AE, et al. (2017) Trends in incidence of hospitalized acute myocardial infarction in the Cardiovascular Research Network (CVRN). Am J Med. 130: 317-327.
- Krumholz HM, Normand SL, Wang Y. (2014) Trends in hospitalizations and outcomes for acute cardiovascular disease and stroke, 1999-2011. Circulation.130: 966-975.
- Myerson M, Coady S, Taylor H, Rosamond WD, Goff DC Jr, et al. ( 2009) Investigators a. declining severity of myocardial infarction from 1987 to 2002: the Atherosclerosis Risk in Communities (ARIC) Study. Circulation. 11: 503-514.
- Jaro MA (1989) Advances in record-linkage methodology as applied to matching the 1985 census of Tampa, Florida. Journal of the American Statistical Association. 84: 414-420.
- Kostis JB, Wilson AC, O'Dowd K, Gregory P, Chelton S, et al. (1994) Sex differences in the management and long-term outcome of acute myocardial infarction. A statewide study. MIDAS Study Group. Myocardial Infarction Data Acquisition System. Circulation. 90: 1715-1730.
- Shao Y-H Changing clinical presentation and outcome of acute myocardial infarction in new jersey from 1990-2004: Department of Epidemiology, University of Medicine and Dentistry of New Jersey-School of Public Health.
- R Core Team (2018). R: A language and environment for statistical computing. R Foundation for Statistical Computing, Vienna, Austria.
- Izadnegahdar M, Singer J, Lee MK, Gao M, Thompson CR, et al. (2014) Do younger women fare worse? Sex differences in acute myocardial infarction hospitalization and early mortality rates over ten years. J Womens Health (Larchmt). 23: 10-17.
- Towfighi A, Markovic D, Ovbiagele B (2011) National gender-specific trends in myocardial infarction hospitalization rates among patients aged 35 to 64 years. Am J Cardiol. 108: 1102-1107.
- Chandrasekhar J, Gill A, Mehran R (2018) Acute myocardial infarction in young women: current perspectives. Int J Womens Health.10: 267-284.
- Bucholz EM, Strait KM, Dreyer RP, Lindau ST, D'Onofrio G, et al. (2017) Editor's choice-sex differences in young patients with acute myocardial infarction: a virgo study analysis. Eur Heart J Acute Cardiovasc Care. 6: 610-622.
- Gupta A, Wang Y, Spertus JA, Geda M, Lorenze N, et al. (2014) Trends in acute myocardial infarction in young patients and differences by sex and race, 2001 to 2010. J Am Coll Cardiol. 64: 337-345.
- Bucholz EM, Butala NM, Rathore SS, Dreyer RP, Lansky AJ, et al. (2014) Sex differences in long-term mortality after myocardial infarction: a systematic review. Circulation. 130: 757-767.
- Sacks NC, Ash AS, Ghosh K, Rosen AK, Wong JB, et al. (2015) Trends in acute myocardial infarction hospitalizations: Are we seeing the whole picture? Am Heart J. 170: 1211-1219.
- Cooper R, Cutler J, Desvigne-Nickens P, Fortmann sp, Friedman L, et al. (2000) Trends and disparities in coronary heart disease, stroke, and other cardiovascular diseases in the United States: findings of the national conference on cardiovascular disease prevention. Circulation. 102: 3137-3147.
- Rosamond WD, Chambless LE, Heiss G, Mosley TH, Coresh J, et al. (2012) Twenty-two-year trends in incidence of myocardial infarction, coronary heart disease mortality, and case fatality in 4 US communities, 1987-2008. Circulation. 125: 1848-1857.
- Sacks NC, Ash AS, Ghosh K, Rosen AK, Wong JB, et al. (2015) Recent national trends in acute myocardial infarction hospitalizations in Medicare: shrinking declines and growing disparities. Epidemiology. 26: e46-47.
- Bucholz EM, Ma S, Normand SL, Krumholz HM (2015) Race, socioeconomic status, and life expectancy after acute myocardial infarction. Circulation. 132: 1338-1346.
- Rodriguez F, Foody JM, Wang Y, Lopez L (2015) Young hispanic women experience higher in-hospital mortality following an acute myocardial infarction. J Am Heart Assoc. 4: e002089.
- Sidney S, Quesenberry CP, Jaffe MG, Sorel M, Nguyen-Huynh MN, et al. (2016) Recent Trends in Cardiovascular Mortality in the United States and Public Health Goals. JAMA Cardiol. 1: 594-599.
- Ma J, Ward EM, Siegel RL, Jemal A. (2015) Temporal trends in mortality in the united states, 1969-2013. JAMA. 314: 1731-1739.
- American Lung Association. Overall Tobacco Trends, Accessed.
- Klonoff DC (2009) The increasing incidence of diabetes in the 21st century. J Diabetes Sci Technol. 3: 1-2.
- Bhupathiraju SN, Hu FB (2016) Epidemiology of obesity and diabetes and their cardiovascular complications. Circ Res. 118: 1723-1735.
- Ogden CL, Carroll MD, Fryar CD, Flegal KM. (2015) Prevalence of obesity among adults and youth: united states: 2011–2014. NCHS data brief, 219.
- Foundation KF. (2018) Population distribution by race/ethnicity.
 Spanish
  Chinese
  Russian
  German
  French
  Japanese
  Portuguese
  Hindi
Hindi 