Research Article, Int J Cardiovasc Res Vol: 7 Issue: 3
Utility of Two-Dimensional Speckle Tracking Echocardiography in Understanding of Inferior ST Segment Depression in the Setting of Acute Anterior Myocardial Infarction
Mohamed Yahia1*, Sami Nimer Ghazal2 and Ayman Azoz3
1Department of Cardiology, College of Medicine, University of Menoufia, Shebin Alkoum, Egypt
2Department of Internal Medicine, College of Medicine, Imam Abdulrahman Bin Faisal University, Dammam, Saudi Arabia
3Department of Cardiology, National Heart institute, Cairo, Egypt
*Corresponding Author : Mohamed Yahia
Department of Cardiology, University of Menoufia, Gamal Abdulnaser Street, Shebin Alkoum City, 32511, Egypt
Tel: 00201005362162
E-mail: m.yahia.emam2000@gmail.com
Received: August 06, 2018 Accepted: August 13, 2018 Published: August 20, 2018
Citation: Yahia M, Ghazal SN, Azoz A (2018) Utility of Two-Dimensional Speckle Tracking Echocardiography in Understanding of Inferior ST Segment Depression in the Setting of Acute Anterior Myocardial Infarction. Int J Cardiovasc Res 7:3. doi: 10.4172/2324-8602.1000353
Abstract
Background: A patient suffering from an anterior ST segment elevation myocardial infarction (STEMI) will frequently demonstrate ST segment depression (STD) in the inferior leads (II, III, and aVF). The aim of this study was to determine the meaning of STD in the early stages of an acute anterior MI, and whether they represent remote ischemia or reflect an electrical mechanism by using speckle-tracking echocardiography.
Methods: Fifty patients suffering from acute anterior STEMI were enrolled in this prospective study. The patients were classified into two groups each one included 25 patients. Group 1 included patients who had STD in the inferior leads and group 2 included patients who had not. All of the patients were evaluated with a standard 12-lead electrocardiography (ECG), two dimensional echocardiography, speckle-tracking echocardiography, and coronary angiography.
Results: The average global longitudinal peak systolic strain (Avg_GLPS%) was - 9.8 ± 2.4% in group 1 versus -10.7 ± 2.3 in group 2 (p=0.188). The longitudinal strains of the basal inferior segments were -13.6 ± 2.8% in group 1 versus -15.8 ± 3.7% in group 2 (p=0.026), and the longitudinal strains of mid inferior segments were -13 ± 3.2 in group 1 versus -15.1 ± 2.7% in group 2 (p=0.019). Group 1 had higher frequency of multivessel disease, right coronary artery (RCA) and left circumflex coronary artery (LCX) stenosis than group 2.
Conclusion: This study supports the belief that inferior STD on an ECG during an acute anterior STEMI is a sign of ischemia that often involves the right coronary artery.
Keywords: ST segment elevation myocardial infarction; ST segment depression; Speckle-tracking echocardiography
List of Abbreviations
MI: Myocardial Infarction; STEMI: ST Segment Elevation Myocardial Infarction; STD: ST Segment Depression; ECG: Electrocardiography; GLPS: The Global Longitudinal Peak Systolic Strain; Avg: GLPS: The Average Global Longitudinal Peak Systolic Strain; LAD: Left Anterior Descending Artery; RCA: Right Coronary Artery; LCX: Left Circumflex Coronary Artery; LVEF: Left Ventricle Ejection Fraction
Introduction
The consequence of STD, which is often seen in the distant noninfarcting ventricular wall during the early stage of STEMI, remains unclear. A patient suffering from an anterior MI frequently demonstrates STD in the inferior leads (II, III, and aVF). Former studies explained this depression by either distant wall ischemia [1,2], or a benign electrical phenomenon [3].
Strain imaging using with speckle-tracking echocardiography is an imaging modality that evaluates global and segmental myocardial function. It is rather unrestricted from the angle dependency and frame-rate limitations of tissue Doppler velocity.
The aim of this study was to determine the meaning of STD in the early stages of an acute anterior MI, and whether they reflect an electrical mechanism or represent ischemia by using speckle-tracking echocardiography.
Methods
Study population
This study included 50 patients with mean age 56.32 ± 7.1 years suffering from a first anterior STEMI, who were admitted to the King Fahd Hospital of the University in Saudi Arabia between January 2017 to April 2018. Acute STEMI was diagnosed by the presence of typical chest pain exceeding for more than 30 minutes, and an ST segment elevation equal to or more than 0.1 mV in the anterior chest leads (V1–V6) associated with elevated cardiac enzymes. Those patients with a previous MI, previous revascularization, significant valvular heart disease, preexisting cardiomyopathies, or baseline ST changes in the inferior leads secondary to bundle branch block, drugs, or electrolytes disturbances were excluded from this study. The Institutional Review Board of the University of Imam Abdulrahman Bin Faisel approved this study, and an informed consent was obtained from the patients before their contribution in the study.
Standard 12-lead electrocardiography
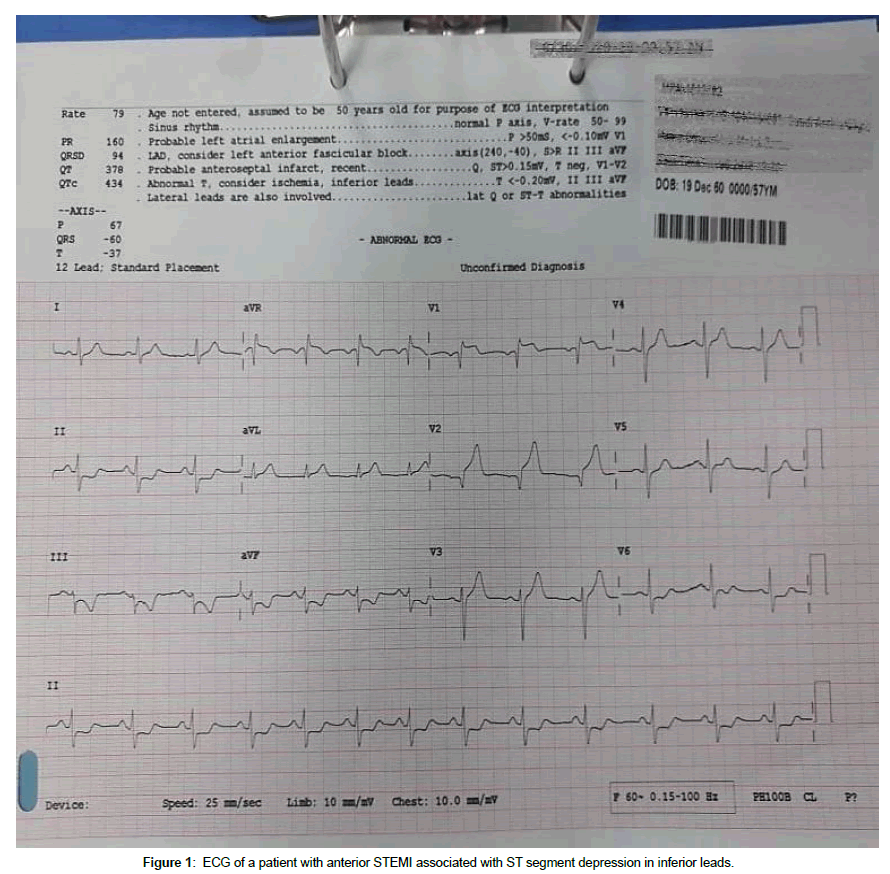
A twelve lead ECG was obtained from every patient using MAC 3500 resting ECG analysis system (GE healthcare, 8200 W Tower Ave, Milwaukee, WI, USA). An anterior STEMI was diagnosed by the presence of an elevation of the ST segment ≥ 0.1 mV in at least two contiguous leads representing the anterior wall (V1-V6). Patients whose ECG showed STD in leads II, III and aVF were placed in Group 1 (n=25) and those who did not have were included in Group 2 (n=25) (Figure 1).
Two dimensional resting echocardiography
A VIVID E9 machine was used (GE Healthcare, Chicago, IL, USA). Two-dimensional echocardiography was provided for all patients before PCI. The diameters, areas, and volume of LV were measured according to guidelines of the American Society of Echocardiography. The modified Simpson’s rule was used to measure the LV ejection fraction. The biplane area- length method was used to measure left atrial volume and left atrial volume index [4].
Speckle-tracking echocardiography analysis
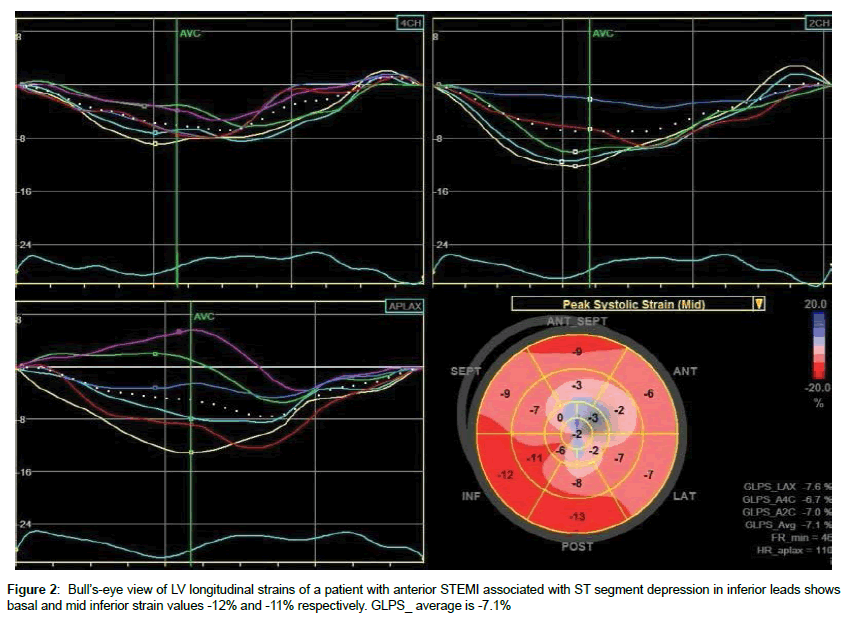
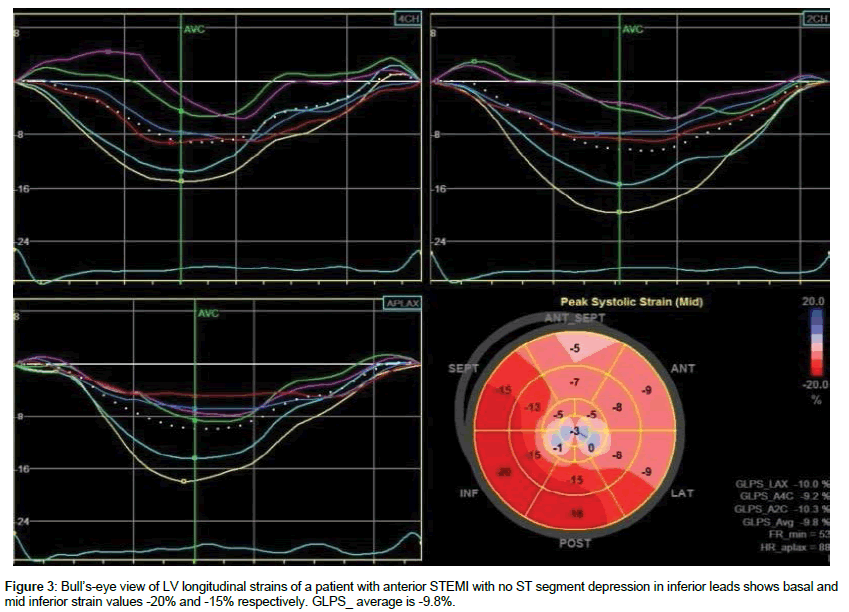
An EchoPAC workstation (GE Healthcare, Chicago, IL, USA) was used in assessment of speckle-tracking echocardiography. Three views were used (apical long axis, 2 chamber and 4 chamber. The frame rate was adjusted between 60-100 frames per second. Three cardiac cycles were stored for offline analysis. The time of aortic valve closure was determined in apical long axis view. Automated functional imaging was used in recording LV longitudinal strain [5]. The software automatically identifies the regions of interest to trace the myocardial wall. The endocardial tracing of the region of interest was manually adjusted some times to reach a best orientation. The region of interest delineation the LV wall was divided into six segments. The peak systolic strain of each wall segment was calculated. The global longitudinal peak systolic strain (GLPS%) for each view was determined. The average GLPS (Avg_GLPS%) of the three views was finally recorded.
Coronary angiography
The general management of both groups was similar. Opening of left anterior descending (LAD) by experienced cardiologists, and the extent of the coronary artery disease (CAD) in RCA and LCX were examined. Significant coronary lesions were identified by presence of stenosis of ≥ 50% diameter reduction.
Laboratory investigations
Recommended laboratory investigations for STEMI were performed, including an estimation of the cardiac markers, kidney function tests, and a lipid profile.
Statistical analysis
Data were analyzed using SPSS software version 20.0. The Kolmogorov-Smirnov, Shapiro-Wilk and D’agostino tests were used to verify the normality of the distribution of the variables, while the comparisons between the groups were evaluated by means of a chisquare test for the variable category. Paired t test was used to compare between quantitative normally distributed variables. Mann-Whitney U-test was used to compare between quantitative abnormally distributed variables. The p value below 0.5 was considered significant.
Results
The mean age of the patients was 56.32 ± 7.1 years, and male percentage was 60%. The mean body surface area (BSA) was 1.8 m2. Twenty two of the patients were smokers (44%), 18 were diabetic (36%), 20 were hypertensive (40%) and 25 were dyslipidemic (50%). No significant differences between the two groups with regard to age, gender, risk factors, and drug therapy. The mean ST elevation was 5.8 ± 2.3 mm in group 1 and 4.4 ± 1.5 mm in group 2 (p=0.027). The mean inferior ST depression in group 1 was 1.9 ± 0.8 mm. Cardiac enzymes were higher in group I, but the difference did not reach a significance value. Table 1 shows the characteristics and laboratory data of the studied population.
| Group 1 (n=25) |
Group 2 (n=25) |
P value | |
|---|---|---|---|
| Age, y (mean ± SD) | 56.6 ± 7.6 | 56.1 ± 6.87 | 0.816 |
| Male sex, n.,% | 16 (64%) | 14 (56%) | 0.564 |
| BMI kg/m2 (mean ± SD) | 29.1 ± 4.1 | 27.9 ± 3.4 | 0.254 |
| BSA m2 (mean ± SD) | 1.8 ± 0.1 | 1.8 ± 0.1 | 0.196 |
| Diabetes Mellitus, n.,% | 10 (40%) | 8 (32%) | 0.556 |
| Hypertension, n.,% | 9 (36%) | 11 (44%) | 0.564 |
| Smoking, n.,% | 12 (48%) | 10 (40%) | 0.569 |
| Dyslipidemia, n.,% | 12 (48%) | 13 (52%) | 0.777 |
| Family history of CAD, n.,% | 5 (20%) | 4 (16%) | 1.000 |
| SBP (mean ± SD) | 135. ± 18.5 | 132.8 ± 12.3 | 0.618 |
| DBP (mean ± SD) | 85.2 ± 7.2 | 83.3 ± 7.5 | 0.350 |
| ST elevation mm (mean ± SD) | 5.8 ± 2.3 | 4.5 ± 1.5 | 0.027 |
| ST depression mm (mean ± SD) | 1.9 ± 0.8 | - | - |
| LDL mg/dl (mean ± SD) | 139.1 ± 24.8 | 136.4 ± 22.8 | 0.697 |
| HDL mg/dl (mean ± SD) | 38.5 ± 7.6 | 38.2 ± 6.1 | 0.886 |
| TG mg/dl (mean ± SD) | 139.6 ± 50.7 | 149.4 ± 49.9 | 0.393 |
| TCH mg/dl (mean ± SD) | 205.4 ± 205.4 | 204.4 ± 25.8 | 0.895 |
| Creatinine mg/dl (mean ± SD) | 1 ± 0.34 | 1 ± 0.32 | 0.854 |
| Peak Troponin-I, ng/ml | 55 ± 33.3 | 49.1 ± 27.4 | 0.712 |
| Peak CK-MB U/l (mean ± SD) | 349.6 ± 122.6 | 323.7 ± 116.8 | 0.449 |
| Aspirin, n.,% | 25 (100%) | 25 (100%) | - |
| Clopidogrel, n.,% | 25 (100%) | 25 (100%) | - |
| ACEI, n.,% | 22 (88%) | 20 (80%) | 0.702 |
| Beta blockers, n.,% | 20 (80%) | 19 (76%) | 0.733 |
| Statins, n.,% | 25 (100%) | 24 (96%) | 1.000 |
Table 1: Patient’s characteristics, electrocardiographic and laboratory data of the studied patients.
There were no significant differences with regard to the conventional echocardiographic results between patient groups (Table 2). Avg_GLPS was - 9.8 ± 2.4% in group 1 versus -10.7 ± 2.3% in group 2 (p=0.188). Both groups showed significant differences regarding the longitudinal strains of the individual segments of the inferior LV walls. The longitudinal strains of the basal inferior segments were -13.6 ± 2.8% in group 1 versus -15.8 ± 3.7% in group 2 (p=0.026), and the longitudinal strains of mid inferior segments were -13 ± 3.2 in group 1 versus -15.1 ± 2.7% in group 2 (p=0.019). The peak strains of the apical inferior segments were reduced in both groups with no significance differences between them (Table 3, Figures 2 and 3).
| Group 1 (n=25) |
Group 2 (n=25) |
P value | |
|---|---|---|---|
| LV septal wall thickness (cm) | 1.1 ± 0.2 | 1 ± 0.2 | 0.116 |
| LV diastolic dimension (cm) | 5.4 ± 0.5 | 5.2 ± 0.6 | 0.170 |
| LV systolic dimension (cm) | 3.7 ± 0.37 | 3.7 ± 0.5 | 0.625 |
| LV end diastolic volume (ml) | 107.7 ± 26.4 | 108.7 ± 19.2 | 0.886 |
| LV end systolic volume (ml) | 57.4 ± 14 | 56.1 ± 10.6 | 0.714 |
| LV ejection fraction (%) | 46 ± 5.5 | 47.7 ± 5.2 | 0.264 |
| LA size (cm) | 3.8 ± 0.4 | 3.7 ± 0.5 | 0.351 |
| LAVi | 30.4 ± 5.5 | 29.5 ± 5.5 | 0.591 |
| E (cm/s) | 62.9 ± 10.7 | 60.2 ± 10 | 0.351 |
| A (cm/s) | 66.4 ± 12.3 | 63.6 ± 10.9 | 0.398 |
| E/A ratio | 1 ± 0.2 | 0.9 ± 0.2 | 0.891 |
| E/Ea | 9.1 ± 3 | 8.6 ± 2.5 | 0.613 |
| Aa (cm/s) | 9 ± 1.9 | 8.8 ± 2.1 | 0.831 |
Table 2: Comparison between the two studied groups according to two dimensional echocardiographic results.
| LS, % | Group 1 (n=25) |
Group 2 (n=25) |
P value |
|---|---|---|---|
| Basal inferior | -13.6 ± 2.8 | -15.8 ± 3.7 | 0.026 |
| Mid inferior | -13 ± 3.2 | -15.1 ± 2.7 | 0.019 |
| Apical inferior | -10.3 ± 2.5 | -10.7 ± 2.8 | 0.571 |
| Ave GLS | -9.8 ± 2.4 | -10.7 ± 2.3 | 0.188 |
Table 3: Longitudinal strains of inferior segments and average LV strains of the two studied groups.
The infarct related artery was LAD in all patients. The site of LAD occlusion was proximal in 14 (56%) patients in group 1 and 12 (48%) patients in group 2, while mid LAD occlusion was found in 11 (44%) patients in group 1 and 13 (52%) patients of group 2 (p=0.571). Group I had higher incidence of multivessel disease (p=0.008). Sixteen (64%) patients in group 1 had significant RCA lesions, while 7 (28%) patients in group 2 had significant RCA lesions (p=0.010). In addition, thirteen (52%) patients in group 1 had significant LCX lesions, while 6 (24%) patients in group 2 had significant LCX lesions (p=0.026) (Table 4).
| Group 1 (n=25) |
Group 2 (n=25) |
P value | |
|---|---|---|---|
| Culprit artery, % | LAD (100%) | LAD (100%) | NS |
| Primary PCI, n.,% | 24(96%) | 23(92%) | NS |
| LAD lesion length, mm | 19.8 ± 4.9 | 20.7 ± 4.8 | 0.26 |
| Site of LAD lesion | |||
| Proximal, n.,% | 14(56%) | 12(48%) | 0.571 |
| Mid, n.,% | 11(44%) | 13(52%) | |
| Dominant RCA, n.% | 19(76%) | 21(84%) | 0.479 |
| Multivessel disease | 20(80%) | 9(44%) | 0.008 |
| Significant RCA lesions | 16(64%) | 7(28%) | 0.010 |
| Significant LCX lesions | 13(52%) | 6(24%) | 0.026 |
Table 4: Comparison between the two studied groups according to coronary angiographic data.
Discussion
Previous studies have investigated the pathophysiology of remote STD on the ECGs of patients presenting with acute STEMI. Those studies used various methods, including pulsed wave tissue Doppler echocardiography [6], technetium-99 m ventriculography [7], coronary angiography [8,9], and positron tomography [10]. The researchers analyzed this STD in the precordial leads in patients with acute inferior STEMI [6,7], anterior STEMI [8], or both anterior and inferior STEMI [9,10].
This study investigated the meaning of STD in the early stages of an acute anterior MI. Inferior myocardial longitudinal strains were assessed by speckle tracking echocardiography in 50 patients presented with anterior STEMI. There were significant decreases in the GLPS in all of the patients with Avg_GLPS percentages 10.22 ± 2.37% (reported normal values vary from -16% to -22.1%) [11]. Avg_ GLPS did not differ significantly between patients with inferior STD and those without. The peak systolic strain values obtained from the mid and basal inferior segments were significantly lower in patients with inferior STD. The peak strains of the apical inferior segments were reduced in both groups with no significance differences between them which could be explained by the fact that the apical inferior segment is often supplied by LAD. These findings support the opinion that the occurrence of STD in the inferior leads during the acute stage of an anterior STEMI indicates the extent of CAD in the RCA and LCX that feed the remote noninfarcting inferior wall.
This study reported no significant differences in the two groups with regard to the sex, age, or cardiovascular risk factors. Celik et al. [6] and Zoghi et al. [12] also reported no differences between patients who had STD and those who had not regarding these variables.
Dewhurst et al. [13] used radionuclide ventriculography in their study of 100 patients with anterior and inferior MIs. They concluded that the infarct size was the major determinant of reciprocal STD, and that such a depression is frequently related to the extension of the infarction, which may be dependent upon collateral vessel disease.
In contrast, Camara et al. [14] who compared patients with associated STD and those without by using wall motion score index, and they reported non-significant difference in the wall motion score index in the remote ventricular wall in either group. Therefore, they excluded the theory that reciprocal STD during an acute STEMI reflects remote ischemia. Moreover, the STD is affected by issues determining the grade of the ST elevation, as well as the size and location of the MI. Similarly, Mirvis et al. [15] and Little et al. [16] who studied the physiological basis and mechanism of STD in patients with acute STEMI, and they concluded that it related to an electrical phenomenon. Similarly, Wasserman et al. [17] and Parale et al. [18] reported that remote STD was closely correlated with the magnitude of the ST segment elevation, and thus, that the STD was related to an electrical. phenomenon.related to an electrical phenomenon.
In the current study, significant RCA and LCX stenotic lesions were significantly more frequent in patients with associated inferior STD than those without. Haraphongse et al. [8] demonstrated a significant association between reciprocal inferior STD in patients presenting with anterior STEMI and the severity of the CAD. Furthermore, Zoghi et al. [12] reported a relation between the finding of remote STD during STEMI and angiographic evidence of multivessel CAD. In addition, Sasaki et al. [19] in their study of 188 patients with anterior STEMI suggested that inferior STD which accompany an anterior STEMI are related to the struggle between the reciprocal STD produced by a high lateral wall infarction as a result of proximal LAD occlusion, and ST segment elevation produced by an apical inferior wall infarction as a result of occlusion of a wrapped LAD artery. Similarly, patients with anterior STEMI and remote inferior STD demonstrated higher modified Gensini score and higher incidence of both RCA and LCX lesions than those without [20].
Limitations
The study was based on a small number of patients; therefore, the results need to be verified using a larger sample size. In addition, we used only longitudinal strain speckle-tracking echocardiography to assess the inferior wall of the LV. These results should be confirmed by evaluating the circumferential and radial strains.
Conclusion
This study supports the belief that STD on an ECG during an acute anterior STEMI is a sign of ischemia that often involves the right coronary artery.
Conflict of Interest
The authors declare that they have no conflicts of interest.
Acknowledgments
The authors would like to thank Professor Akram Alkhadra, Mustafa Rashed and all the staff members of cardiology department in King Fahd Hospital of the University.
References
- Nasmith J, Marpole D, Rahal D, Homan J, Stewart S, et al. (1982) Clinical outcomes after inferior myocardial infarction. Ann Intern Med96: 23-26.
- Yousif H, Lo E, Taha T, Stockins B, Oakley CM (1989) The diagnostic significance of reciprocal ST segment depression in acute myocardial infarction. Q J Med 72: 849-955.
- Stevenson RN, Ranjadayalan K, Umachandran V, Timmis AD (1993) Significance of reciprocal ST depression in acute myocardial infarction: A study of 258 patients treated by thrombolysis. Br Heart J 69: 211-214.
- Lang RM, Badano LP, Mor-Avi V, Afilalo J, Armstrong , et al. (2015) Recommendations for cardiac chamber quantification by echocardiography in adults: An update from the American Society of Echocardiography and the European Association of Cardiovascular Imaging. J Am Soc Echocardiogr 28: 1-39.
- Belghitia H, Brette S, Lafitte S, Reant P, Picard , et al. (2008) Automated function imaging: a new operator-independent strain method for assessing left ventricular function. Arch Cardiovasc Dis 101: 163-169.
- Celik S, Yilmaz R, Baykan M, Orem C, Erdol C (2003) Are reciprocal changes a consequence of “Ischemia at a distance” or merely a benign electrical phenomenon? A pulsed-wave tissue Doppler echocardiographic study. Ann Noninvasive Electrocardiol 8: 302-307.
- Ong L, Valdellon B, Coromilas J, Brody R, Reiser P, et al. (1983) Precordial ST segment depression in inferior myocardial infarction: Evaluation by quantitative thallium scintigraphy and technetium-99m ventriculography. Am J Cardiol 51: 734-739.
- Haraphongse M, Tanomsup S, Jugdutt BI (1984) Inferior ST Segment depression during acute anterior myocardial infarction: Clinical and angiographic correlations. J Am Coll Cardiol 4: 467-476.
- Ferguson DW, Pandian N, Kioschos M (1984) Angiographic evidence that reciprocal ST segment depression during acute myocardial infarction does not indicate remote ischemia: Analysis of 23 patients. Am J Cardiol 53: 55-62.
- Billadello JJ, Smith JL, Ludbrook PA, Tiefenbrunn AJ, Jaffe AS, et al. (1983) Implication of “reciprocal” ST segment depression associated with acute myocardial infarction identified by positron tomography. J Am Coll Cardiol 2: 251-257.
- Yingchoncharoen T, Agarwal S, Popović ZB, Marwick TH (2013) Normal ranges of left ventricular strain: A meta-analysis. J Am Soc Echocardiogr 26: 185-191.
- Zoghi M, Gürgün C, Yavuzgil, Türkoğlu I, Kültürsay H, et al. (2003) The angiographic correlation between ST segment depression in noninfarcted leads and the extent of coronary artery disease in patients with acute inferior myocardial infarction: A clue for multivessel disease. Can J Cardiol 19: 67-71.
- Camara EJ, Chandra N, Ouyang P, Gottlieb SH, Shapiro EP (1983) Reciprocal ST change in acute myocardial infarction: Assessment by electrocardiography and echocardiography. J Am Coll Cardiol 2: 251-257.
- Dewhurst NG, Muir AL (1985) Clinical significance of “reciprocal” ST segment depression in acute myocardial infarction. Am J Med 78: 765-770.
- Mirvis DM (1988) Physiologic bases for anterior ST segment depression in patients with acute inferior wall myocardial infarction. Am Heart J 116: 1308-1322.
- Little WC, Rogers EW, Sodiums MT (1984) Mechanism of anterior ST segment depression during acute inferior myocardial infarction. Ann Intern Med 100: 226-229.
- Wasserman AG, Ross AM, Bogaty D, Richardson DW, Hutchinson RG (1983) Anterior ST segment depression during acute inferior myocardial infarction: Evidence for the reciprocal change theory. Am Heart J 105: 516-520.
- Parale GP, Kulkarni PM, Khade SK, Athawale S, Vora A (2004) Importance of reciprocal leads in acute myocardial infarction. J Assoc Physicians India 52: 376-379.
- Sasaki K, Yotsukura M, Sakata K, Yoshino H, Ishikawa K (2001) Relation of ST-segment changes in inferior leads during anterior wall acute myocardial infarction to length and occlusion site of the left anterior descending coronary artery. Am J Cardiol 87: 1340-1345.
- Knour M (2015) CRT-123 Significance of reciprocal St segment depression in St elevation myocardial infarction. JACC: Cardiovascular Interventions 8: S15.
 Spanish
  Chinese
  Russian
  German
  French
  Japanese
  Portuguese
  Hindi
Hindi 


