Research Article, J Plant Physiol Pathol Vol: 11 Issue: 6
Virus Vectors (Aphids and Whiteflies) Epidemiology in Virus-free Fields of Beauregard Sweetpotato Variety
Wilfred Wau* and Birte Komolong
National Agriculture Research Institute, Momase Regional Centre, Morobe Province, Papua New Guinea
*Corresponding Author: Wilfred Wau
National Agriculture Research Institute, Momase Regional Centre, Morobe Province, Papua New Guinea
Tel: +67579038444
E-mail: wilfred.wau@nari.org.pg
Received date: 31 December, 2021, Manuscript No. JPPP-21-50650;
Editor assigned date: 04 January, 2022, PreQC No. JPPP-21-50650 (PQ);
Reviewed date: 18 January 2022, QC No JPPP-21-50650;
Revised date: 24 January 2022, Manuscript No. JPPP-21-50650 (R);
Published date: 31 January, 2022, DOI: 10.37532/jppp.2021.10(1).284
Abstract
Virus diseases transmitted by aphids (Myzus persicae) and whiteflies (Bemisia tabaci) have been one of the major cause of yield decline in sweetpotato (Ipomoea batatas (L.) Lam) in sweetpotato producing countries including Papua New Guinea. In this study, the epidemiology of aphids and whiteflies was investigated at the National Agriculture Research Institute Momase Regional Center Bubia, in 2015. Virus-free sweetpotato variety of Beauregard was planted in two separated observatory plots on a field where different crops were grown. Virus vectors incursion were systematically sampled on weekly basis using binomial sampling technique throughout the growing period. It is observed from the result that virus vectors start moving into the crop soon after establishment of the sweetpotato plants. Incursions in particular happened from other crops growing adjacent to the sweetpotato trial plots. Whiteflies were observed to colonize sweetpotato plants all throughout the growing period but rarely occur with aphids. Whitefly and aphids population fluctuated at different times but generally peaked during high rainfall months and towards harvest. High population densities of vectors were discovered mostly at the edges of the trial plot with minimal virus symptoms expressed. In terms of sweetpotato virus management, these may suggest that farmers should clear weeds around the plots and grow non-host plant species (or lesser favored hosts) as barrier which may help in reducing incursion of vectors. It is suggested that planting materials for next planting should be obtained from inner plots rather than on the edges where plants are exposed to high population of vectors.
Keywords: Vectors (Aphids and Whiteflies), Virus-free material of Beauregard, Virus, Host, Incursion, Population density, Re-infection
Introduction
Sweetpotato (Ipomoea batatas (L.) Lam.) is an important subsistence food crop as well as cash crop in Papua New Guinea (PNG). It provides the primary source of dietary energy for 60% of the population [1]. Over the years of production the crop has experienced continual yield decline caused mostly by pest and disease of which virus is a major constraint [2].
Sweetpotato is vegetatively propagated from vines, sprouts or roots obtained from existing material which makes it prone to accumulate pathogens, especially viruses that are inevitably transmitted with the propagation material to the newly planted fields leading to crop decline and poor root quality [3,4]. Since viruses have the capacity to live and multiply inside their hosts/victims, they are usually carried from plant to plant by an insect vectors which feeds on plant sap, such as aphids or whiteflies.
Currently more than 22 viruses are known to infect cultivated sweetpotato worldwide and is mostly transmitted by aphids and [5]. In PNG there were 6 confirmed viruses detected to infect sweetpotato which are transmitted by these vectors [6].
The use of virus-free sweetpotato planting materials is being promoted as an effective virus management strategy here in PNG and elsewhere in major sweetpotato producing countries [7]. While use of virus-free materials can result in considerable gains in yield and quality of sweetpotato, the effect may not last depending on re-infection rates of the varieties with prevalent viruses and farmers have to acquire fresh planting materials.
As it requires farmers to invest in purchasing new planting material, it is important to know how long virus-free materials last in field to produce economical yields before being re-infected with viruses. There are many factors that contribute to re-infection rates of sweetpotato varieties with viruses and amongst them is the presence of vectors and population dynamics of the vector. Some studies have been done but generally there is little known about that in relation to re-infection rates.
The most significant insect vectors of sweetpotato viruses are aphids (Myzus persicae, Aphis gossypii, Macrosiphum euphorbiaea) and, whiteflies (Bemisia tabaci) [8]. In PNG, the prevalent species are Aphis gossypii and Bemisia tabaci [9]. A complex system of interaction between the virus and vectors (aphid and whitefly), the host and the environment, therefore influences the rate of re-infection of virus-free materials in the field. The possible components through which the systems could interact include: dependence of the virus on the arthropod vector for transmission, pathogen effect due to its presence and replication in the vector, pathogen and vector competition for limiting resources, and pathogen and vector potential to induce host defense mechanisms hence affecting each other indirectly through the response of the plant [10].
There have only been limited studies looking at different aspects of vector epidemiology of sweetpotato viruses. Byamukama et al., studied the spread of sweetpotato virus disease within crop and the population dynamics of its whitefly and aphid vectors and found that both vectors were present all around the crop as far away as 100m [11]. Whiteflies were caught close to the canopy while not many aphids were found on the sweetpotato plants. More information is needed to understand at what stage vectors start invading the crop after planting, the population dynamics, and to what extent infestation is influenced by surrounding vegetation (likely host) so appropriate management practices can be derived.
The aim of this study was to generate information on timing of aphid and whitefly vectors infestation and population density in virus-free sweetpotato ‘Beauregard’ observation plots at the National Agriculture Research Institute (NARI) Momase Regional Centre (MRC), Bubia research field.
Materials and Methods
Trial site
Field study was conducted at NARI, MRC Bubia located 11km by road North West of Lae at latitude of 6° 40Ë? 10.9”S and longitude of 146° 54Ë? 40.6”E and an altitude of 35 m above sea level (masl). The climate is tropical, with average annual minimum and maximum temperatures, at 21.8°C and 30.9°C, respectively. Mean annual rainfall of the year (2015) is 3016 mm, however for the trial duration was between the month of March and June where the average rainfall is 240 mm [12].
Source and establishment of virus-free plant material
Virus-free planting materials of Beauregard cv. were obtained from an insect proof screen house at MRC, Bubia which was initially generated from tissue culture plantlets obtained from the Dr. Ghodake Biotechnology Laboratory NARI. Healthy grown plantlets each were de-flasked, washed and planted in egg trays containing sterilized top soil mixed with sand and placed inside a humidity chamber to be hardened. With constant temperature between 27- 30ºC for four weeks, 99% of the plants survived with vigorous growth. The successful plants were then transferred onto prepared pots of sterilized top soil of similar mix and placed inside the screen house for further growth. A month later the plants were mass propagated using the nodal propagation technique inside a 2.5 m x 1.5 m cage seedbed. This was obtained by single or double node cut and planted from mother stocks. The plants were routinely managed with adequate watering and monitoring of insect pests such as aphids and whiteflies with the use of yellow sticky traps.
Field planting and maintenance
After 3-4 weeks the healthy grown vines were cut and transferred for field planting in 2 separate plots measuring 16m x 18m with 1m spacing between mounds. The plots were approximately 200m apart with different soil types (clay loam and courser materials) and surrounded by different crops. The land areas were harrowed and marked using a 50 meter tape, a total of 288 mounds were prepared at each plot. At each of the mounds single tips of healthy cuttings were planted. Both plots were planted at the same time (23rd of March, 2015). One week after planting, urea fertilizer at a rate of 5 grams/ per mound was applied to boost plant growth. Weeds were managed manually at 2 weeks interval for 6 weeks after planting and at 3 weeks intervals for the remaining 7 weeks until harvest.
Virus vector (Aphid and whitefly) sampling
Numbers of aphids and whiteflies (adults only) were sampled using the Binomial Sampling Method referenced from Southwood [13]. The sampling started at 3 Weeks After Planting (WAP) and continued once every week until harvesting at 12 WAP with 9 samplings done in total excluding the last week of harvest. Sampling took place between 7:00 am and 9:00 am. The data were recorded on an excel spreadsheet based on a recommendation from the University of California IPM website [14]. During the sampling, virus symptoms were also observed and recorded.
Statistical analysis
Statistical analysis was carried out using basic Microsoft Excel 2010. Data on the average population counts of the vectors over sampling periods were subjected to regression analysis to observe the population distribution throughout the growing season.
Analysis of results using Geographic Information System (GIS)
GIS tools were used to map the presence, intensity and distribution of sweetpotato virus vectors in each trial plots. The GIS Software used in this mapping and analysis was Quantum GIS Brighton 2.6.1.
A hand-held eTrex HcX Vister GPS (Global Positioning System) was used to mark boundary points of each of the plots (A & B). A note book was used to record the location in which tracks and waypoints were taken and compare once data was transferred into the software. Waypoints of each sweetpotato mound were captured, however only the waypoints of the 30 plants sampled per plot were used for analysis.
The GPS data collected were downloaded into QGIS via the GPS Tools. GPS files were then converted to shape files that are compatible in QGIS. A disease vector layer was created for each plot. Irrelevant tables were deleted and additional fields for aphids and whitefly numbers were added into the attribute table. Data on virus vector figures for aphids and whiteflies were entered into the new field.
The Interpolation Plugin in QGIS 2.6.1 Brighton was used to show the presence, intensity and distribution of aphids and whitefly in both, plot A and plot B. Surface interpolation was used to estimate the values in between each location based on location specific data. The interpolation method used was the Inverse Distance Weighting (IDW) where the further the surface gets from a points value, the less similar it becomes. IDW was used as the limiting factor but in line with binomial sampling method as it allowed for only 30 samples (sweetpotato mounds). This interpolation showed the intensity of the presence of aphids and whiteflies in both plots, from which direction the incursion of the vector was coming from (likely hosts) and also showed estimates for the other points (sweetpotato mounds) not sampled.
Results
Vector distribution and likely-host
The map below (Figure 1) shows trial plot ‘A’ (centred) and the surrounding plots of different crops distinguished by various colours: purple – African yam (Dioscorea rotunda), yellow - corn (Zea mays), green - mungbeans (Vigna radiate) and brown – taro (Colocasia esculenta). The trial plot was interpolated with average population number of both vectors as shown by different colours, which distinguishes the range of population throughout the sampling periods. The dark red clustered area towards east direction indicates high populated of vectors that migrated from corn and taro plots while from the west; the vectors migrated partly from mungbeans and African yam plots.
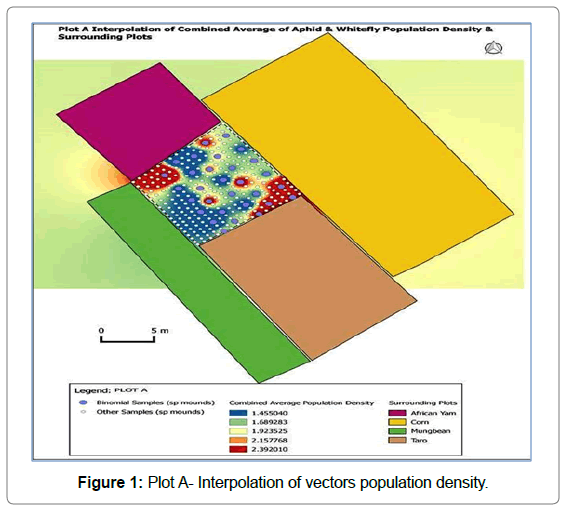
Figure 1: Plot A- Interpolation of vectors population density.
Figure 2 shows the interpolation of average population of both vectors correlated with the likely host crops/plants plotted around with different colours: brown- bushes road, pale blue-cowpea (Vigna unguiculata), light green - kunai grass (Imperata cylindrica) and purple -sweetpotato and kunai grass. The dark red clustered area towards north-east direction indicated high population of vectors migrated from cowpea plot while few from the bushes along the bush road.
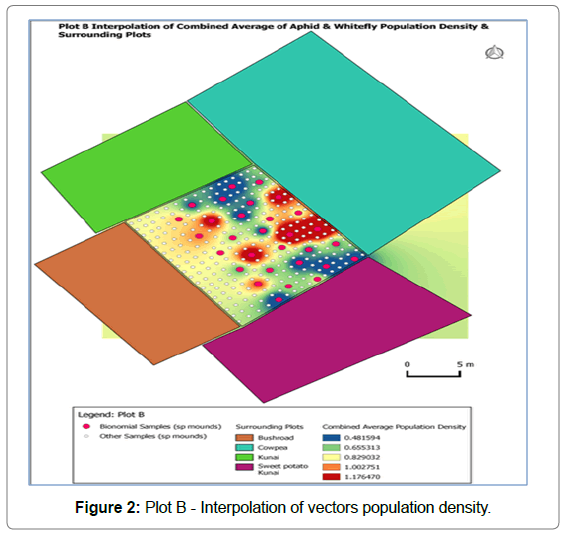
Figure 2: Plot B - Interpolation of vectors population density.
In both trial plots, the sparsely dark red coloured spots indicated the internal spread of the vectors. Some of the crops were already grown before the trial was established while some were planted later and those that were planted earlier such as corn (yellow) in Figure 1 was harvested 3 weeks after trial is established. The Figures show the statuses of vector incursion at 12 WAP.
Vector population density in each plot
At the respective plots (Figures 1 & 2), (Figures 3 & 4) show the cumulative frequency of vectors binomially sampled over 9 weeks period until harvest at 12 WAP.
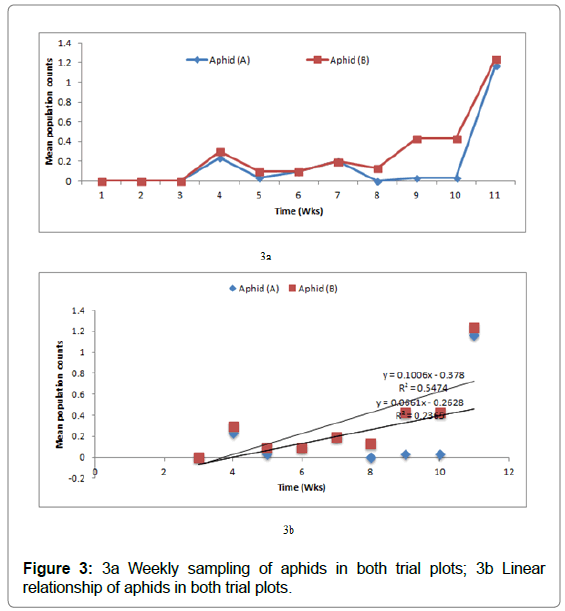
Figure 3: 3a Weekly sampling of aphids in both trial plots; 3b Linear relationship of aphids in both trial plots.
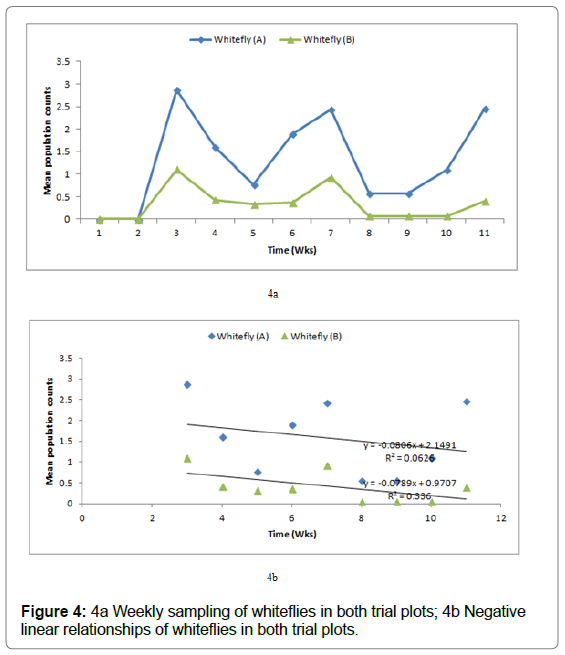
Figure 4: 4a Weekly sampling of whiteflies in both trial plots; 4b Negative linear relationships of whiteflies in both trial plots.
Mean population of adult aphids found on the sweetpotato foliage fluctuated at each week and peaked towards the harvesting periods, i.e. 10 and 11 WAP (Figure 3a). The population shows a positive linear relationship between the two plots pointing to a gradual build-up of aphid’s population over time (Figure 3b). However, the relationship is not strong as shown by the relatively low R2 values of 54 and 23%, respectively.
Figure 4a below shows the mean population of adult whiteflies per week of sampling. Whitefly population reached its peak at 3, 7 & 11 WAP in plot A whereas for plot B at 3 and 7 WAP. The population fluctuated overtime throughout the growing season at each of the trial plot. In comparison to the aphid population, the whitefly population density showed a negative linear relationship but with R2 values of only 6 and 33% in which a linear relationship cannot be supported (Figure 4b).
Vectors population relationship with the monthly rainfall
Mean number of aphids and whiteflies found on the sweetpotato foliage in both plots (Figure 5a and 5b) below showed an initial increase during the high rainfall in April then gradually decreased the following month of low rainfall and finally peaked during the increased rainfall in June. The vector population fluctuated throughout the growing season simultaneously with the rainfall periods.
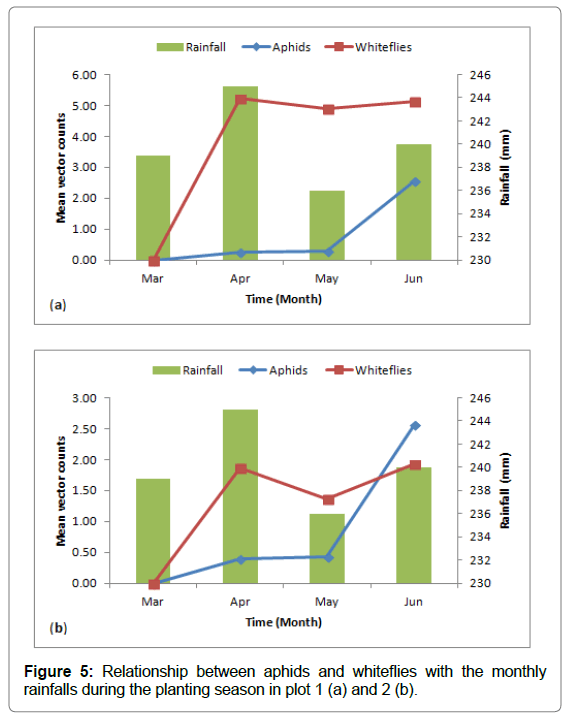
Figure 5: Relationship between aphids and whiteflies with the monthly rainfalls during the planting season in plot 1 (a) and 2 (b).
Virus-like symptoms
Sweetpotato virus-like symptoms were not commonly observed throughout the growing season in both plots. Purpling color on leaf surfaces was observed after 9 WAP and towards harvesting especially on old leaves but at minimal distribution. Generally, it was observed that at every sampling plant (30 plants at each plot), less than 30% of the total showed symptoms. This can be confused with the nutrient disorder as the leaves became older and the nutrients get mobile.
Discussion
Among other factors, vectors movement and distribution influences the rate of re-infection of virus-free materials. This study has shown that sweetpotato virus vectors (aphid and whitefly) start moving into the crop soon after the establishment of the sweetpotato plants. Incursions in particular happened from other crops growing adjacent to the sweetpotato trial plots. Taro, yam, mungbeans, cowpea, weeds (unspecified spp) etc. are all alternate hosts for both vectors, the aphid (Myzus persicae, Aphis gossypii) and whitefly (Bemisia tabaci) [15]. There was lesser migration of the vectors from corn plots into the sweetpotato plot (Fig.1). Corn is not considered a host for those species [16].
Aphids can migrate from as far as 100m afar Byamukama et al., [11] by responding to visual cues of the plant especially yellow colors because young leaves indicate a high nutritional status of the plant than old ones [17]. Whitefly search for food quite similarly but migrate depending on the flight behavior which is short-distance flights and long-distance flights [18].
As such, routine sampling clearly show presence of adult whiteflies in the plots soon after planting of sweetpotato plants while adult aphids took longer to colonize the plants. This was similarly observed by Aritua et al., [19] where aphids were rarely found colonizing sweetpotato crops from monthly monitoring at field trials in Uganda while whiteflies occur on sweetpotato throughout the year except on hot dry periods. Powell et al., stated that aphids were rarely seen colonizing sweetpotato plants due to their sap sampling/probing feeding habit i.e. sap sampling behavior involves brief probes into the epidermal cells that may last just for a few seconds to determine acceptance or rejection of a plant for feeding [20]. Nonclonizing trend of aphids in this observation can possibly presume that reinfection of aphid vectored potyviruses such as SPFMV, SPVG etc. was not spreading vigorously or at minimal rates.
Whitefly and aphid population fluctuated at different times throughout the growing season but generally peaked during high rainfall months (Figure 5). Aritua et al., [19] observed similarly for the whiteflies but Byamukama et al. found differently related to variations in the weather patterns; fewer whiteflies were trapped during the long rains than during short rains. This suggested that apart from weather many factors may have influence the vectors population dynamics such as, host plants, natural enemies, and agricultural inputs [21,22].
Vectors move into the plot but do not spread much; instead there is only buildup around initial incursion points (edges rows). This probably influenced by flight patterns; short-distance flights remain within the plant canopy where vectors first settle and travels from plant to plant within a field area and long-distance flights involve the insect being caught in an air current and drifting passively [18].
Conclusion
Within the crop canopy, where wind speeds are low, adult whiteflies mainly fly only short distances and may move in any direction. This finding is in line with the report by Blackmore and Byrne (1993) that resident populations of whitefly (B. tabaci) are found in close proximity to their hosts, and rarely need to move more than a few meters. In terms of use of virus-free materials and sweetpotato virus management, this may suggest that farmers should clear weeds around the plots and grow non-host plant species (or lesser favored hosts) as barrier which may help in reducing incursion of vectors. It is recommended that farmers should obtain planting materials for next planting season from inner plots rather than on the edges where plants are exposed to high population of vectors.
Acknowledgement
This paper is part of a cadetship programme project report submitted by the first author to National Agriculture Research Institute. The authors would like to acknowledge the NARI for the opportunity given to conduct this study and EU-ARD project for the financial support. We would also like to express our appreciation to Elick Guaf for guidance and motivation, Amanda Wandau for assistance in GIS analysis, Boney Wera and Robert Kei Geno for critically reviewing the manuscript.
References
- Bourke RM, Vlassak V (2004) Estimates of food crop production in Papua New Guinea. Land Management Group. The Australian National University, Canberra.
- M Hughes (2004) Reducing pest and disease impact on yield in selected PNG production systems. Final Project Report SMCN/2004/071. ACIAR. Canberra, Australia.
- Clark CA, Davis JA, Abad JA, Cuellar WJ, Fuentes S, et al. (2012) Sweetpotato viruses: 15 years of progress on understanding and managing complex diseases. Plant Dis 96:168-185.
- Loebenstein G (2009) Origin, distribution and economic importance. In the sweetpotato. Springer, Dordrecht.
- Loebenstein G, Fuentes S, Cohen J, Salazar LF (2003) Sweetpotato. In viruses and virus-like diseases of major crops in developing countries. Springer, Dordrecht.
- O’Sullivan JV, Amante G, Norton E, van de Fliert E, Vasquez J, Pardales (2005) Sweetpotato diag notes: A diagnostic key and information tool for sweetpotato problems. Centre for Biological Information Technology, University of Queensland, Australia.
- Zhang D, Salazar L (2000) CIP’s strategy for controlling sweetpotato virus diseases in developing countries. In: International workshop on sweetpotato cultivar decline study.
- Brunt AA, Crabtree K, Dallwitz MJ, Gibbs AJ, Watson L (1996) Viruses of tropical plants: descriptions and lists from the VIDE database. CAB International, Kew, England.
- Lamb KP (1974) New guinea aphids and their biogeographically affinities. Pac. Insects 16: 61-65.
- Belliure B, Janssen A, Maris PC, Peters D, Sabelis, MW (2005) Herbivore arthropods benefit from vectoring plant viruses. Ecol Lett 8:70-79.
- Byamukama E, Gibson RW, Aritua V, Adipala E (2004) Within-crop spread of sweet potato virus disease and the population dynamics of its whitefly and aphid vectors Crop Protect 23: 109-116.
- WorldClim Website. Major climate database compiled by the global historical climatology network (GHCN) using the SRTM (Shuttle Radar Topography Mission-NASA).
- Southwood TRE (1978) Absolute population estimates using marking techniques. Ecological Methods. Springer, Dordrecht.
- UC IPM, University of California Agriculture and Natural Resource.
- Dixon AFG (1998) Aphid ecology: An optimization approach. (2nd edtn), Chapman and Hall, London, UK.
- CABI (2015a) Myzus persicae (green peach aphid). In Invasive Species Compendium. CABI Publishing, Wallingford, UK.
- Kennedy GG, Moyer JW (1982) Aphid (Homoptera, Aphididae) transmission and separation of 2 strains of Sweet potato feathery mottle virus from sweetpotato. J Econ Entomol 75:130-133.
- Berlinger MJ (1986) Host plant resistance to Bemisia tabaci. Agric Ecosystems Environ 17: 69-82.
- Aritua VE, Byamukama T, Alicai RW, Gibson, Adipala E (1999) Epidemiological characteristics of sweetpotato virus disease in Uganda. Makerere University, Kampala Uganda.
- Powell G (2006) The effect of pre-acquisition starvation on aphid transmission of potyviruses during observed and electrically recorded stylet penetrations. Entomol Exp Appl 66:255-260.
- Riley KV, Nava-Camberos U, Allen J (1995) Population dynamics of Bemisia tabaci in agricultural systems. Bemisia: taxonomy, biology, damage, control, and management.
- Food and Agriculture Organization of the United Nations. Statistics Division. FAOSTAT.
 Spanish
  Chinese
  Russian
  German
  French
  Japanese
  Portuguese
  Hindi
Hindi 