Research Article, Arch Med Biotechnol Vol: 1 Issue: 1
3D Cell Culture to Analyze Tumor Cell Nanovesicles Role in Prostate Cancer Pathogenesis
Faria RO1, Moraes DD2, Souza AG1, Silva IBB1 and Alonso-Goulart V1*
1Laboratório de Nanobiotecnologia- Instituto de Genética e Bioquímica Uberlandia, Universidade Federal de Uberlandia - Campus Umuarama, Av. Amazonas, sn, Campus Umuarama, Uberlândia, Minas Gerais, Brazil
2Escola de Engenharia de São Carlos, Avenida Trabalhador são-carlense, Universidade de São Paulo – 400, Pq Arnold Schimidt. São Carlos, São Paulo, Brazil
*Corresponding Author : Alonso-Goulart V
Laboratório de Nanobiotecnologia- Instituto de Genética, Universidade Federal de Uberlandia-Campus Umuarama, CEP 38400-902, Brazil
Tel: +34-991950879
E-mail: alonso.goulart@ufu.br
Received: October 31, 2017 Accepted: November 23, 2017 Published: January 08, 2018
Citation: Faria RO, Moraes DD, Souza AG, Silva IBB, Alonso-Goulart V (2018) 3D Cell Culture to Analyze Tumor Cell Nanovesicles Role in Prostate Cancer Pathogenesis. Arch Med Biotechnol 1:1.
Abstract
Cancer is one of the main causes of death in developed countries and it is estimated to become the same worldwide, with prostate cancer being the fourth most common type in the world population. The study of nanovesicles, called exosomes, with approximately 50-100 nm in diameter, which have a lipid bilayer that can carry molecules such as RNA, DNA, proteins, and lipids, have been shown to play an important role in carcinogenesis. Thus, this work aimed to analyze the action of tumor cell nanovesicles on normal cells, for a better understanding of the prostate cancer pathogenesis. Therefore, nanovesicles were isolated from the supernatant of LNCaP, PC3 and RWPE-1cell lines, using ultracentrifugation methodology and characterized by scanning electron microscopy. Nanovesicles were incubated with 3D-cultured prostate epithelial cells. The expression of CD133, c-myc, Oct4 and SOX2 genes were analyzed by the qPCR technique. The results obtained proved that nanovesicles can significantly alter the expression of cancer-related genes.
Keywords: Nanovesicles; Gene expression; Prostate cancer
Introduction
Cancer is the term used for a diverse set of diseases characterized by the uncontrolled growth of cells, caused by either genetic or epigenetic disorders or both, resulting in an aberrant gene expression. Cancer is one of the leading causes of death in developed countries and is estimated to become one of the main leading causes of death in the world [1], with prostate cancer being the fourth most common cancer in the world [2].
Cancer is a multifactorial disease and difficult to diagnose, since current methods proves to be uncomfortable by patients around the world due to being invasive. Hence, other types of non-invasive and more accurate diagnosis methods are being studied; among them one of the studies includes study of nanovesicles in cell signaling. Nanovesicles are a class of extracellular membranous vesicles which are originated by an endosomal cell budding, forming a multivesicular body, which will enter in the target cell to release its contents into the cytoplasm [3] or can release their contents in the extracellular space, including free ligands which stimulate receptors on the cell surface or ligands can be on the surface of vesicles and stimulate the target cell upon binding to their receptors [4]. Most cells release nanovesicles, such as hematopoietic cells, stem cells, reticulocytes, B-and T-lymphocytes, dendritic cells, mast cells, platelets, intestinal epithelial cells, neurons and tumor cells [5], and they are naturally found in body fluids such as saliva, urine, blood, semen, breast milk, cerebrospinal fluid, and bronchoalveolar lavage [6-8].
Nanovesicles are constantly generated and released into the extracellular space, being important for communication between cells, maintaining cells morphology, and RNA, miRNA and other molecular components transportation [9]. They have shown biological activity in vivo, and they play an important role in several pathological conditions, such as cancer, infectious and neurodegenerative diseases [10]. Nanovesicles may also contribute to propagation of transformed phenotype in cells, for instance, in the capacity of tumor cells to avoid the immune system, induce angiogenesis, cell progression, invasion and tumor metastasis [11] which can be identified by the expression analysis of some genes associated with prostate cancer.
Genetic analysis is extremely important to identify the risk of prostate cancer (PCa), since it can determine related genes for diagnosis. Consequently, genetic analysis can reduce the morbidity and mortality of men, allowing a better understanding of the disease, and making its treatment safer [12]. Among several genes considered important to cancer progression, this study focuses in the following genes: c-myc (or myc) transcription factor, the transmembrane glycoprotein CD133 (prominin-1), octamer-binding transcription factor 4 (sex hormone binding transcription factor-Oct4), and sex -determining region Y-box 2 (Sex determining region Y-box 2- SOX2).
The c-myc transcription factor is considered a proto-oncogene. Expression of this gene in adults is relatively low and restricted to regenerative cells with proliferative potential. Due to its vast function in the regulatory system, c-myc also presents a potent oncogenic activity. Its overexpression contributes directly to malignant transformation in cells. Therefore, it is considered a hallmark in several types of cancers. In addition to being an initiator and progressor of the disease, c-myc is essential for tumor maintenance [13].
CD133 transmembrane glycoprotein was first identified as a specific marker for hematopoietic stem cells in humans. Actually, this marker is also used to identify and isolate subpopulations of cancer stem cells [1]. CD133+ cells have the ability to differentiate, self-renew, and they are able to develop tumors in xenotransplantes [14].
Octagene-binding transcription factor, also known as OCT3, OCT3 / 4, OCTF3 or NF-A3, presents a function of keeping stem cells in pluripotency; however the reduction of its expression can cause differentiation of stem cells and loss of pluripotency, generating differentiated cells [15]. This gene also contributes to the survival of tumor cells, being more expressed in a few differentiated tumors, conserving the cellular mechanisms of somatic cells, as observed in cancers and reprogramming of somatic cells [16]. Oct4 is considered a possible marker of malignant PCa. According to Kosaka et al. [17], high expression of Oct4 and the pathological stage of PCa are independent of high levels of PSA. Moreover, it is possible to use only expression analysis of Oct4 as an indicator for the PCa stage. Thus, tumor cells with a high level of differentiation may be related to Oct4, which may contribute to tumor progression [18].
SOX2 is a member of SOX family that encompasses transcription factors responsible for the maintenance of stem cell properties and it is related to the regulation of stem cells during the embryonic phase. Bae et al. [19] revealed that SOX2 contributes to cellular invasion of PCa, also, high expression of SOX2 predicts the progression of cancer, and low survival of patients with metastatic PCa [20].
In this way, the present study of the action of tumor cells nanovesicles on normal cells in vitro, provides a better understanding of prostate cancer pathogenesis, contributing for a better understanding on interactions between cells. Additionally, culture in 3D was used, since this technique represents a better in vivo system than 2D culture [21].
The objective of this work was to analyze the expression of c-myc, CD133, Oct-4 and SOX2 genes after the action of tumor cell nanovesicles on normal prostate cells cultured in 3D.
Material and Methods
Isolation and purification of nanovesicles derived from PC3, LNCaP and RWPE-1 cell line
PC3 and LNCaP cell line were cultivated with RPMI (Roswell Park Memorial Institute) medium, and RWPE-1 with Keratinocyte medium supplemented with 10% nanovesicles-free fetal bovine serum at 37ºC and 5% CO2. The FBS (Fetal bovine serum) were ultracentrifuged at 120000 RCF for 1 hour in order to separate the nanovesicles to use nanovesiclesfree fetal bovine serum in the cell culture. When cells reached 80% confluency the supernatant was obtained by centrifugation twice at 200 RCF for 10 minutes. After that, the supernatant was filtered and passed through a 100 nm extruder in order to eliminate cellular debris and any contamination, leaving only nanovesicles and vesicles below 100 nm. The sample was then ultracentrifuged at 120000 RCF for 1 hour in order to isolate the nanovesicles. After this procedure, the supernatant was discarded and pellet re-suspended in phosphate-buffered saline (PBS). Samples were again ultracentrifuged at 120000 RCF for 1 hour. The pellet obtained was re-suspended in 400 μl of PBS and stored at -20ºC for testing of normal prostate cells.
Characterization of nanovesicles by scanning electron microscopy (SEM)
According to Sokolova et al. [22] for scanning electron microscopy (ESEM Quanta 400 instrument; FEI), the nanovesicle instead of exosomes were fixed with 3.7% glutaraldehyde (Sigma–Aldrich GmbH, Taufkirchen, Germany) in PBS for 15 min. After washing twice with PBS, the fixed nanovesicle instead of exosomes were dehydrated with an ascending sequence of ethanol (40%, 60%, 80%, 96–98%). After evaporation of ethanol, the samples were left to dry at room temperature for 24 hours on a glass substrate, and then analysed by SEM after gold–palladium sputtering. Samples were observed on a SEM (ZEISS) at a magnification of 40.00 KX and 45.00 KX.
Culture of the cell line (RWPE-1) in 3D for the stimulus with nanovesicles
Normal prostate cells were cultured in a medium bottle (75 cm2) with Keratinocyte medium supplemented with 10% nanovesiclesfree fetal bovine serum. When cells reached 80% confluency, 400 μL (Nanoshuttles TM-PL, Nano3D Biosciences) of magnetic nanoparticles were added for interaction with cells in order to proceed to 3D culture. After 24 hours, cells were trypsinized and centrifuged, and then 1×10⁵ cells were added to each well in the 96-well plate, along with culture medium. After this procedure, a metal plate was placed below a plate with the cells, which by magnetic attraction a cellular dot was formed after 48 hours.
Stimulation of cell-derived nanovesicles of PC3, LNCaP and RWPE-1 cells on normal RWPE-1 prostate cells in 3D cell culture
RWPE-1 cell culture medium was removed and then a new culture medium was added with the isolated nanovesicles. Two volumes of the nanovesicles samples were used: 15 μL and 35 μL. The assay was conducted in triplicate.
After incubation with the nanovesicles, the supernatant was discarded and cells were trypsinized using trypsin-EDTA solution at two time intervals: 24 hours and 48 hours. Trypsin was inactivated using fetal bovine serum and cells were subjected to centrifugation at 300 × g for 5 min. The cells were re-suspended in 450 μL of trizol and stored at -80°C.
RNA extraction from normal prostate cells RWPE-1
RWPE-1 cells were subjected to total RNA extraction, using Trizol protocol. Cells were centrifuged at 12.000 RCF for 10 minutes. The supernatant from each tube was discarded and the pellets were re-suspended in 500 μL of Trizol for cell lysis. Afterwards, 100 μL of chloroform was added for two-phase formation. Then, samples were centrifuged at 12.000 RCF for 15 minutes at 4°C. The aqueous phase was transferred to another tube, 300 μl of isopropanol was added for RNA precipitation, and the samples were centrifuged at 12.000 RCF for 15 minutes. The supernatant was discarded and the pellet washed with 300 μl of 70% ethanol. Then the samples were centrifuged at 12.000 RCF for 15 minutes, the supernatant was discarded and the pellet was dried at room temperature and re-suspended with ultrapure water. The RNA was quantified using a spectrophotometer (NanoDrop® ND-1000) and stored at a temperature of -80°C.
Complementary DNA Synthesis (cDNA)
cDNA synthesis was performed from 5 μg of RNA. Total RNA was diluted in nuclease-free water, in a total volume of 20 μL. To this volume were added 0.4 μL of deoxyribonucleotide phosphates (dNTPs) mix, 0.5 μL of deoxythymidine monophosphate (oligo dT), 0.2 μL of reverse transcriptase, 4 μL of enzyme buffer and 8.65 μL of endonucleases free water. The solution was then subjected to a 37°C temperature cycle for 60 minutes in an Applied Biosystems thermal cycler. At the end of the reaction, the obtained cDNA was stored at -20°C.
Gene expression analysis by Real-time PCR (RT-Qpcr)
Gene expression analysis was performed by quantitative polymerase chain reaction (qPCR) using an Applied Biosystems 7500 Real Time PCR Systems thermal cycler. The amplification reaction was prepared according to the SYR®Green PCR Core Reagents kit containing: 5 μl of mastermix, 2 μl of injection water, 1 μl of primers for quantification of c-myc, CD133, Oct-4, SOX2 e β2M genes (Table 1) and 2 μl of cDNA for a final volume of 10 μL. The β2-microglobulin gene (β2M) was used as endogenous control. Reactions were made in triplicate.
| Gene | Forward | Reverse |
|---|---|---|
| c-myc | 5’ TGCCTCAAATTGGACTTTGG 3’ | 5’ GATTGAAATTCTGTGTAACTGC 3’ |
| CD133 | 5’ CATGTTTGGAGGATCTTGCTAGC 3’ | 5’ TTCCCGCACAGCCCC 3’ |
| Oct-4 | 5´CCTCACTTCACTGCACTGTA 3´ | 5´CAGGTTTTCTTTCCCTAGGT 3´ |
| SOX2 | 5´CCCAGCAGACTTCACATGT 3´ | 5´CCTCCCATTTCCCTCGTTTT 3´ |
| β2M | 5’ CCTGCCGTGTGAAACATG 3’ | 5’ GCGGCATCTTCAAACCTCCC 3’ |
Table 1: Sequences of forward e reverse primers for quantification of c-myc, CD133, Oct-4, SOX2 e β2M genes.
The result was expressed as Cycle Threshold (Ct) value, which refers to the number of PCR cycles required for the fluorescence signal to reach the detection threshold. The levels of expression of the genes were obtained by the ΔΔCt method, which uses the equation 1:
ΔΔCt = (CtAt - CtRt) – (CtAnt - CtRnt) Eq. (1)
According to the equation 1, CtAt is the Ct of the target gene (sample treated with nanovesicles); CtRt is the Ct of the endogenous control (sample treated with nanovesicles); CtAnt is the Ct of the target gene (sample untreated with nanovesicles); and CtRnt is the Ct of endogenous control (sample untreated with nanovesicles). The number of times the gene expression change is calculated as 2-ΔΔCT.
Statistical analysis
Prism 6.0 software was used for this statistical analysis. To perform the statistical comparison between the groups, 2Way ANOVA analysis was used with the Turkey multiple comparisons test. In all the statistical analysis a significance level of 5% was adopted, that is, the results that presented a significance probability (P) of less than 5% (P<0.05) were considered as statistically significant.
Results and Discussion
Isolation and characterization of nanovesicles
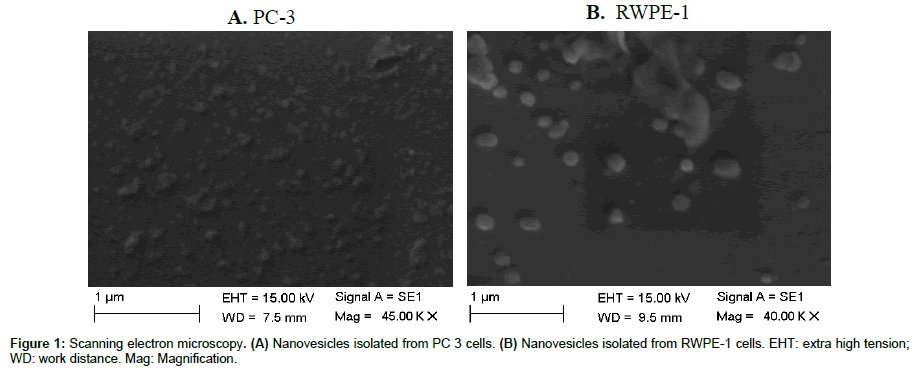
After the nanovesicles isolated from the cell supernatant, they were characterized by electron microscopy (Figure 1). It can be seen that the structures have a shape of spheres, in average sizes smaller than 150 nm, as described for nanovesicles [3,8,23].
Quantification of gene expression
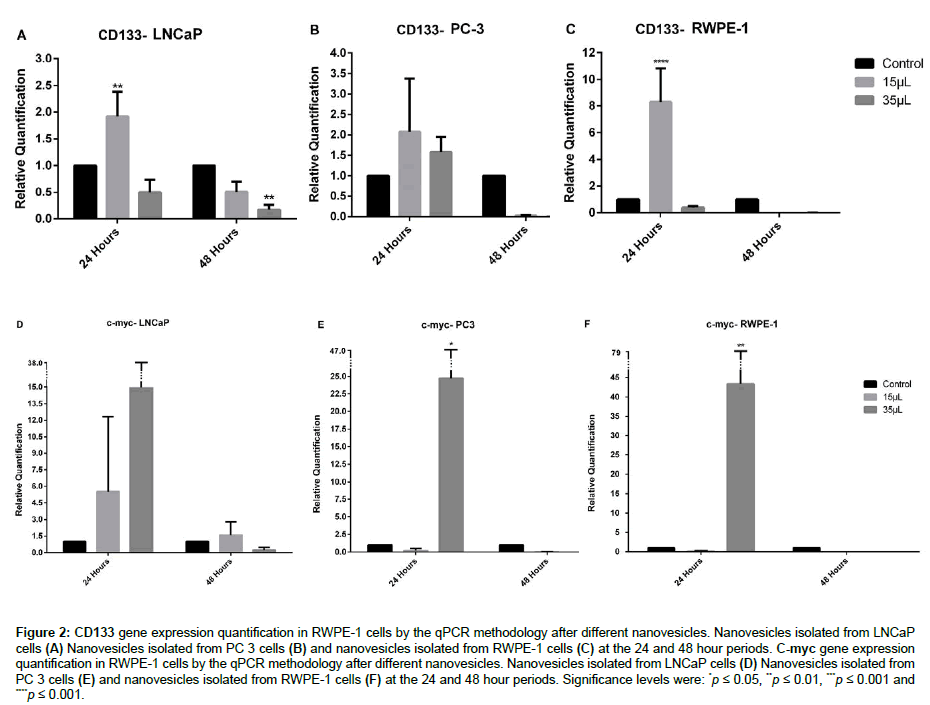
CD133 gene showed a significant relative quantification of 1.9 times greater than the control in the 24 hours period when incubated with 15 μL of LNCaP nanovesicles. There were no significant results when using PC-3 nanovesicles. Regarding RWPE-1 nanovesicles, there was a significant increase of 8.3 fold when treated with 15 μL for 24 hours (Figure 2A-2C).
Figure 2: CD133 gene expression quantification in RWPE-1 cells by the qPCR methodology after different nanovesicles. Nanovesicles isolated from LNCaP cells (A) Nanovesicles isolated from PC 3 cells (B) and nanovesicles isolated from RWPE-1 cells (C) at the 24 and 48 hour periods. C-myc gene expression quantification in RWPE-1 cells by the qPCR methodology after different nanovesicles. Nanovesicles isolated from LNCaP cells (D) Nanovesicles isolated from PC 3 cells (E) and nanovesicles isolated from RWPE-1 cells (F) at the 24 and 48 hour periods. Significance levels were: *p ≤ 0.05, **p ≤ 0.01, ***p ≤ 0.001 and ****p ≤ 0.001.
In relation to the c-myc gene, when RWPE-1 cells were incubated with the PC-3 nanovesicles, there was a significant increase of 24.8 fold in a 24 hours period with a volume of 35 μL. Therefore there were no significant results when using LNCaP nanovesicles. Moreover, the stimulus with RWPE-1 nanovesicles had a significant increase of 43.4 times, using 35 μL in the time of 24 hours (Figure 2D-2F).
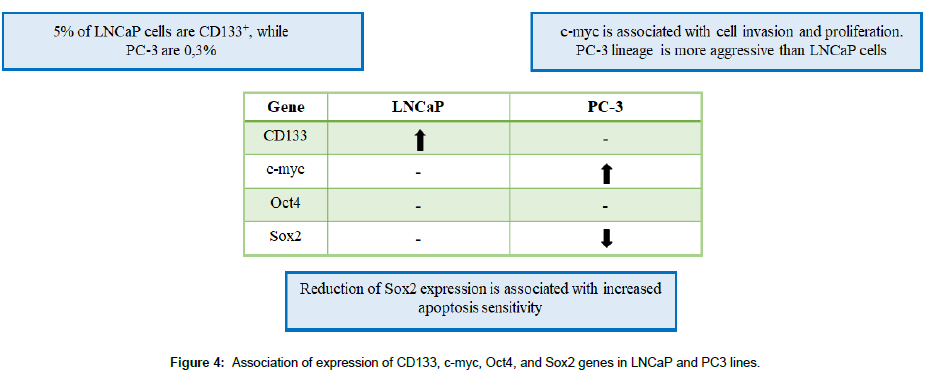
In the result presented, it can be observed that there was an increased expression of the CD133 gene with a smaller amount of LNCaP nanovesicles and there was no significant increase with PC-3 nanovesicles. LNCaP cells have a population of CD133+ cells (5%) higher than PC-3 cells (0.3%) [24,25], indicating increased expression of the CD133 gene in a 24 period with 15 μl of LNCaP nanovesicles. Moreover it is important to emphasize that PC-3 lineage is considered more aggressive when compared to LNCaP in relation to invasion and proliferation capacity. CD133 gene is not associated with invasive capacity and CD133+ cells have a low proliferation rate [26], which is in agreement with the results obtained in relation to the high gene expression of CD133 in cells with LNCaP nanovesicles and lower expression in PC-3.
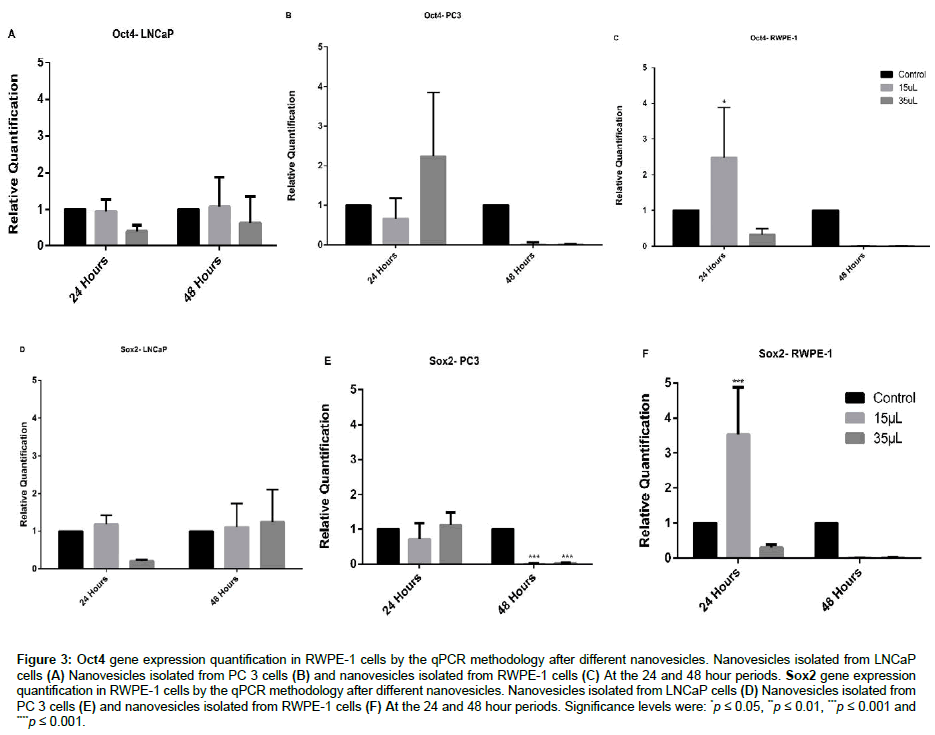
Expression of Oct4 gene after stimulation with PC-3 and LNCaP tumor cells nanovesicles in normal prostate cells showed no significant difference. On the stimulus with normal cells nanovesicles (RWPE-1), Oct4 gene expression increased with 15 μL in 24 hours (Figures 3A-3C). As Oct4 gene has the main function of maintaining cells pluripotency [27], the decrease in expression may result in cell differentiation [15], consequently increasing the tumor cells.
Figure 3: Oct4 gene expression quantification in RWPE-1 cells by the qPCR methodology after different nanovesicles. Nanovesicles isolated from LNCaP cells (A) Nanovesicles isolated from PC 3 cells (B) and nanovesicles isolated from RWPE-1 cells (C) At the 24 and 48 hour periods. Sox2 gene expression quantification in RWPE-1 cells by the qPCR methodology after different nanovesicles. Nanovesicles isolated from LNCaP cells (D) Nanovesicles isolated from PC 3 cells (E) and nanovesicles isolated from RWPE-1 cells (F) At the 24 and 48 hour periods. Significance levels were: *p ≤ 0.05, **p ≤ 0.01, ***p ≤ 0.001 and ****p ≤ 0.001.
Incubation with LNCaP nanovesicles in normal cells of the prostate did not present significant statistical difference in the expression of SOX2 gene (Figure 3D). This gene is essential for the maintenance of pluripotency, cell renewal and prevention of cell differentiation [25,28]. The expression of SOX2 is involved in the S phase of the cell cycle, promoting cell development [29]. As shown in Figure 3E, it was possible to observe a significant statistical difference in the reduction of SOX2 gene expression after stimulation by PC-3 nanovesicles. An interesting observation is that suppression of the SOX2 gene increases the sensitivity to apoptosis in prostate cancer cells and in vivo [29]. Our results showed a gene suppression of SOX2 in the time of 48 hours after stimulation (PC-3 nanovesicles) suggesting an increase in the sensitivity to apoptosis and maintenance of the process of tumor progression.
The fact that RWPE-1 nanovesicles stimulation in RWPE-1 had increased gene expression on the different genes analyzed can be explained by the hypothesis that cells are more sensitive to their own nanovesicles (Figure 3F). This is due to the lipid layer composition of the nanovesicles, which is extremely important in cellular interaction. Moreover, similarity between nanovesicles membrane receptors and RWPE-1 cells, may had led the incubated cells to absorb a greater amount of nanovesicles, when compared to the other strains [30], resulting in the observed changes. This was also confirmed by An et al. [31] and Borges et al. [32] who described an easy way of access of the nanovesicles to their cell of origin, generating a rapid response (Figure 4).
Conclusion
The action of tumor cell nanovesicles (PC-3 and LNCaP) altered the expression of CD133, c-myc, Oct4 and SOX2 genes, demonstrating a possible participation of these nanovesicles in the pathogenesis of prostate cancer. Additionally, they can be used as biomarkers for early detection of prostate cancer, but more research is still needed on this issue.
Conflicts of Interest
The authors declare no conflicts of interest.
Acknowledgements
Capes, CNPq, FAPEMIG.
References
- Li Z (2013) CD133: A stem cell biomarker and beyond. Exp Hematol Oncol 2: 17.
- Instituto Nacional de Câncer- INCA (2016) Brazil.
- Lane RE, Korbie D, Anderson W, Vaidyanathan R, Trau M (2015) Analysis of exosome purification methods using a model liposome system and tunable-resistive pulse sensing. Sci Rep 5: 7639.
- Maas SL, Breakefield XO, Weaver AM (2017) Extracellular vesicles: unique intercellular delivery vehicles. Trends Cell Biol 27: 172-188.
- Greening DW, Gopal SK, Xu R, Simpson RJ, Chen W (2015) Exosomes and their roles in immune regulation and cancer. Semin Cell Dev Biol 40: 72-81.
- Bobrie A, Colombo M, Raposo G, Théry C (2011) Exosome secretion: molecular mechanisms and roles in immune responses. Traffic 12: 1659-1668.
- Street JM, Barran PE, Mackay CL, Weidt S, Balmforth C, et al. (2012) Identification and proteomic profiling of exosomes in human cerebrospinal fluid. J Transl Med 10: 5.
- Théry C, Amigorena S, Raposo G, Clayton A (2006) Isolation and characterization of exosomes from cell culture supernatants. Curr Protoc Cell Biol 3: 1-29.
- Hood JL, Pan H, Lanza, GM, Wickline SA (2009) Paracrine induction of endothelium by tumor exosomes. Lab Invest 89: 1317-1328.
- Avci E, Balci-Peynircioğlu B (2016) An overview of exosomes: from biology to emerging roles in immune response. Acta Medica 5: 2-10.
- Silva TA (2015) AHNAK regulates the formation and exchange of extracellular vesicles between breast tumor cells and fibroblasts. J Chem Inf Model 11: 9472-9477.
- Dantas, EL, Lima Sá FH, Carvalho S, Arruda A, Ribeiro E, et al. (2009) Genética do Câncer Hereditário. Revista Brasileira de Cancerologia 55: 263-269.
- Kress TR, Sabò A, Amati B (2015) MYC: connecting selective transcriptional control to global RNA production. Nat Rev Cancer 15: 593-607.
- Irollo E, Pirozzi G (2013) CD133: To be or not to be, is this the real question? Am J Transl Res 5: 563-581.
- Lopes JR (2016) Evaluation of the action of melatonin on ER-positive breast tumor cells treated with estrogenic disruptors: verification of the estrogen receptor pathway mediated by the OCT 4 gene. IBILCE 52: 41Z
- Zeineddine D, Hammoud AA, Mortada M, Boeuf H (2014) The Oct4 protein : more than a magic stemness marker. Am J Stem Cells 3: 74-82.
- Kosaka T, Mikami S, Yoshimine S, Miyazaki Y, Daimon T, et al. (2016) The prognostic significance of OCT4 expression in patients with prostate cancer. Hum Pathol 51: 1-8.
- Kumar SM, Liu S, Lu H, Zhang H, Zhang PJ ,et al. (2012) Acquired cancer stem cell phenotypes through Oct4-mediated dedifferentiation. Oncogene 31: 4898-4911.
- Bae K, Dai Y, Vieweg J, Siemann DW (2016) Hypoxia regulates SOX2 expression to promote prostate cancer cell invasion and sphere formation. Am J Cancer Res 6: 1078-1088.
- Carrasco-Garcia E, Santos JC, Garcia I, Brianti M, García-Puga, et al.(2016) Paradoxical role of SOX2 in gastric cancer. Am J Cancer Res 6: 701-713.
- Edmondson R, Broglie JJ, Adcock AF,Yang L (2014) Three-dimensional cell culture systems and their applications in drug discovery and cell-based biosensors. Assay Drug Dev Technol 12: 207-218.
- Sokolova V, Ludwig AK, Hornung S, Rotan O, Horn PA ,et al.(2011) Characterisation of exosomes derived from human cells by nanoparticle tracking analysis and scanning electron microscopy. Colloids Surf B Biointerfaces 87: 146-150.
- Buzas EI, György B, Nagy G, Falus A,Gay S (2014) Emerging role of extracellular vesicles in inflammatory diseases. Nat Rev Rheumatol 10: 356-364.
- Guo Y, Liu S, Wang P, Zhao S, Wang F, et al. (2011) Expression profile of embryonic stem cell-associated genes Oct4, Sox2 and Nanog in human gliomas. Histopathology 59: 763-775.
- Kregel S, Kiriluk KJ, Rosen AM, Cai Y, Reyes EE, et al. (2013) Sox2 is an androgen receptor-repressed gene that promotes castration-resistant prostate cancer. PLoS One 8: e53701
- Steinmetz NF, Maurer J, Sheng H, Bensussan A, Maricic I, et al. (2011) Two domains of vimentin are expressed on the surface of lymph node, bone and brain metastatic prostate cancer lines along with the putative stem cell marker proteins CD44 and CD133. Cancers 3: 2870-2885.
- Vega-Crespo A, Truong B, Hermann KJ, Awe JP, Chang KM, et al. (2016) Investigating the functionality of an OCT4-short response element in human induced pluripotent stem cells. Mol Ther Methods Clin Dev 3: 16050.
- Sodja E, Rijavec M, Koren A, Sadikov A, Korošec P, et al.(2015) The prognostic value of whole blood SOX2, NANOG and OCT4 mRNA expression in advanced small-cell lung cancer. Radiol Oncol 50: 188-196.
- Jia X, Li X, Xu Y, Zhang S, Mou W, et al. (2011) SOX2 promotes tumorigenesis and increases the anti-apoptotic property of human prostate cancer cell. J Mol Cell Biol 3: 230-238.
- Ristorcelli E, Beraud E, Mathieu S, Lombardo D, Verine A (2009) Essential role of Notch signaling in apoptosis of human pancreatic tumoral cells mediated by exosomal nanoparticles. Int J Cancer 125: 1016-1026.
- An T, Qin S, Xu Y, Tang Y, Huang Y, et al. (2015) Exosomes serve as tumour markers for personalized diagnostics owing to their important role in cancer metastasis. J Extracell Vesicles 4: 27522.
- Borges FT, Melo SA, Ozdemir BC, Kato N, Revuelta I, et al. (2013) TGF- 1-containing exosomes from injured epithelial cells activate fibroblasts to initiate tissue regenerative responses and fibrosis. J Am Soc Nephrol 24: 385-392.
 Spanish
  Chinese
  Russian
  German
  French
  Japanese
  Portuguese
  Hindi
Hindi 