Spanish
  Chinese
  Russian
  German
  French
  Japanese
  Portuguese
  Hindi
Hindi Research Article, J Phys Res Appl Vol: 1 Issue: 1
3D Seismic Heterogeneity Characterization for Karst, Fault and Fold Imaging: Statistical Approach
Chesnokov EM1*, Bayuk IO2 and Tiwary DK3
Department of Forestry and Biodiversity, Tripura University, Suryamaninagar, Agartala, India
*Corresponding Author : Evgeni M Chesnokov
Earth and Atmospheric Science Department, University of Houston, USA
Tel: (713) 743-2579
E-mail: emchesno@central.uh.edu
Received: September 25, 2017 Accepted: October 20, 2017 Published: October 25, 2017
Citation: Chesnokov EM, Bayuk IO, Tiwary DK (2017) 3D Seismic Heterogeneity Characterization for Karst, Fault and Fold Imaging: Statistical Approach. J Phys Res Appl 1:1.
Abstract
The effective elastic properties C of a random heterogeneous medium can be presented in terms of average value C and the fluctuation C . In such medium, the amplitude of spatial correlation function will have non-zero value because the inclusions and matrix will have different elastic properties of. The higher contrast between the inclusions and host rock, the higher will be the amplitude of the spatial correlation function, and viceversa. The heterogeneities having smaller and larger slowness are characterized by positive and negative normalized fluctuation, respectively. Theoretical modeling results, based on normalized fluctuation of traveltime slowness, to detect seismic heterogeneities in 3D random media is shown. We have used the radius of the spatial correlation function to calculate the extension of the inclusion in X-, Y- and Z-direction to demarcate the shape of heterogeneity. Upscaling of the physical properties of the medium is performed to calibrate the result to the seismic frequency range by changing the averaging window size. The properties of the medium inside the averaging window are assumed statistically homogeneous. Results obtained from this method show that as the size of the sliding window decreases the resolution of the heterogeneity increases.
Keywords: Seismic heterogeneity; Intrinsic attenuation; Seismic amplitude
Introduction
Intrinsic attenuation and scattering are the two main causes of the seismic attenuation. In an attenuating medium, scattering and intrinsic attenuation affect differently depending upon the size of the heterogeneity and the wavelength of the propagating wave and therefore, a medium becomes frequency dependent. The traveltime of seismic wave will be the reflection of the medium through which the wave has traveled. In a heterogeneous medium, each seismic trace is supposedly unique because it travels through unique path and reflects the characteristics of the medium through that path. The information of the medium imbedded in the seismic traces can be deconvolved as seismic attributes which can be used for reservoir characterization.
During the last five decade, exploration geophysicists have come up with more than fifty seismic attributes which have been applied to reservoir characterization. Bahorich and Farmer [1] analyzed the similarity of the adjacent waveforms in inline and crossline direction. They used cross correlation technique on adjacent traces to compute coherence coefficient from the seismic amplitude, and any changes in the nature of the traces was attributed to the seismic heterogeneity or discontinuity. Three traces cross correlation algorithm was modified with the introduction of semblance and eigendecomposition based coherence estimate [2-4]. Another well-known seismic attributes to delineate seismic heterogeneity is spectral decomposition which uses short-window Fourier transform to compare seismic waveform to precomputed waveform [5,6]. Seismic attributes analysis is based upon the concept to find: why the nature of one seismic trace is different than others and finding out geological and geophysical reasons which may have attributed to these differences.
Velocities and their attenuation are two fundamental properties of the wave propagation that provide information about the saturation and structure of in situ rocks [7]. In a random heterogeneous media where size of the heterogeneity exceeds the wavelength of the seismic wave, scattering attenuation becomes more pronounced [8]. The seismic velocity changes are generally related to the physical properties of the reservoir rocks, such as lithology, differential pressure, temperature, fluid saturation, fluid viscosity, frequency and fluid mobility [9-15]. The influence of frequency on the seismic wave propagation in elastic media and porous media is studied by Mukerji and Mavko [16] and Vikhorev et al. [17], respectively.
We have used statistical approach to characterize heterogeneous reservoir using the concept of normalized fluctuation; and the radius and amplitude of the spatial correlation function, to delineate small and large scale heterogeneity. The question arises how the velocity should be treated in order to determine the location and size of fault or karst. In this work we suggest some characteristics derived from 3D seismic data, which are helpful in solving the problem. Application of normalized fluctuation, and correlation function amplitude and radius to detect heterogeneity is rarely available in literature.
Geological Significance
Sedimentary rocks, with few exceptions, are characterized as heterogeneous media whose physical properties changes from one point to other in space. A geologic formation is not composed by a single material but consists of a collection of different materials. Such heterogeneous composition occurs in many geological media where depositional processes that act over different characteristic time scales induce spatial patterns with different characteristic spatial scales. Commonly, a region having properties different than its adjacent region is called a heterogeneous system (Figure 1a). In sedimentary rock, lateral heterogeneities are generally related to the depositional environment. But in some cases the lateral heterogeneities might occur due to vertical throw of the faulted block across the fault plane (Figure 1b) or fault plane (Figure 1c). Heterogeneity associated with porosity, permeability, pore fluid properties, and conditions of pore pressure, temperature, and stress are generally post depositional, whereas lateral heterogeneities are caused by variations in the lithology due to facies change are syn-depositional in nature. Some other large scale post depositional heterogeneity, such as fold, fault can develop due to regional tectonics whereas development of karst is the result of dissolution of carbonate rock such as limestone and dolomite.The size of the heterogeneity can vary from less than a millimeter at grain and pore level (microscopic heterogeneity), to manykilometers at basin level (megascopic heterogeneity). Identification of the heterogeneities in sedimentary basin is an interesting task for exploration geophysicist, since the presence of strong heterogeneity often coincides with hydrocarbon occurrence.

Figure 1: Schematic presentation of heterogeneous rocks (a) syn-depositional heterogeneity with dark grey area represents inclusion inside the groundmass, (b) post-depositional lateral heterogeneity across the fault zone and (c) ) post-depositional lateral heterogeneity across the fault plane .
In heterogeneous medium, any two points in space is characterized by having different coefficients of the elastic constant. This particular characteristic of the heterogeneous media is responsible for the change in velocity field, as the sound wave travels via different path for every source receiver combination. The cross-section point of each inline and crossline is a CMP in a 3D survey and hence each CMP will give a seismic trace (Figure 2). Normalized fluctuation map constructed for depth converted seismic data shows how the lateral heterogeneity is changing with the depth. This study shows that the normalized fluctuation map, constructed for 3D seismic volume, is a powerful tool for providing comprehensive information of the lateral heterogeneity developed due to karsts and fault.
Method
Let us consider a heterogeneous body of rock in which the inclusions are characterized by different elastic properties than the groundmass. We assume that the 3D seismic data are available for the region to which this technique will be applied in terms of traveltime slownesses. However, similar technique can be applied for velocities. We divide the region into sub-regions with the size of each sub-region being large enough to calculate the statistical characteristics from the seismic data. If we calculate average slowness for each sub-region, the sub-regions containing fault or karst will have significantly different average values than the sub-regions without them. Then, we calculate fluctuations of slownesses for each point by using equation (1).
 (1)
(1)
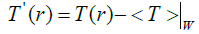
Where T ' (r) is P-wave slowness at a point, r, T ' (r) is average value of P-wave slowness over sub-region W and T ' (r) is the fluctuation in the P-wave slowness.
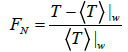
The fluctuation amplitude depends upon the difference between the P-wave slowness of the inclusion and the averaged value of P-wave slowness over the window. The higher the fluctuation amplitude, the higher will be the contrast between the inclusions and the host rocks. In order to eliminate the effect of fluctuation amplitude we calculate normalized fluctuation, where fluctuation is weighted over the average slowness  . The term ‘normalized fluctuation’, at any random point in heterogeneous media, is used to characterize the difference of elastic properties from its average property over a window.
 (2)
(2)
Where FN is the normalized fluctuation of the P-wave slowness at an arbitrary point, r.
If the compliance of the material filling fault/karst is greater than the host rock, as in the case of fluid filled fault/karst, and a large part of fault/karts is included within the averaging window, W, the averaged values of slownesses are greater compared to the subregions without such heterogeneity. In this case for the averaging window, we obtain negative values of fluctuation amplitude. The size of the averaging window is automated fashion, and depends upon the size of wavelength of the seismic waves at that depth. If the material filling fault/karst is stiffer compared to that of host rock, i.e., we have so-called, healed fault/karst, the averaged values of slowness are smaller compared to regions without fault/karst. The fluctuations at the points belonging to the fault/karst are positive.
Calculating the normalized fluctuation for the area of interest, the heterogeneous zone will be characterized by either having higher or lower values of compliance or stiffness than the surrounding materials and can be reflected in the traveltime slowness. The fluctuation of the elastic properties between heterogeneity and host rock can serve as an index for locating heterogeneities having higher or lower value of the coefficients of elasticity tensor compared to the host rock.
In order to use the normalized fluctuations as an indicator for the presence of heterogeneity, the coverage of 3D seismic volume in plan view should be greater than the size of the heterogeneity. Also, the size of heterogeneity that can be detected should not be smaller than the distance between two seismic traces (commonly 110 ft). An example of the arrangement of seismic survey for fault/karst location is shown in Figure 2.

Figure 2: Schematic 3D seismic volume showing inline and crossline arrangement. Each cross-section point of inline and crossline is represented by a seismic trace. The distance between any two consecutive traces is 110 ft. It is desirable to have a well in the area of interest for calibration.
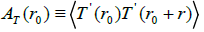
Another characteristic that can be applied to detect heterogeneity is the amplitude of spatial correlation function. According to definition, the spatial pair correlation function is specified as follows:
 (3)
(3)
Where  T represents spatial correlation function depending upon the fluctuations at points r0,r ; and
  is the correlation function amplitude, and Õ (r) is a function describing the decrease of correlations in space.
A way for calculating the 3D pair correlation functions is described in Appendix A. The correlation function amplitude is found as follows:
 (4)
(4)
Since, the correlation function amplitude is the product of fluctuations averaged over a considered volume, this characteristic indicates the places of enhanced heterogeneity more pronounced compared to the normalized fluctuation. However, this parameter gives no possibility to determine if the fault/karst is open or healed.
The size of the heterogeneity along three orthogonal axes can be estimated via calculating the radius of the spatial correlation function using equation (5) as follows:
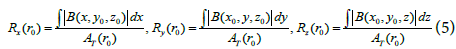
where, Rx (r0 ), Ry(r0 ), Rz(r0 )are the radii of the spatial correlation function in X, Y and Z direction, respectively.
Of course, the aforesaid statistical characteristics are specified for statistically heterogeneous media. However, their analogs formally calculated by formulas (2), (4) and (5) are useful in practice for fault/karst location, which will be demonstrated in the next section.
In order to use the characteristics developed in equations (2), (4) and (5) to identify heterogeneity, we apply a method of running window. The area for which 3D seismic data are available, we define sub-regions (3D windows) for running purpose, containing the number of nodes large enough for calculating average values (at least, greater than 7 over each coordinates). We calculate the parameters using equation (2), (4) and (5) within the current 3D window. The result is based on the value obtained at the central point of the current window, assuming that the window is statistically homogeneous and the central point value would be representative of entire window. Fixing one of the lateral coordinates, we scan our area changing another coordinate and depth to determine the length averaging 3D window along the vertical direction, we specify a frequency which corresponds to a particular wavelength for a given velocity, is calculated for the central point of current 3D window. Then, the length of averaging 3D window in vertical direction is set to be equal to the wavelength found.
Results
3D depth converted seismic volume having trace spacing 110 feet in inline and crossline direction has been analyzed as shown in Figure 2. Normalized fluctuation map of P-wave slowness (inverse of P-wave velocity) is shown (Figures 3 and 4). A layer having smaller slowness will be faster in terms of velocity, and vice-versa. Running window averaging has been applied over the whole 3D seismic volume and the results of normalized fluctuation in Y-Z plane (fixed crossline) is shown at different frequencies (Figures 3 and 4). As we change the size of the running, or averaging, window it corresponds with a particular frequency. The size of the averaging window dictates the resolution of the measurements. Smaller window size can make better detection of the small size seismic heterogeneity having different slowness, than larger window size. Positive values of the normalized fluctuation are represented by notches pointing upward corresponds to the smaller value of FN (blue color), and negative value of the normalized fluctuation are represented by notches pointing down, corresponds to the smaller value of FN (green color). 3D view having X-axis upward in the left column, and plan view of Y-Z plane in the right column is shown in Figures 3 and 4.

Figure 3: Behavior of normalized fluctuation in YZ plane having alternate layers of small (blue color) and large (green color) value of slowness. Positive and negative value of normalized fluctuation represents hard and soft lithology respectively. Figures a, b and c show the same view at different window sizes corresponding different frequencies. Figures d, e and f show the map view Y-Z plan. Decreasing the window size or increasing the frequency, increases resolution of the heterogeneity present in the medium.

Figure 4: Normalized fluctuation map of P-wave slowness (inverse of P-wave velocity).
We introduced a karst body filled with materials having low rigidity by increasing the slowness of small volume within the larger 3D volume, and calculated the normalized fluctuation (Figures 5a- 5c). We have examined the effect of changing material properties within the karst. In the first two cases, P-wave velocity of the material filled inside the karst has 10 times (say karst filled with gas), and 1.5 times (if karst filled with liquid) lower than its surrounding rock (Figures 5a and 5b). The effect of changing material properties in the karst from gas to liquid becomes evident on normalized fluctuation map by higher and lower degree of fluctuation. On the other hand, in the case of karst filled with materials having velocity 1.5 times higher (arbitrarily chosen) than its surrounding host rock shows positive normalized fluctuation (Figure 5c). We also examined the case of having syncline fold having materials properties less rigid than the surrounding rocks. The normalized fluctuation is showing negative value in fold shape (Figure 5d).

Figure 5: Detection of seismic heterogeneity in the form of karst having less rigidity materials than surrounding rocks (a and b), and high rigidity materials (c) by calculating normalized fluctuation of slowness. Large scale heterogeneity, like syncline fold filled with low rigidity materials shows negative value of normalized fluctuation (d).
Calculation of the amplitude of the spatial correlation function for 3D seismic volume can be performed using equation (4). We have calculated the amplitude of the spatial correlation function for two scenarios: 1. the fault zone shown in Figure 1b is filled by gas and 2. the fault zone is filled by brine (Figure 6). We assume that the ratio of P-wave velocity of the host rocks to gas is ~10; and the host rocks to brine ~2. The amplitude of the correlation function for the gas filled fault zone is greater than the brine filled fault zone by two order of the magnitude. As the ratio of the P-wave velocity of the host rock to the heterogeneity increase, the value of the correlation function increases (Figure 6). The amplitude of correlation function also approaches zero if the ratio of the P-wave velocity of the host rocks to the inclusion tends to zero, indicating no contrast between of physical properties between the host rocks and the inclusion.

Figure 6: The amplitude of the spatial corrlation function for two special scenarios where gas and brine represent heterogeneities: a) gas filled fault zone (Vp_host/Vp_heterogeneity=10); and b) brine filled fault zone (Vp_host/Vp_heterogeneity=2).
In order to make the correct reservoir estimation, it is imperative to have better understanding of the size and shape of the reservoir in appraisal phase. Once we have detected the heterogeneity, the next step should be to calculate the size of the heterogeneity. We measure the radius of the spatial correlation function by using equation (5) along all three axes. The size of the heterogeneity will be twice of the radius in all direction. We examined the two cases here, first by introducing symmetrical fold (Figure 7a), and second by asymmetrical fold (Figure 7b). In both the cases the ratio of the material property in terms of slowness is 1.5. The radius of the heterogeneity in the form of symmetrical fold is 75 ft which is equivalent to the extension of the heterogeneity along X and Y direction 150 ft. The radius of heterogeneity is 75 ft along X-axis and 150 ft along Y-axis, makes the extension of the fold 150 ft and 300 ft along X and Y direction.

Figure 7: Determination of shape and size of the heterogeneous body (fold in this case) based on the calculation of 3D spatial correlation function radius.(a) Shows a symmetrical fold with the extension of 150 feet in X- and Y-direction. (b) Shows an asymmetrical fold with the extension of 25 m and 50 m in X- and Y-direction.
Conclusion
We have shown a new methodology to delineate the presence of seismic heterogeneities in a sedimentary basin. We assume that heterogeneous media which can be the result of a particular depositional environment or produced by tectonic force will have different elastic constant than the host rocks. In this scenario, the heterogeneity and the host rocks will be characterized by different value of the P-wave slowness. We assume that the size of the heterogeneity should be large enough to be reflected on the seismic trace. In our case the 3D seismic volume contains a trace spacing of 110 ft. If heterogeneity occurs in between two traces and if there is no manifestation of its presence on the seismic trace, then this method will not able to detect the heterogeneity. In our case the size of the window is, generally, equal to the size of the wavelength of the propagating seismic wave. As we know the high frequency content of the data gets gradually absorbed as the seismic waves travel into subsurface rocks. Therefore, the wavelength of the seismic waves increases with the depth, and so, the size of the window. Inside the window the medium is considered to be statistically homogeneous. We can manually change the size of the window depending on the size of the heterogeneity we are interested in. The smaller the size of the window, the higher will be the resolution.
Normalized fluctuation is very sensitive physical parameter to reflect the presence of heterogeneity. Normalized fluctuation can be either positive or negative. The negative value of the normalized fluctuation signifies that the heterogeneity contains slower velocity materials, whereas the positive value of the normalized fluctuation represents faster velocity materials than the host rocks. Amplitude of spatial correlation function characterizes the level if the heterogeneity present in the medium. The higher the concentration of the inclusions present in the medium, the bigger will be the correlation function amplitude. Correlation function amplitude can be used to characterize depositional environments, as each sedimentary facies can be a manifestation of a particular depositional environment. The size of the heterogeneity can be estimated by calculating the radius of the correlation function along three orthogonal axes. Normalized fluctuation; amplitude- and radius of the spatial correlation function, calculated from 3D seismic volume, have predictive capability and can be used as a powerful tool for heterogeneous reservoir characterization.
Acknowledgement
Authors acknowledge the financial support of Devon Energy Inc. We also thank Dr. Raymon L. Brown of Oklahoma Geological Survey for many discussions.
References
- Bahorich MS, Farmer SL (1995) 3D seismic discontinuity for faults and stratigraphic features: The coherence cube: 65th SEG meeting, USA, Expanded Abstracts, pp: 93-96.
- Marfurt KJ, Kirlin RL, Farmer SL, Bahorich MS (1998) 3-D seismic attributes using a semblance-based coherency algorithm. Geophysics 63: 1150-1165.
- Marfurt K.J, Sudhaker V, Gersztenkorn A, Crawford KD, Nissen SE (1999) Coherency calculations in the presence of structural dip. Geophysics 64: 104-111.
- Gersztenkorn A, Marfurt KJ (1999) Eigen structure-based coherence computations as an aid to 3D structural and stratigraphic mapping. Geophysics 64: 1468-1479.
- Partyka G, Gridley J, Lopez J (1999) Interpretational applications of spectral decomposition in reservoir characterization. The Leading Edge 18: 353-360.
- Peyton L, Bottjer R, Partyka G (1998) Interpretation of incised valleys using new 3D seismic techniques: A case history using spectral decomposition and coherency. The Leading Edge 17: 1294-1298.
- Sharma MD (2005) Propagation of inhomogeneous plane waves in dissipative anisotropic poroelastic solids. Geophys J Int 163: 981-990.
- Mukerji T, Mavko G, Mujica D, Lucet N (1995) Scale dependent seismic velocity in heterogeneous media. Geophysics 60: 1222-1233.
- Gassmann F (1951) Über die elastizität poröser medien: Vierteljahrss-chrift der Naturforschenden Gesellschaft in Zurich 96: 1-23.
- Biot MA (1956) Theory of propagation of elastic waves in a fluid-saturated porous solid. I. Low frequency range. J Acoust Soc Am 28: 168-178
- Stoll RD (1977) Acoustic waves in ocean sediments. Geophysics 42: 715-725.
- Johnston DH, Toksoz MN, Timur A (1979) Attenuation of seismic waves in dry and saturated rocks: II. mechanism. Geophysics 44: 691-711.
- Coyner KB (1984) Effects of stress, pore pressure and pore fluids on bulk strain, velocity and permeability of rocks. PhD Thesis, Massachusetts Institute of Technology, USA.
- Nur GA (1989) Four dimensional seismology and (true) direct detection of hydrocarbons: The petrophysical basis. The Leading Edge 8: 30-36.
- Batzle ML, De-Hua H, Hofmann R (2006). Fluid mobility and frequency-dependent seismic velocity - Direct measurements. Geophysics 71: N1-N9.
- Mukerji T, Mavko G (1994) Pore fluid effects on seismic velocities in anisotropic rocks. Geophysics 59: 233-244.
- Vikhorev AA, Ammerman M, Chesnokov EM (2005) Reflection of elastic wave in the layered Biot medium. Proceedings of the 3rd Biot Conference on Poromechanics, Oklahoma, USA.