Research Article, J Clin Exp Oncol Vol: 7 Issue: 5
Circulating Levels of ADAM-10 and Soluble Standard CD44 in Patients with Hepatocellular Carcinoma: Relationship with Soluble TAM Receptors and their Ligands
Soichiro Uehara*, Yuichi Fukuzawa, Tomohiko Matuyama and Katuhiro Gotoh
Department of Gastroenteronology, Hizirigaoka Hospital, Hokkaido, Japan
*Corresponding Author : Soichiro Uehara
Department of Internal Medicine and Gastroenterology, Hizirigaoka Hospital, Hunaoka, Date, Hokkaido, Japan
Tel: +81-0142-21-5300
Fax: +81-0142-21-5301
E-mail: ootaki _ph@jikeikai.or.jp
Received: July 27, 2018 Accepted: August 17, 2018 Published: August 24, 2018
Citation: Uehara S, Fukuzawa Y, Matuyama T, Gotoh K (2018) Circulating Levels of ADAM-10 and Soluble Standard CD44 in Patients with Hepatocellular Carcinoma: Relationship with Soluble TAM Receptors and Their Ligands. J Clin Exp Oncol 7:5. doi: 10.4172/2324-9110.1000227
Abstract
Objective: The aim of the study was to examine correlations of the plasma levels of soluble (s) CD44 standard (std), and a disintegrin and metalloproteinase (ADAM) 10, with those of the soluble Tyro3, Axl, and Mer receptors (sTAMRs) and their ligands (GAS6 and PROS1) in patients with hepatocellular carcinoma (HCC), and other liver diseases.
Method: The subjects were 55 patients with HCC, 4 with fulminant hepatitis (FH), 18 with acute hepatitis (AH), 10 with chronic hepatitis (CH), 20 with liver cirrhosis\ (LC), and 20 healthy normal controls (NCs). Plasma levels of sCD44std, ADAM10, sTAMRs, GAS6, PROS1, des-γ-carboxy prothrombin (DCP), and des-γ-carboxy GAS6 were measured by enzyme-linked immunosorbent assay.
Results: The levels of sCD44std, ADAM10, sTAMRs, and Gas6 were significantly higher in HCC and other liver diseases (except CH) compared to those in NCs, but PROS1 levels in these diseases were significantly lower than those in NCs. These were significant positive correlations of sCD44std levels with ADAM10, and sMer levels in HCC and other liver diseases. SAxl was lower in stage HCC than in stage HCC, but GAS6 increased with progression of HCC stages. There was a significant positive correlation between the levels of DCP and des-γ-carboxy GAS6 in HCC. The subjects were roughly classified into three groups of HCC, inflammatory diseases, and normal controls using ratios of TAMRs and their ligands.
Conclusion: The measurement of these blood factors facilitates a unified view of HCC therapy
Keywords: TAM receptors; GAS6; PROS1; sCD44; ADAM10; Hepatocellular carcinoma
Abbreviations
ADAM 10: A disintegrin and metalloproteinase 10; PS: Phosphstidylserine; TAMRs: Tyro3, Axl, and Mer receptors; HCC: Hepatocellular carcinoma
Introduction
The cell-surface glycoprotein CD44 is implicated in many of physiological and pathological functions, and its extracellular domain is cleaved by enzymes such as a disinterring and metalloproteinase (ADAM) 10 and 17. As a result, the common form of soluble CD44 standard (sCD44std), and many CD44 variants isoforms (CD44v) with different functions are released into blood. These sCD44s are associated with signaling pathway proteins that drive tumor development and progression in many cancers [1,2].
ADAM 10 and its close relative ADAM 17 (TNF-alpha converting enzyme: TACE) have also been studied in the context of ectodomain shedding. The ADAM 10 expression level may be importance in cancer and neurodegenerative disorders, whereas ADAM 17 mainly coordinates pro- and anti-inflammatory activities during an immune response [3].
The Tyro3, Axl, and Mer receptors (TAMRs) and their ligands GAS6 and PROS1, are also widely expressed by cells of the mature immune, nervous, vascular and reproductive systems, and have important effects on hemostasis, inflammation, and cancer growth. Furthermore, these receptors are essential for NK cell functional maturation and normal expression of inhibitory and activating NK cell receptors [4].
Their ligands, the vitamin K-dependent protein GAS6 and PROS1 bind to phosphstidylserine (PS) moieties via an N-terminal γ- carboxylated glutamic acid (Gla) domain. GAS6 activity is dependent on vitamin K-mediated γ-carboxylation and abolition of γ- carboxylation of GAS6, abrogates activity toward TAM receptors [5,6]. Furthermore, γ-carboxylation facilitates Gla domain binding to calcium, which in turn allows an interaction with anionic phospholipids, such as PS. These lipids are aberrantly exposed in the tumor microenvironment and contribute to the overall immunosuppressive signals that antagonize development of local and systemic antitumor immune responses [6].
The C-termini of GAS6 and PROS1 -binds to Mer on macrophages and to Axl and Tyro3 on dendritic cells and enveloped viruses, causing intracellular phoshorylatone by kinase. GAS6 is a common ligand for all three TAMRs with different affinities, whereas Pros1 activates Tyro3 and Mer, but not Axl [5].
GAS6 has with high affinity for Axl, with a Kd in the sub-nanomolar range, whereas the affinities for Tyro3 and Mer are slightly lower. GAS6 is expressed in Kupffer cells and sinusoidal endothelial cells but not in hepatocytes, and its concentration in plasma is approximately 1000- fold lower than that of Pros1. Mouse Axl is cleaved by ADAM 10, but the shedding enzyme of human Axl is still not clear, Mer is cleaved by ADAM 17, and cleaved of Tyro3 has yet to be reported [5,9]. Thus, these soluble fragments may have regulatory functions for the GAS6/ PORS1.TAM system and CD44, as well as being markers of its state of activation. These reports collect suggest, that changes of these many factors are closely linked to the boundary grounds of hemostasis and immunity in blood circulation.
In this study, we investigated the plasma levels of sTAMRs, GAS6, PROS1, sCD44std, and ADAM 10 in patients with HCC, and other liver diseases. The results suggest that serial observation of these levels can be used to guide cancer therapy.
Material and Methods
Patient material and tissue
The study was approved by the ethics committee of Hijirigaoka Hospital and complied with the Declaration of Helsinki. A total of 107 patients were included in the study. All patients gave informed consent and all agreed to donate blood samples and allow their clinical information to be used in the study. Control samples were collected from 20 healthy staff members in our hospitals.
Compliance with ethical standards
The research involves human samples. The study was approved by the Ethics committee of Hijirigaoka Hospital.
Patients backgrounds
HCC was diagnosed by abdominal ultrasonography, abdominal computed tomography (CT), magnetic resonance imaging (MRI), abdominal angiography, and elevated serum concentrations of α- fetoprotein and des-γcarboxyprothrombin (DCP), and all our HCC cases are HBV and HCV infection cases. The pathological tumor node metastasis (TNM) stages of HCC according to Liver Cancer Study Group of Japan criteria [10,11] were stage Iin 5 (human hepatitis B virus (HBV) positive 1, human hepatitis C virus (HCV) positive 4), stage IIin 12 (HBV positive 4, HCV positive 8), stage III in 18 (HBV positive 6, HCV positive 12), and stage IV in 20 (HBV positive 14, HCV positive 6) patients.
The 18 cases of AH were all positive for human hepatitis A (HAV) antibody and were cured within 8 weeks. Diagnosis of FH was performed as described by Fujiwara et al. [12]. All 4 patients with FH fell into a hepatic coma within 1-2 weeks of onset, and all were treated with plasmapheresis, but all died with 14-21 hospital days. Diagnosis of chronic hepatitis and LC were based on clinical and biochemical evidence, and confirmed by liver biopsy, EC, and CT.
Assays for blood biochemistry
Venous blood samples were obtained at admission. Plasma samples were collected in citric acid (3.8%) and EDTA, and frozen immediately for storage at -80 until analysis. Serum liver, and kidney functions levels, HAV, HVB, and HCV antigen, blood cells and platelets were measured using routine laboratory p human hepatis B virus antigen (procedures).
Enzyme-linked immunosorbent assay (ELISA) kits were used to measure plasma levels of ADAM10 (OKEH02627, Aviva Systems Biology, San Diego, CA,USA). sCD44std (Human sCD44STD ELISA, Bio Vendor, Czech Republic). Tyro3 (Sandwich DuoSet, R & D Systems, Minneapolis, MN, USA), sAxl (Human Soluble AXL ELISA Kit, Aviscera Bioscience, Santa Clara, CA,USA), sMer (MERRTK ELISA Kit, Abnova, Taipei, Taiwan). GAS6 (sandwich Duo Set, R & D Systems), free PROS1 (Protein S Test Teijinn, Teijin Teijin Diagnostics, Osaka, Japan), and DCP (Eitest PIVKA-α kit, Sanko Junyaku Co. Tokyo, Japan). Des-γ-carboxy Gas6 plasma sampling was performed by mixing with the same volume of 1 M BaCl2 for 1 h at 37, and centrifuge at 2500 g for 10 min at 4. GAS6 levels were then determined using a sandwich Human GAS6 ELISA kit (Aviscera Bioscience).
The intra-and inter-assay coefficients of variation for sAxl, sMer, sTyro3, Gas6, fPROS1, sCD44std, and ADAM10 were 8.3% and 9.2%, 9.8% and 10.4%, 3.5 and 4.0%, 9.4.% and 7.1%, 7.4 and 8.4% , 7.7% and 6.8%, and 6.7% and 7.4%, respectively.
Statistics
Data are expressed as mean ± standard deviation. Statistical analysis was performed using Student’s t-test and the level-of significance was set at P<0.05.
Result
Plasma levels of sCD44 std and ADAM10
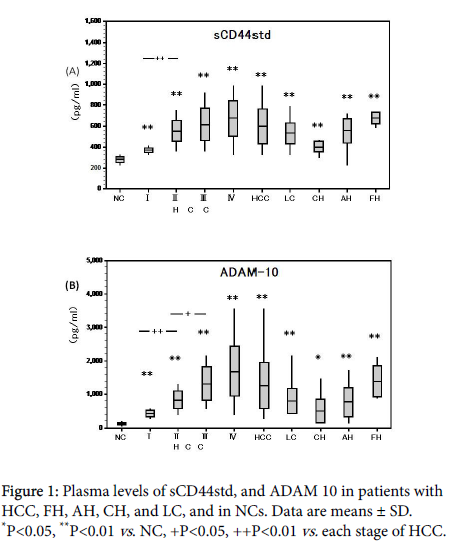
Plasma levels of sCD44std were higher in all HCC stages and in FH, AH, CH, and LC compared to NCs (370.8 ± 28.4, 554.7 ± 28.4, 616.8 ± 155.1, 671.6 ± 171.2, 677.1 ± 171.2, 556 ± 114.5, 402.0 ± 52.8, 532.1 ± 98.1 vs. 282.4 ± 29.0 ng/ml; **P<0.01).
sCD44std levels also significantly increased with progression of each HCC stage (Figure 1A).
Plasma levels of ADAM 10 were similarly higher in all HCC stages (-IV), and FH, AH, and LC compared to NCs (429 ± 106.8, 833.8 ± 274.6, 1329.0 ± 507.8, 1698.8 ± 762, 1390.6 ± 538.6, 772.4 ± 445.7, 801.1 ± 384.2 vs. 117.1 ± 37.2 pg/ml; p<0.01, ADAM 10 levels significantly increased from HCC stages I to II (P<0.01) and II to III (P<0.05), but the increase from stages III to IV was not significant (Figure 1B).
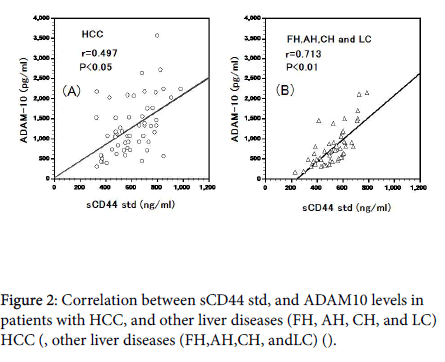
Plasma sCD44std and ADAM10 levels were significantly correlated in HCC (r=0.497, P<0.05, Figure 2A) and other liver diseases (r=0.713, P<0.01).
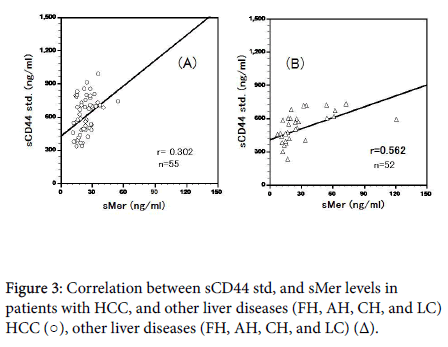
Plasma sCD44std and sMer levels were significantly correlated in HCC cases (r=0.302, P<0.05; Figure 3A) and other liver diseases (r=0.562, P<0.01; Figure 3B). ADAM10 levels were not significantly correlated with the total levels of two TAMRs (sAxl and sMer ) in cases of HCC and other liver diseases (r=0.203, r=0.226).
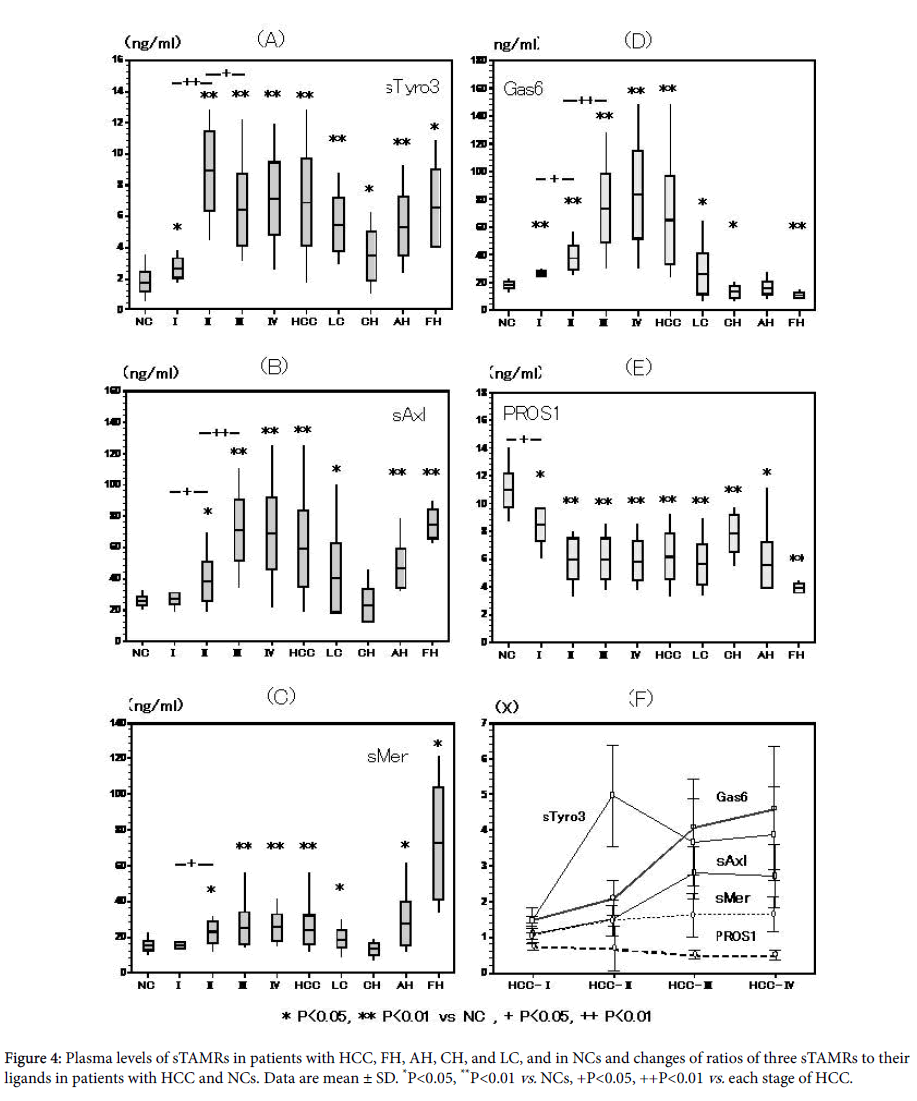
sTyro3 levels were significantly higher in patients with HCC stages I-IV, and FH,AH,CH, and LC compared with NCs ( 2.6 ± 0.7 (P<0.05), 8.9 ± 2.6, 6.4 ± 2.3, 7.1 ± 2.4, 6.6 ± 2.9, 5.3 ± 2.0, 3.4 ± 1.6 (P<0.05), 5.5 ± 1.8 vs. 1.8 ± 0.7 ng/ml; p<0.01, unless otherwise indicated). There was a significant increase in sTyro3 levels from HCC stage I to II (P<0.01), and a significant decrease from stage II to III (P<0.05).
Thus, sTyro3 levels peaked at HCC stage II, but thereafter remained at higher level than in NCs (Figure 4A).
Plasma levels of sTAMRs and their ligands
sAxl levels were significantly higher in patients with HCC stages III and IV, and AH, FH, and LC compared with NCs ( 38.4 ± 13.5, 71.2 ± 19.8, 68.7 ± 23.5, 46.6 ± 12.7, 75.1 ± 10.4 vs. 25.9 ± 3.0 ng/ml; P<0.01), but no in patients with CH (23.6 ± 11.5 ng/ml). sAxl levels in HCC stage IV were slightly lower than those in HCC III (Figure 4B).
sMer levels were significantly higher in patients with HCC stages IIIII and, IV and FH,AH, and LC (22.8 ± 6.6 (P<0.05), 25.0 ± 9.5, 25.3 ± 7.6, 72.7 ± 36.2, 27.4 ± 12.8, and 18.7 ± 4.7 (P<0.05) vs. 15.2 ± 2.8 ng/ml; P<0.01), and increased with progression of the HCC stage. sMer levels in patients with CH ( 13.2 ± 3.4 ng/ml), and LC ( 18.4 ± 4.9 ng/ml ) did not differ significantly from those in NCs (Figure 4C).
Gas6 was significantly higher in HCC stages I-IV than NCs (27.0 ± 2.0, 38.1 ± 9.3, 73.8 ± 25.1, 83.8 ± 32.1, vs. 18.2 ± 2.6 ng/ml; P<0.01), with significant increases from stages I to II (P<0.05) and II to III (P<0.01), but not from III to IV.
GAS6 levels in patients with FH(11.0 ± 2.2 ng/ml and CH(13.8 ± 4.2 ng/ml) were significantly lower than those in NCs (both P<0.01), but significantly higher in patients with LC (26.5 ± 14.8 ng/ml; P<0.05) (Figure 4D).
Free PROS1 was significantly lower in HCC stages I-IV in comparison with NCs (8.2 ± 1.7 (P<0.05), 6.1 ± 1.9, 5.9 ± 1.5, vs. 11.0 ± 1.2 ng/ml; P<0.01, unless otherwise indicated). Free PROS1 levels in patients with FH (3.9 ± 0.4ng/ml), AH (5.5 ± 1.9 ng/ml), and CH (7.8 ± 1.5 ng/ml) were also significantly lower than those in NCs (all P<0.01), but were significantly higher in patients with LC (P<0.05) (Figure 4E).
Relationships among sTAMRs and their ligands the ratio of the three sTAMRs to their ligands in HCC stages and NCs are shown in Figure 4F. The ratio of GAS6, sTyro3, and sMer increased with progression of the stage of HCC, whereas PROS1 gradually decreased. The sAxl ratios increased from stage I to stage III HCC, but slightly decreased in stage IV. Therefore, the total ratio of all 3TAMRs slightly decreased in stage IV HCC comparison with that in stage III (Figure 4F). On the other hand, the HCC with HBV cases were higher in sCD44std, ADAM10, GAS6, sAxl, and sTyro3 levels than HCC with HCV cases. However, the HCC with HBV cases were lower in sMer levels than HCC with HBV cases. Also, these differences were not significant. Furthermore, the same tendencies were shown in II, III and IV stage of HCC.
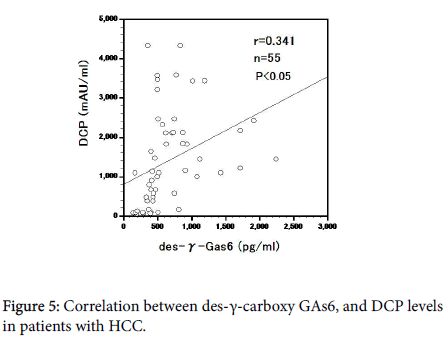
DCP and des-γ-carboxy GAS6 levels were correlated in HCC cases (r=0.581, P<0.05) and both increased with progression of HCC (Figures 5).
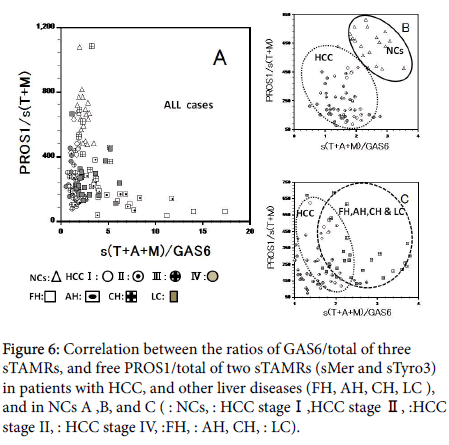
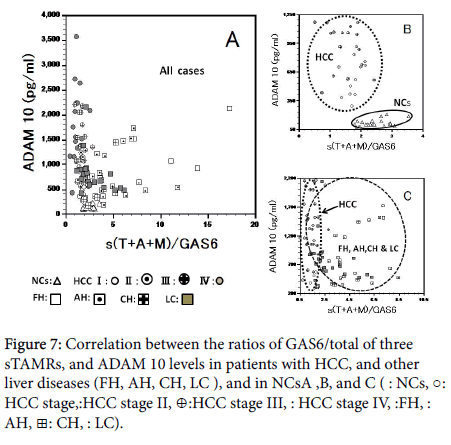
We tried a discriminant analysis (healthy controls, inflammation, and tumor) by the combination of the measurements of many markers in cases with HCC and other liver diseases. Correlation between the total sTAMRs/GAS6, and free PROS1/ total sTAMRs (sMer and sTyro3) ratio in patients, and NCs (Figure 6A) showed division of NCs from patients with HCC (Figure 6B), and patients with other liver diseases could be classified roughly into those with acute and chronic liver inflammation (Figure 6C). However, about one –third of the liver inflammation group, overlapped with patients with HCC. Correlation between ADAM 10 levels and the GAS6/ total sTAMRs ratio in patients, and NCs (Figure 7A-7C). Because sCD44std and ADAM 10 in NCs and all cases show significantly positive correlation (r=0.865, r=0.716), it seems that the correlative figure of sCD44std and total sTAMRs/GAS6 became the figure similar to Figure 7. From these, we may divide our case group into three groups clearly for three dimensions.
Figure 6: Correlation between the ratios of GAS6/total of three sTAMRs, and free PROS1/total of two sTAMRs (sMer and sTyro3) in patients with HCC, and other liver diseases (FH, AH, CH, LC ), and in NCs A ,B, and C (Δ : NCs, ○: HCC stage I,◉:HCC stage II, ⊕:HCC stage II, â—Â: HCC stage IV, â˜Â:FH, ▣: AH, ⊞: CH, ■: LC).
Figure 7: Correlation between the ratios of GAS6/total of three sTAMRs, and ADAM 10 levels in patients with HCC, and other liver diseases (FH, AH, CH, LC ), and in NCsA ,B, and C ( Δ: NCs, ○: HCC stage I, ◉:HCC stage II, ⊕:HCC stage III, â—Â: HCC stage IV, â˜Â:FH, ▣: AH, ⊞: CH, ■: LC).
Discussion
Views on hemostasis and immunity have shifted from a concept of two independent areas of biology, towards two closely related processes. In physiological and pathological blood circulation, many transmembrane proteins are processed by one or several proteolytic step to the biologically active form [1,4,13]. Extra-cellular Ca2+ influx induces CD44 ectodomain cleavage by ADAM 10 which lead to decreased amounts of soluble MHC class l-related chain molecules A (sMICA) in circulation, and provide to reduce secretion of natural killer group 2, member D (NKG2) ligands by tumors [14]. The levels of TAMRs and their ligands, the multifunctional glycoprotein CD44, and ADAM 10 have important effects in HCC and liver inflammations
CD44 has key roles in cancer stem cells (CSCs) in HCC and other cancers [15,16], and it was recently reported that ADAM 10 is strongly expressed in a large population of HCC patients, and is significantly associated with poor survival [17].
In the current study, the levels of sCD44 STD and ADAM 10 in patients with HCC were both significantly higher than in controls, and these levels increased with progression of HCC. Similarly, sCD44 STD and ADAM 10 were significantly higher in other liver diseases (FH, AH, CH, LC). The ADAM10 and sCD44std levels were correlated significantly in HCC and in the other liver diseases (FH, AH, CH and LC), but those significance of the coefficient of other liver diseases was superior to it of HCC.
This difference may be due to the amounts and types of CD44v in HCC the hepatic inflammation, and the action of ADAM17 in hepatic inflammation may be more dominant than that in HCC.
sCD44std, ADAM10, and sTAMRs levels increased markedly in patients with FH, and sMer increased more than sAxl and sTyro3 among TAMRs, while PROS1 and GAS6 decreased in these patients. Mer may be protective against acute liver injury and inflammation. In addition, the marked increase in Tyro3 may leads to a predominantly Th1 state via negative control of Th2 [18]. Liver pathological findings in FH are diffuse necrosis, hemorrhage, and thrombosis, which resemble those in triple TAM knockout, PROS1-1- and Gas6-1-mice, and these deficiencies are found in FH patients clinically [4,19]. PROS1 deficiency of our patients with liver diseasesmay be due consumption in the blood and decreased liver synthesis [20].
Administration of recombinant GAS6 restores protection against fulminant disease. At steady state, serum GAS6 levels are low, but rise markedly during acute stress or tissue injury [21]. The regulatory effect of Gas6 on cytokine production has been replicated in vitro in a surrogate Kupffer cell line, but the details of this function are unknown.
High levels of the TAMRs and exhaustion of the ligands are the characteristic of acute and fulminant liver injury [22,23]. Hepatocytes express Axl but not Mer and Tyro3, GAS6 induces phosphorylation of Akt and protects against cell death.
In response to injury, GAS6 and Mer mediate downregulation of acute inflammatory cascades, but in the context of chronic inflammation, Axl signaling results in smoldering inflammation , fibrosis, and reduced viral clearance [24].
GAS6, sAxl, sTyro3, sCD44std, and ADAM10 levels increase in parallel to chronic liver disease progression, while PROS1 decreases. Likewise, sAxl/GAS6 ratios increased in the order of FH AH, CH and LC.
Chronic liver injury is characterized by accumulation of extracellular matrix components mainly derived from activated hepatic stellate cells (HSCs). These cells secrete collagen and other extracellular matrix proteins in chronic liver disease, promoting fibrosis and cirrhotic transformation. Liver fibrosis, a critical prestage in the progression of LC, may promote a favorable microenvironment for cancer development. Furthermore, HSC play an important role in liver carcinogenesis as key modulators of fibrosis and the tumor cell microenvironment [25].
The levels of sTAMRs and their ligands in patients with HCC fluctuated as follows.
Axl increased with progression of HCC until stage III, but was then slightly lower in stage IV. These results, sugesst an initial increase of signalings of TAMRs in HCC through Axl [26]. GAS6 levels also increased with progression of HCC, and production of GAS6 by the tumor microenvironment promotes tumor progression by inhibiting, (via activation of TAM signaling), inflammatory innate responses required to activate anti-tumor cytotoxicity [27].
Furthermore, DCP and des-γ-carboxy GAS6 levels Had a significant positive correlation in patients with HCC. Ther reduced sAxl levels in HCC stage IV may be due to a decrease in Axl signaling by des-γ- carboxyGAS6 in this stage.
These increased levels of DCP and des-γ-carboxyGAS6 block TAM activation and affects blood coagulation, and may be associated with regulation of cancer metastasis via NK cells using E3 ligase Cbl-b and TAMRs, as proposed by Paolino, et al. [28]. This may explain the anticancer benefits of vitamin K antagonists as anti-TAM therapeutics. Overexpression of TAMRs in HCC, has led to several proposed therapeutic strategies to inhibit TAM ligands [29,30].
sMer levels also gradually increased with development and metastasis of HCC, and sTyro3 levels similarly increased. The activated correlations between the three sTAMRs and their ligands in plasma may have the followings consequences. While both GAS6 and PROS1 share common features of domain organization and both require γ- carboxylation for their activity as TAM ligands, they have different specificities and affinities for Tyro3, Axl, and Mer. GAS6 has a high affinity for Axl (nM) and significantly lower affinity for Tyro3 and Mer (μM), whereas PROS1 has a preference to Tyro3 and Mertk but does not activate Axl. The change of levels of sTAMRs, sTyro3 and sAxl cause thse proteins to act as antagonists that block GAS6- and PROS1- induced TAMR activation. Furthermore, sMer has weak inhibitory activities toward both ligands [4,5,31,32].
However, in the presence of externalized PS lipid vesicles, apoptotic cells, and enveloped viruses that significantly potentiate ligandinduced activation, GAS6 and PROS1 hyper-activate Mer and Tyro3, but not Axl [5,6].
Therefore, the slight increae in Mer and persistent increase in Tyro3 influence TAMRs signaling in endstages of HCC in the presence of PS. It is likely that all our HCC patients with viral infection progressed via these mechanisms. PS is required for TAM activation by GAS6, and further studies of the relationships of PS and GAS6 in cancer, including HCC are required.
We were also able to classify the subjects of this study into roughly three groups of controls, cancer patients, and those with inflammatry disease using ther atio of sTAMRs to their ligands. These correlations may help with classification of disorders in future studies of regulation of TAMRs and efferocytosis.
On the other hand, portal and venous thrombosis and embolism are risk factors for hemostasis in hepatic cancer and inflammations.
PROS1 present at significantly higher concentrations (approximately 1000 times higher), than GAS6. This difference may in part occur because PROS1 also has an important role in anticoagulation pathways, where it functions as a co-factor for Protein C during inactivation of Factors Va and VIIIa. A pathway in which TFPIα can inhibit FXa is efficiently stimulated by a combination of PS and FV short(a splice variant of FV), has aiso attracted recent attention. Deficiencies in these activities are often present in patients with hepatic diseases [20].
Indeed, PROS1 deficiency leads to enhanced deep vein thrombosis and a risk for embolism. In contrast, loss of GAS6 prevents vascular thrombosis by inhibiting platelet activation, but activates coagulation through TF [33].
Moreover, the coexistences of factors such as TFPIα, FVLeiden, and antiphospholipid antibody may accelerate thrombosis. Most factors involved in hemostasis are synthesized in the liver, and the characteristics of hemostasis in liver diseases manifest as rebalances of hemostatic fanctions with pathologic development of these disorders [20,34] DCP stimulated growth and metastasis of HCC by increasing the activity of matrix metalloproteinase (MMP)-2 and 9 through activation of the ERK1/2 MAPK signaling pathway [35]. There is also report that vitamin K inhibits growth of HCC [36]. The choice of anticancer treatment and anticoagulation for HCC therapy requires further understanding of vitamin K metabolism in HCC and other cancers. The measurements of sTAMRs, GAS6, PROS1, ADAM 10, and sCD44std in blood in the current study provide important, information for cancer therapy using hemostasis to promote immunity.
References
- Nagao O, Saya H (2004) Mechanism and biological significance of CD44 cleavage. Cancer Sci 95: 930-935.
- Falleti E, Pirisi, M, Fabris C, Botolotti N, Soarido G, et al. (1997) Circulating standard CD44 isoform in patients with liver diseases; Relashonship with other soluble adhesion molecular and evaluation of diagnostic usefulness. Clinical Biochemistry 30: 69-73.
- Mochizuki S, Okuda Y (2007) ADAMs in cancer cell proliferation and progression. Cancer Sci 98: 621-628.
- Rothlin CV, Carrera-Silva EA, Bosurgi L, Ghosh S (2015) TAM receptor signaling in immune homeostasis. Annu Rev Immunol 33: 355-391.
- Geg K, Kuimau SG, Kholodovych V, Kasikara G, Mizuno K, et al. (2018) Requirement of gamma-carboxyglutamic acid modification and phosphatidylserine binding for activation of Tyro3, Axl and Mertk receptors by growth arrest-specific 6. Front Immunol 8: 1521.
- Belzile O, Huang X, Gong J, Carlson J, Schroit AJ, et al. (2018) Antibody targeting of phosphatidylserine for the detection and immunotherapy of cancer. Immuno Targets and Therapy 7: 1-14.
- Ekman C, Stenhoff J, Dahlbäck B (2010) Gas6 is complexed to the soluble tyrosine kinase receptor Axl in human blood. J Thromb Haemost 8: 838-844.
- Budagian V, Bulanova E, Orinska Z, Duitman E, Brandt K, et al. (2005) Soluble Axl is generated by ADAM10-dependent cleavage and associates with Gas6 in mouse serum. Mol Cell Biol 25: 9324-9339.
- Black RA, Rauch CT, Kozlosky CJ, Peschon JJ, Slack JL, et al. (1997) A metalloproteinase disintegrin that releases tumor-necrosis factor-alpfa from cells. Nature 3855: 729-733.
- Kudo M, Kitano M, Sakurai T, Nishida N (2015) General rules for the clinical and pathological study of primary liver cancer, nationwide follow-up survey and clinical practice guidelines: The outstanding achievements of the liver cancer study group of Japan. Dig Dis 33: 765-770.
- Kudo M, Izumi N, Kokudo N, Matsui O, Sakamoto M, et al. (2011) Management of hepatocellular carcinoma in japan: Consensus-based clinical practice guidelines proposed by the japan Society of Hepatology (JSH) 2010 updated version. Dig Dis 29: 339-364.
- Fujiwara A, Mochida S, Matsui A, Nakayama N, Nagoshi S, et al. (2008) Fulminant hepatitis and late onset hepatic failure in Japan. Hepatology Res 38: 646-657.
- Chitadze G, Bhat J, Lettau M, Janssen O, Kabelitz D ( 2013) Generation of soluble NKG2D ligands: Proteolytic cleavage, exosome secreation and functional implications. Scand J Immunol 78: 120-129.
- Khga K, Takehara T, Tatsumi T, Miyagi T, Ishida H, et al. (2009) Anticancer chemotherapy inhibits MHC class1-related chain A ectodomain shedding by downregulating ADAM10 expression in hepatocellular carcinoma. Cancer Res 69: 8050-8057.
- Luo Y, Tan Y (2016) Prognostic value of CD44 expression in patients with hepatocellular carcinoma: meta-analysis. Cancer Cell Int 16: 47.
- Endo K, Terada T (2000) Protein expression of CD44 (standard and variant isoforms) in hepatocellular carcinoma: Relationships with tumor grade, clinicopathologic parameters, p53 expression, and patient survival. J Hepatolo 32: 78-84.
- Zhang W, Lin S, Liu K, Wang Y, Ji B, et al. (2014) A disintegrin and metalloprotease (ADAM)10 is highly expressed in hepatocellular carcinoma and is associated with tumor progression. J Int Med Res 42: 611-618.
- Chan PY, Silva EAC, DeKouchkovsky D, Joannas LD, Hao L, et al. (2016) The TAM family receptor tyrosine kinases TYRO3 is a negative regulator of type 2 immunity. Science 352: 99-103.
- van der Meer JM, van der Poll T, van’t Veer C (2014) TAM receptors, Gas6 and protein S: Roles in inflammation and hemostasis. Blood 123: 2460-2469.
- Lisman T, Porte RJ (2010) Rebalanced hemostasis in patients with liver disease: evidence and clinical consequences. Blood 116: 878-885.
- Ekman C, Linder A, Akesson P, Dahlback B (2010) Plasma concentrations of gas6 (growth arrest specific protein 6) and its soluble tyrosine kinase receptor sAxl in sepsis and systemic inflammatory response syndromes. Crit Care 14: R158.
- Licuna L, Barcena C, Bellido-Martin L, Femández L, Stefanovic M, et al. (2010) Growth arrest-specific protein 6 is hepatoprotective against ischemia/reperfusion injury. Hepatology 52: 1371-1379.
- Lafdil F, Chobert MN, Couchie D, Broillet A, Zafrani ES, et al. (2006) Induction of Gas6 protein in CCL4-induced rat liver and antiapoptotic effect on hepatic stellate cells. Hepatology 44: 228-239.
- Fourcot A, Couchie D, Chobert MN, Zafrani ES, Mavier PA, et al. (2011) Gas6 deficiency prevent liver inflammation, steatohepatitis, and fibrosis in mice. Am J Physiol 300: 1043-1053.
- Mukherjee SK, Wilhelm A, Antoniades CG (2016) TAM receptor tyrosine kinase function and the immunopathology of liver diseases. AM J Physiol Gastrointest Liver Physiol 310: 899-905.
- Dengler M, Staufer K, Huber H, Stauber R, Bantel H, et al. (2017) Soluble Axl is an accurate biomarker of cirrhosis and hepatocellular carcinoma development : results from a large scale multicenter analysis. Oncotarget 8: 46234-46248.
- Loges L, Schmidt T, Tjwa M, Geyte VK, Lievens E, et al. (2010) Malignant cells fuel tumor growth by educating infilutrating leukocytes to produce the mitogen Gas6. Blood 115: 2264-2273.
- Paolino M, Choidas A, Wallner S, Pranjic B, Uribesalgo I, et al. (2014) The E3 ligase Cbi-b and TAM receptors regulate cancer metastasis via natural killer cells. Nature 507: 508-512.
- Davra V, Kimani SG, Calianese D, Brige RB (2016) Ligand activation of TAM family receptors-implications for tumor biology and therapeutic response. Cancers 8: 107.
- Paolino M, Penninger JM (2016) The role of TAM family receptors in immune cell function : implications for cancer therapy. Cancers (Basel) 8: 97.
- Lew ED, Oh J, Burrola PB, Lax I, ZagÃÂŒrska, A, et al. (2014) Differential TAM receptor-ligand-phospholipid interactions delimit differential TAM bioactivities. ELife 3: e03385.
- Tsou WI, Nguyen KN, Calarese DA, Garforth SJ, Antes AL, et al. (2014) Receptors tyrosine kinases,Tyro3, Axl, and Mer, demonstrate distinct patterns and complex regulation of ligand-induced activation. J Biol Chem 289: 25750-25763.
- Robins RS, Lemarié CA, Laurance S, Aghourian MN, Wu J, et al. (2013) Vacular Gas6 contributes to thrombogenesis and promotes tissue factor up-regulation after injury in mice. Blood 121: 692-699.
- Lisman T, Leebeek FWG (2007) Hemostatic alterations liver disease: A review on pathophysiology, clinicalconsequences, and treatment. Dig Surg 24: 250-258.
- Zhang Y, Chu J, Cui S, Song Z, Qu X (2014) Des-γ-carboxyprothrombin (DCP) potential autologous growth factor for the development of hepatocellular carcinoma. Cell Physiol Biochem 34: 903-915.
- Otsuka M, Kato N, Shao R, Hoshida Y, Ijichi H, et al. (2004) Vitamin K2 inhibits the growth and investiveness of hepatocellular carcinoma cell via protein kinase A activation. Hepatology 40: 243-251.
 Spanish
  Chinese
  Russian
  German
  French
  Japanese
  Portuguese
  Hindi
Hindi 