Spanish
  Chinese
  Russian
  German
  French
  Japanese
  Portuguese
  Hindi
Hindi Research Article, J Electr Eng Electron Techno Vol: 12 Issue: 4
Design of an Industrial Off-Grid Photovoltaic System for the Intensive Care Unit at the University of Benin Teaching Hospital
Osasumwen Cedric Ogiesoba-Eguakun1, Muhammad Omoleme Yusuf1, Osakpamwan Samuel Oghama1, Ifeanyi Okoh1, Vincent Kenechi Abanihi2, Aliu Daniel3, Clarence Uhunoma Ogiesobaâ??Eguakun4 and Osikemekha Anthony Anani5*
1Department of Electrical and Electronic Engineering, University of Benin, Edo State, Nigeria
2Department of Electrical and Electronic Engineering, Edo State University, Uzairue, Nigeria
3Department of Computer Engineering, Edo State University, Uzairue, Nigeria
4Department of Animal Biology, Federal University of Technology, Minna, Nigeria
5Department of Biological Science, Faculty of Science, Edo State University, Uzairue, Nigeria
*Corresponding Author:
Osikemekha Anthony Anani
Department of Biological Science,
Edo State University,
Uzairue,
Nigeria;
E-mail: Osikemekha Anani
Received date: 10 April, 2023, Manuscript No. JEEET-23-94850;
Editor assigned date: 13 April, 2023, PreQC No. JEEET-23-94850 (PQ);
Reviewed date: 27 April, 2023, QC No. JEEET-23-94850;
Revised date: 19 July, 2023, Manuscript No. JEEET-23-94850 (R);
Published date: 16 August, 2023, DOI: 10.4172/2325-9838.1000956
Citation: Ogiesoba-Eguakun OC, Yusuf MO, Oghama OS, Okoh I, Abanihi VK, et al. (2023) Design of an Industrial Off-Grid Photovoltaic System for the Intensive Care Unit at the University of Benin Teaching Hospital. J Electr Eng Electron Techno 12:4.
Abstract
The world is progressively shifting away from conventional power sources based on fossil fuels and toward renewable energy sources due to the aggravation of noise, harmful fume pollution and the dreaded climate change. The primary goal of this effort was to develop an industrial standalone photovoltaic system for essential loads to increase the efficiency and dependability of the power supply in the UBTH distribution network. UBTH's electrical distribution network underwent an energy audit, and the important loads were those that had a direct influence on patients' health and were operated continuously for 24 hours. A load/energy audit was conducted on a catalog of electrical appliances to determine the energy demand in the intensive care unit, which amounted to a total of 36.02 kW and thus, was used in the design of the photovoltaic system based on known theories. Calculations were made to determine the output power required from the photovoltaic system design and thus gave rise to the calculated number of photovoltaic panels. The choice of batteries, charge controllers, multi-cluster boxes, inverters, circuit breakers and cables was made in line with the design specifications. According to the results, the intensive care unit required an average of 864.48 kWh of energy per day to run for twenty-four (24) hours a day, and 1061.06 m2 of PV space. Thus, a total of 495 photovoltaic panels were required to cater for the required energy, including a calculated amount of 240 batteries to power the ICU at nightfall. In developing nations, we advocate solar technology for organizations like hospitals in rendering essential services seamlessly, since the sun has a proud position among the renewable energy sources being used due to its ubiquity.
Keywords: Photovoltaic system, Load audit, Intensive care unit, Energy demand, Climate change
Introduction
According to the IEA report, the electricity markets faced an exceptionally high demand across the world in 2021, with power demand increasing by more than 6% as a result of strong economic expansion [1]. Wholesale power prices increased as a result of the accelerated recovery in global energy demand, which put pressure on coal and natural gas supply networks. Electricity production from coal and gas reached historic highs despite the phenomenal expansion of renewable energy. Thus, the annual carbon dioxide emissions from the electricity sector soared globally to a new record high after declining in previous years. China, the United States, and India top the 2021 global list of highest CO2 emissions due to their dense population and industrialization [2]. In 2021, Nigeria was ranked among the top five polluting countries of production-based CO2 emissions with 136,986,780 metric tons, which is the highest in comparison with that of previous years. This evidentially shows a distinctive mismatch between the demand and supply of energy for economic growth. The greenhouse gas emissions in Nigeria emanate from various sources which have energy generation as a major share of 32.6% among other sources [3].
Energy generation precedes thermal power generation for largescale power grids up to the use of fuel and diesel generators for smallscale businesses and residents. The Energy Commission of Nigeria reported that about $22 billion was spent on fueling generators each year. The punch newspaper reported that 40% of Nigerian households make use of this generator due to the epileptic nature of electric power availability across the nation. In recent times, Nigeria has the largest economy in sub-Saharan Africa is faced with the limitation of insufficiently wheeling around 4000 MW of electric power to its populace of over 195 million people, despite the country's capability of generating 12,566 MW for existing power plants. This setback has continually arisen from the general difficulties encountered by the Nigerian power industry regarding the implementation of electricity policies, regulatory uncertainties, gas supply, transmission system limitations, and significant planning flaws that have prevented the sector from being commercially viable [4].
It is quite unfortunate that the nation is persistently investing billions of naira in the production of hydroelectric and thermal power while having a huge potential to develop its solar energy that would offer a reliable power supply. The spike in diesel prices in Nigeria has relatively constituted a surge in the demand for solar power for mainly residential use due to the abundance of sunlight across the country. However, the adoption of solar power systems in Nigeria is estimated to be below 2%, as some businesses believe they are unsuited for usage on a wide scale. A great majority of Nigerians generally believe that solar energy system is fairly expensive to install and reliable. In reality, solar energy systems are upgradeable to suit their demand and they have inconsequential running costs over time after their initial high cost of installation. Furthermore, the energy added up from other renewable sources like water and wind will give less than 1% of solar energy [9]. Thus, the sun produces significantly more energy than mankind will ever use from a general perspective [5].
The adverse effect of the Nigerian epileptic power availability has paralyzed various essential services, especially in the health sector, where patients are left to bear the brunt of hospitals running skeletal services with costly healthcare charges due to the rising cost of diesel and petrol needed for their backup generator. Following a case study, the management of the university of Benin Teaching Hospital (UBTH) operates on over 30 diesel-generating units alongside public power supply, to maintain a constant electric power supply for essential services. This is due to the current state of UBTH's power supply and consumption which is hampered by an increase in downtime brought on by the high maintenance costs of the backup power supply and related technological know-how and power demand needed by new structures and equipment. Furthermore, a field study revealed various critical areas of UBTH like the Intensive Care Unit (ICU), where any power downtime cannot be tolerated as its equipment must continually operate to serve patients with a razor’s edge between life and death. The key electrical equipment needed for saving lives in the ICU at UBTH includes mechanical ventilators, patient monitors, suction machines, mobile X-ray machines, defibrillators, infusion pumps, lighting fixtures, and air conditioners [6].
Conclusively, the necessity for a safe, affordable, and reliable renewable power to supply critical loads for essential services forms the basis of this research study. Therefore, solar power is considered and proposed for the critical loads of the Intensive Care Unit in UBTH (Figure 1).

Figure 1: Block diagram of the industrial off-grid photovoltaic system design.
Figure 1 depicts the direction of DC power flow from the photovoltaic panels to a solar inverter with an integrated MPPT charge controller for optimal efficiency of the system. The solar inverter converts the input DC electric power to AC electrical energy and then fed into a multi-cluster box for smart AC distribution of off-grid system interconnections. The DC battery bank either feeds the system through its inverter or recharges from the supply in the multi-cluster box, depending on the load demand that is a function of the power flow [7].
Materials and Methods
Materials
The equipment required for the installation of the PV system includes:
• Photovoltaic panels
• Solar Inverter with an inbuilt charge controller
• Multi-cluster Box
• Battery bank
• Battery inverter and charger
The above materials will form the PV system that will be integrated into the existing public utility supply and backup diesel generators that gives electricity to the ICU.
Methods
A load assessment was conducted in the intensive care unit of UBTH and power ratings (watts) of all the electrical appliances were listed accordingly. Thereafter, the itemized result from the loaded audit was used in the calculation of the energy demand per day (watthour) as shown in Table 1. The resultant computation is then used to estimate the capacity of the PV panels, inverters, battery banks and power cables with the aid of existing theories. The battery is expected to cater to the ICU loads during off-peak periods of the PV system. The existing power utility supply and the backup diesel generator were considered as redundancy to charge the battery bank for periods of inadequate solar radiation that may occur at some point in the year. The design layout of the PV array with its land requirement was also established [8].
| Electrical appliances | Quantity | Power rating (kW) | Total load (kW) |
|---|---|---|---|
| Mechanical ventilators | 6 | 1.185 | 7.11 |
| Patient monitors (Type1) | 6 | 0.06 | 0.36 |
| Suction machine | 7 | 0.18 | 1.26 |
| HP air conditioning unit | 2 | 1.13 | 2.26 |
| Refrigerator | 4 | 0.08 | 0.32 |
| 13 amps sockets (SPARE) | 4 | 0.3 | 1.2 |
| Lighting points | 13 | 0.1 | 1.3 |
| Mobile X-ray machine | 1 | 2.4 | 2.4 |
| Patient monitors (TYPE2) | 9 | 0.06 | 0.54 |
| Defribrillators | 2 | 0.08 | 0.16 |
| Suction machine | 7 | 0.18 | 1.26 |
| Water heater | 1 | 3.5 | 3.5 |
| Hand dryer | 2 | 1.5 | 3 |
| Lighting points | 10 | 0.1 | 1 |
| 1.5 HP air conditioning unit | 6 | 1.13 | 6.78 |
| 2 HP air conditioning unit | 2 | 1.5 | 3 |
| Suction pump | 5 | 0.02 | 0.1 |
| Infusion pump | 1 | 0.01 | 0.01 |
| Washing machine | 1 | 0.46 | 0.46 |
| Total | 36.02 | ||
Table 1: The load readings in the Intensive Care Unit of UBTH.
Pv system design
Energy demand calculation: Based on the high degree of necessity, a diversity factor of 1 was adopted for all electrical appliances in the intensive care unit. Therefore, loads are expected to operate for 24 hours of which 12 hours each will be supplied by the solar panel and battery bank. Thus, the daily energy demand of the ICU is:
EICU=P × t=36.02 kW × 24 hours=864.48 kWh
Where P is the total power ratings of loads in the ICU
T is the required time of operation
Sizing of photo-voltaic panels
Number of PV panels:
The number of PV panels required is given by:
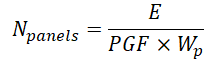
Where Npanels=Number of PV panels required
E=Energy demand from the PV panels per day in Wh
PGF=Panel Generating Factor
Wp=Peak rated power output of a unit PV panel in W
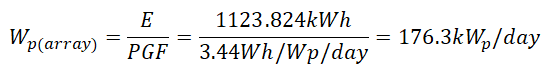
Considering 30% of total energy losses from 20% of battery and 10% of wiring connection losses, an allowance of 130% of the daily energy demand is required to size the PV panels. Thus,
E=130% × 864.48 kWh=1,123.824 kWh
The average insolation in Benin city throughout the year is 4.47 kWh/m2 per day. This is equivalent to 4.47 hours of 1000 W/m2 sunlight daily. Considering 15% loss for temperatures above 25°C, 5% loss for dirt and 5% loss for the aging of the module. The correction factor (CF) for PV panel efficiency is:
=0.85 × 0.95 × 0.95=0.77 W/Wp
Where Wp is the PV panel peak-rated output.
The Panel Generating Factor (PGF) is given as:
=Daily hours of sunlight × CF=4.47 hrs × 0.77 W/Wp=3.44 Wh/Wp
This means that an average of 3.44 Wh/day is produced during the lowest solar month. Considering the existing industrial loads in the ICU, a 660 W monocrystalline solar panel is adopted for this design (Table 2).
| Electrical data/STC* | |
| CS7N | 660 MS |
| Nominal max. power (Pmax) | 660 W |
| Opt. operating voltage (Vmp) | 38.3 V |
| Opt. operating current (Imp) | 17.24 A |
| Open circuit voltage (Voc) | 45.4 V |
| Short circuit current (Isc) | 18.47 A |
| Module efficiency | 21.2% |
| Operating temperature | 40-85°C |
| Max. system voltage | 1500 V (IEC) or 1000 V (IEC) |
| Module fire performance | Class C (IEC 61730) |
| Max. series fuse rating | 30 A |
| Application classification | Class A |
| Power tolerance | 0-10 W |
| Dimensions | 2384 × 1303 × 35 mm (93.9 × 51.3 × 1.38 in) |
| Weight | 34.4 kg (75.8 lbs) |
Note: *Under standard test conditions of irradiance of 1000 W/m rature of 25°C
Table 2: Design specification of a Canadian solar 660 W solar panel.
Therefore, the minimum number of PV panels required is given by the:

To attain an even match of the number of series and parallel configuration, 500 panels is selected for this PV design.
These panels will be shared at 100 panels per solar inverter, and each of the 5 solar inverter sets will have a 25 series × 4 parallel solar array configuration. Thus, a solar inverter will have 2 strings of individual 25 series × 2 parallel configurations.
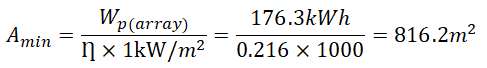
Area of PV array space
In sizing the PV array area, the array peak watt is calculated as:
Selecting 21.6% efficiency (Ƞ) of a 660 W monocrystalline PV panel the minimum PV array area required is:
Considering a factor of 130% for working space, the total PV array area for this design is:
A=1.3 × 816.2 m2=1061.06 m2
Inter-row spacing of PV array
The PV inter-row spacing is calculated from the diagram depicted in Figure 2. The shaded diagonal lines represent two adjacent solar panels with L-module length and W-module width. Variable X, Y and Z are distances in meters [9].
Considering the dimension of a typical 660 w solar panel of 2.4 m length and 1.3 m width [20], the land requirement needed for the PV array space can be calculated below:

Figure 2: The geometrical relationship between the angles and modules.
The distance of X is calculated as:
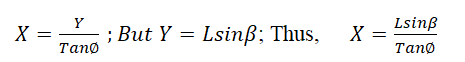
Where β is the tilt angle and ϕ is the altitude angle.
For optimal efficiency of the solar panel, β should vary between 30° to 45°. Therefore, an average tilt angle of 38° is adopted for this design. ϕ varies from 10° to 80° with a corresponding horizontal spacing of X.
Since Y=L sinβ=1.48 m
Thus, the average value of the corresponding X is computed as illustrated in Table 3.
| Altitude angle | X(m) |
|---|---|
| 10 | 8.37 |
| 20 | 4.06 |
| 30 | 2.56 |
| 40 | 1.76 |
| 50 | 1.23 |
| 60 | 0.85 |
| 70 | 0.54 |
| 80 | 0.26 |
| Average X value | 2.45 |
Table 3: The altitude angle and the horizontal spacing of the modules.
This implies that the corresponding average value of X is 2.45 m.
But Z=Lcosβ=1.89 m
Therefore, the spacing of adjacent modules R is X+Z=4.34 m.
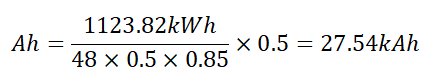
Sizing of the battery capacity
Considering a 2 V/3000 Ah battery cell for this design with a 50% Depth of Discharge (DOD), 15% battery loss allowance and 12 hours day of autonomy, the battery bank capacity is:
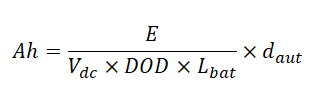
Where Ah is the battery capacity
DOD is the Depth of Discharge
Vdc is the system's DC voltage
Lbat is the battery loss
daut is the days of autonomy
Therefore, the number of batteries in series Bseries is:

Where Vbat is the unit battery voltage
The number of batteries in parallel Bparallel is:

Where Ahbat is the battery cell capacity
Hence the battery configuration will be 24 series × 10 parallel=240 batteries
Sizing of the inverters
Battery inverter size: The inverter size should be 130% of the total wattage of the industrial loads. This 30% allowance is called the safety factor. Therefore,
The inverter size=1.3 × P
Battery inverter size=1.3 × 36.02=46.826 kW
This calculated battery inverter size will be shared amongst 2 sets of five 6 kW Sunny Island battery inverters with inbuilt DC chargers. Each set of five 6 kW Sunny Island battery inverters will accommodate an arrangement of a 24 series × 5 parallel battery bank from section [10].
Solar inverter size
For the Solar inverter, the total load demand Esinv will be the sum of the loads in the ICU (P) and the battery load after discharge. But the battery load is equivalent to P and thus,
Esinv=2P=2 × 36.02 kW=72.04 kW
Solar inverter size=1.3 × 72.04=93.652 kW
This calculated solar inverter size will be divided among five 20 kW Sunny Tri power solar inverters with each having 25 × 4 solar array configurations.
A 20 kW solar inverter will make use of 2 inbuilt MPPT charge controllers of 2 strings each.
Sizing of the charge controller
A safety factor of 1.25 is necessary for calculating the capacity of the charge controller.

Where SF is the Safety factor and Vsdc is the solar array voltage.
The solar array voltage is calculated as;
Vsdc=Nseries × Vmpp=25 × 38.3=957.5 V
Where Nseries is the number of solar panels connected in series, and
Vmpp is the maximum power point voltage of a unit solar panel.
Therefore, the charge controller rating is:
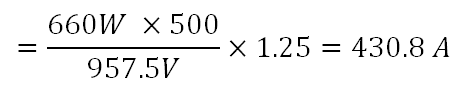
This implies that the inbuilt MPPT charge controllers of the Solar inverters should cumulatively withstand the rated current of 431 A.
Thus, since 5 sets of solar inverters with each having 2 in-built MPPT charge controllers, each solar inverter can handle 86.2 A. Thus, each MPPT charge controller with 2 strings can handle 43.1 A (22 A per string) [11].
Results and Discussion
Multi-cluster box for sunny island
The multi-cluster box increases the power of the AC main distribution unit for Sunny Island systems by 20%. This allows offgrid and hybrid systems in the power ranges of 20 to 300 kW to be implemented even more cost-effectively. To simplify installation as shown in Figure 3 all multi-cluster Boxes are completely wired and fitted at the factory and have a main connector for generators, load distribution, and PV or wind turbine systems. All data cables required for the installation are included in the delivery. With the Multi-cluster solution for Sunny Island, complex energy supply solutions are easy to implement [12].

Figure 3: SMA Multi-cluster box arrangement in a distribution network.
Cable sizing
The choice of the power cable is a function of its current carrying capacity for equipment in need of electric power. It is also worth of note that the permissible voltage drop of the cable should be less than 2.5% of the equipment connected to it. This voltage drop is dependent on the short-circuit current and length of the cable for both AC and DC loads as shown in Table 4. These same principles apply to both single and three-phase systems. Copper cables are most preferable for PV installations due to their high current carrying capacity with lesser density [13].
| Conductor | Reference conduit method A of in thermally Table 4D2A insulating wall (enclosed in etc.) | |||
|---|---|---|---|---|
| 1 two-core cable, with or without protective conductor single phase Ac or DC | 1 three-core or 1 four-core with or without protective conductor three phase AC | |||
| C.S.A. (mm2) | Current carrying capacity (A) | Voltage drop (mV/A/m) | Current carrying capacity (A) | Voltage drop (mV/A/m) |
| 1.0 | 11 | 44 | 10 | 38 |
| 1.5 | 14 | 29 | 13 | 25 |
| 2.5 | 18.5 | 18 | 17.5 | 15 |
| 4 | 25 | 11 | 23 | 9.5 |
| 6 | 32 | 7.3 | 29 | 6.4 |
| 10 | 43 | 4.4 | 39 | 3.8 |
| 16 | 57 | 2.8 | 52 | 2.4 |
| 25 | 75 | 1.75a, 1.75d | 68 | 1.50 |
| 35 | 92 | 1.25a, 1.25d | 83 | 1.10 |
| 50 | 110 | 0.94a, 0.93d | 99 | 0.81 |
| 70 | 139 | 0.65a, 0.63d | 125 | 0.57 |
| 95 | 167 | 0.50a, 0.46d | 150 | 0.43 |
| 120 | 192 | 0.41a, 0.36d | 172 | 0.35 |
| 150 | 219 | 0.34a, 0.29d | 196 | 0.29 |
| 185 | 248 | 0.29a, 0.23d | 223 | 0.25 |
| 240 | 291 | 0.24a, 0.18d | 261 | 0.21 |
| 300 | 334 | 0.21a, 0.145d | 298 | 0.185 |
| 400 | - | 0.185a, 0.105d | - | 0.160 |
Table 4: Cable gauge chart.
The fundamental principles for the cable type calculations required for this design are as follows:
Solar panel cable sizing:
The DC passing through each terminal of the solar panel Idc gives:
Idc=Nparallel × Isc
Where Nparallel is the number of parallel connections of the solar panel
Isc is the short circuit current of a unit solar panel
Idc=2 × 18.47 A=36.94A
The voltage drop per ampere-meter of the DC cable is selected from its corresponding current value of I ≥ Idc in the cable gauge chart of Figure 3 Thus, the voltage drop of cable over a measured distance gives:
Vdrop=Idc × l × Vdam
Where l is the length of the cable, and
Vdam is the voltage drop per ampere-meter in milli-volt (mV)
Considering a 25 m cable length, Vdrop = 36.94 × 25 × 4.4 × 10-3=4.0634 V
The voltage of the solar array is:
Vsdc = 957.5 V
2.5% of 957.5 V=23.93 V
Since Vdrop<2.5% of Vsdc, 10 mm2 cable is selected.
Battery cable sizing
The DC passing through the battery terminals gives:
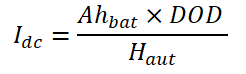
Where Ahbat is the Ampere-hour rating of the battery cell
DOD is the depth of discharge of the battery
Haut is the hours of autonomy of the battery bank
There are 2 sets of five 6kW Sunny Island battery inverters and thus, each set will accommodate a DC of 286.875 A. This means that the DC passing through each of the 5 battery inverters is 57.37 A.
The voltage drop of cable over 10 m gives:
Vdrop=57.37 A × 10 × 1.75 × 10-3=1 V
The voltage of the battery bank is also calculated as follows:
Vbank=Bseries × Vbat
Where Bseries is the number of battery cells connected in series, and
Vbat is the rated battery cell voltage
Vbank=24 × 2=48 V
2.5% of 48 V=1.2
Therefore, if Vdrop<2.5% of Vbank, a 25 mm2 cable is chosen.
Inverter to ac load cable sizing:
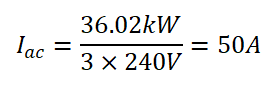
The AC passing through the inverter terminals gives:
Where P is the total wattage of AC loads and
Vph is the nominal phase voltage, and Vph is taken as 240 V.
The voltage drop per ampere meter of the DC cable is selected from its corresponding current value of I ≥ Iac in the cable gauge chart. Thus, the voltage drop of a 35 m cable length gives:
Vdrop=Iac × l × Vdam=50 × 35 × 2.8 ×10-3=4.9 V
2.5% of 240 V is 6 V
Since Vdrop<2.5% of Vph, 16 mm2 is selected.
Circuit breaker/fuse sizing
The rating of the circuit breaker or fuse is calculated as 125% of the cable’s ampacity. The provision is made for the protection of the device against overload and short-circuit.
Thus, the size of the circuit breaker required for each string of the PV array is:
PV Circuit Breaker rating=125% × ISC=1.25 × 18.47 A=23.09 A.
Therefore, a circuit breaker rating of 24 A.
Since there are 2 parallel connections in a string of PV array, then the circuit breaker ratings for the parallel combination will be 2 × 24 A=48 A
The main parameters accompanied by their related formulae and values used in the off-grid PV design are summarized in Table 5.
| Parameter | Formula | Values |
|---|---|---|
| Daily energy demand | P × t | 864.48 kWh |
| Number of PV panels required |  |
495 panels |
| Total PV array area | 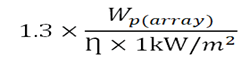 |
1061.06 m2 |
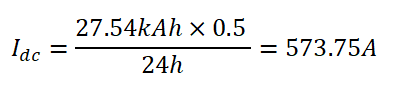
| Battery bank capacity | 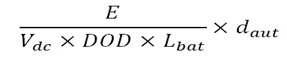 |
27.54 kAh |
| Number of batteries required | Bseries × Bparallel | 240 batteries |
| Battery inverter size | 1.3 × P | 46.826 kW |
| Solar inverter size | 1.3 × 2P | 93.652 kW |
| Charge controllers’ capacity rating | 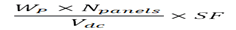 |
430.8 A |
| PV circuit breaker rating | 125% × ISC | 24 A |
Table 5: Result parameters used in the off-grid design for the ICU at UBTH.
The design of an off-grid PV system to power critical loads in the intensive care unit at UBTH started with conducting a load audit of electrical appliances used daily. A total load of 36.02 kW was added up after the audit was carried out. This load summation was then used to compute the daily energy demand of 864.48 kWh required to put the ICU into full operation continuously. The calculated total energy demand served as an important parameter to evaluate the size of major components for the PV design. Thus, the resultant values of these PV design requirements were 500 solar panels, 1061.06 m2 of PV array area with 4.34 m spacing between adjacent modules, 240 2 V/3000 Ah batteries, 2 sets of five 6 kW Sunny Island battery inverters with inbuilt DC chargers, five 20 kW Sunny Tripower solar inverter with inbuilt MPPT charge controllers, a multi-cluster box, 10 mm2 solar cables, 25 mm2 battery cables, 16 mm2 inverter cables and 48 A solar circuit breakers rating. Finally, it is worth noting that this design will be able to stand the test of time based on the quality of the components used.
Conclusion
In conclusion, Nigerian hospitals offer essential services that are key to saving lives and thus they must evolve to fit the societal needs in Nigeria. These medical needs cannot rely on the present deplorable state of electricity and the rising cost of diesel for generators in Nigeria. Thus, it has become obvious for the hospital to source the best available and clean electric power alternative for effective and reliable continuous operation. The paper has proposed an industrial self-sustained design of a PV system that is capable of satisfying medical needs for over a period of 25 years with minimal maintenance culture. This PV design will drastically reduce the use of public power utilities and diesel generators, which gives a significant increase in savings for the organization. The PV design can be adapted for any industrial load with the same theories that govern its calculations. Conclusively, the PV system created exceeds the requirements of its design and achieves the main fundamental desired goal of this work.
Acknowledgment
The authors of this work appreciate the management of UBTH for facilitating the fundamental data collection required for this design. Special thanks to the department of electrical/electronic engineering of the university of Benin, Nigeria and electrical/electronic engineering, faculty of engineering, Edo State university, Uzairue, Nigeria for accessibility to important resource materials for this research to be made possible.
References
- Abdin Z, Webb CJ, Gray EM (2015) Solar hydrogen hybrid energy systems for off-grid electricity supply: A critical review. Ren Sustain Energy Rev 52: 1791-1808.
- Amupolo A, Nambundunga S, Chowdhury DS, Grun G (2022) Techno-economic feasibility of off-grid renewable energy electrification schemes: A case study of an informal settlement in Namibia. Energies 15: 4235.
- Hagumimana N, Zheng J, Asemota GNO, Niyonteze JDD, Nsengiyumva W, et al. (2021) Concentrated solar power and photovoltaic systems: A new approach to boost sustainable energy for all (Se4all) in Rwanda. Int J Photoenergy 12: 1-32.
- Bhattacharyya SC, Palit D (2021) A critical review of literature on the nexus between central grid and off-grid solutions for expanding access to electricity in Sub-Saharan Africa and South Asia. Ren Sustain Energy Rev 141:110792.
- Thirunavukkarasu M, Sawle Y (2022) An examination of the techno-economic viability of hybrid grid-integrated and stand-alone generation systems for an Indian tea plant. Front Energy Res 10: 806870.
- Oyedepo SO (2014) Towards achieving energy for sustainable development in Nigeria. Ren Sustain Energy Rev 34: 255-272.
- Aliyu AK, Modu B, Tan CW (2018) A review of renewable energy development in Africa: A focus in South Africa, Egypt and Nigeria. Ren Sustain Energy Rev 81: 2502-2518.
- Antonanzas-Torres F, Antonanzas J, Blanco-Fernandez J (2021) State-of-the-art of mini grids for rural electrification in West Africa. Energies 14: 990.
- Dada JO (2014) Towards understanding the benefits and challenges of smart/micro-grid for electricity supply system in Nigeria. Ren Sustain Energy Rev 38: 1003-1014.
- Mills E (2016) Identifying and reducing the health and safety impacts of fuel-based lighting. Energy Sustain Dev 30: 39-50.
- Amuzu-Sefordzi B, Martinus K, Tschakert P, Wills R (2018) Disruptive innovations and decentralized renewable energy systems in Africa: A socio-technical review. Energy Res Soc Sci 46: 140-154.
- Shaaban M, Petinrin JO (2014) Renewable energy potentials in Nigeria: Meeting rural energy needs. Ren Sustain Energy Rev 29: 72-84.
- Ani VA (2016) Design of a stand-alone photovoltaic model for home lightings and clean environment. Front Energy Res 3: 54.