Spanish
  Chinese
  Russian
  German
  French
  Japanese
  Portuguese
  Hindi
Hindi Research Article, Res J Opt Photonics Vol: 1 Issue: 1
Euclidian Distance Method for Optimizing Linearly Chirped Fiber Bragg Grating Apodization Profile
Ahmad Fauzi Abas*, Yosef Taher Aladadi and Mohammed Thamer Alresheedi
Department of Electrical Engineering, College of Engineering, King Saud University, Riyadh 11421, Saudi Arabia
*Corresponding Author : Ahmad Fauzi Abas
Department of Electrical Engineering, College of Engineering, King Saud University, Riyadh 11421, Saudi Arabia
Tel: +966114670586
E-mail: aabas@ksu.edu.sa
Received: November 20, 2017 Accepted: November 21, 2017 Published: November 27, 2017
Citation: Abas AF, Aladadi YT, Alresheedi MT (2017) Euclidian Distance Method for Optimizing Linearly Chirped Fiber Bragg Grating Apodization Profile. Res J Opt Photonics 1:1.
Abstract
In this paper, we use Euclidian distance method to solve the tradeoff between Group delay Ripple (GDR) and Full Width Half Maximum (FWHM) Bandwidth. This method determines the optimum point by maximizing FWHM spectral bandwidth and minimizing GDR based on the value of sharpness parameters α and β. Three different apodization profiles were used to evaluate this method. The study shows that the best α and β is 16 and 2.25 respectively. The apodization profile that was optimized the most by this method is Tanh
Keywords: Euclidean distance method; Optimization; Apodization profile; Linearly chirped apodized fiber Bragg gratings; Dispersion; Compensation
Introduction
Chromatic dispersion (CD) issues are very important to be dealt with in today high speed optical fiber transmission system, either in conventional S-, C-, and L-band, or the future 2000 nm long-band [1-7]. CD occurs because different wavelength components of the carrier signal propagate with different velocities [8]. One of the solutions to combat chromatic dispersion is by using apodized chirped fiber Bragg grating (CFBG) based Chromatic Dispersion Compensator (CDC). This technique is very efficient and practical. It maintains allfiber network concept and at the same time operates at much lower insertion loss than the conventional Dispersion Compensating Fiber (DCF). CD compensation needs for large bandwidth; however, the bandwidth of CFBG is limited. It depends on the suppression of ripple in the profile, which is achieved at the cost of operating bandwidth. As a result, optimum performance cannot be achieved. Until today, several optimization techniques have been tested namely apodization window roll-off rate, asymptotic side lobe (SL) decay level, number of SLs, and average SL level (SLav) [9]. Discrete inverse scattering algorithm (DISA) was used to obtain the optimized long period gratings (LPG) apodization profiles [10].
This work is the continuation of work done by Aladadi et al. [11,12]. An optimized apodization profile was formulated by solving the coupled mode equation of CDC structure. Subsequent work was presented by Aladadi et al. [11] where three apodization profiles were evaluated to find the best profiles to be used in developing the CDC. In this paper, Euclidean distance method is used to optimize the apodization profile. This method maximizes the Full Wave Half Maximum (FWHM) spectral bandwidth (BW) and minimizes the group delay ripple (GDR). Three different apodization profiles were used in evaluating this optimization method.
Apodization Profile
Three different apodization profiles were used in this work, namely Tanh, Exponential and Hamming. Figure 1 shows the effect of apodization process to the FWHM spectral BW and GDR. From the Figure 1, it is obvious that when the GDR is eliminated, the signal experiences huge BW loss, which is referred as BW filtering effect. This is a serious issue due to unoptimized apodization profile. This issue is very important to be solved because the signal distortion that is caused by the BW filtering effect will results in bits errors, and shortens the maximum achievable transmission distance.

Figure 1: Reflectivity and corresponding group delay using apodized and unapodized profile.
In this work, the following apodization profiles were used.
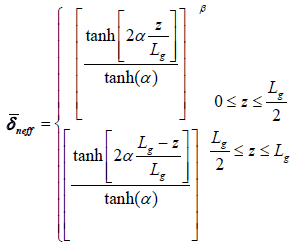
Tanh apodization profile,
 (1)
(1)
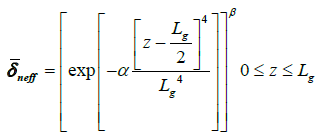
Exponential apodization profile,
 (2)
(2)
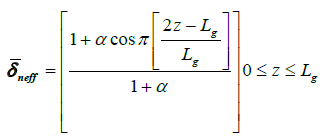
Hamming apodization profile,
 (3)
(3)
Where ![]() is the refractive index change. α and β are the sharpness parameters that were used to control the shape of the reflectivity spectra and group delay ripple, and Lg is the grating length. The role of α and β on the apodization profiles is to control the profile sharpness. This role can be seen in Figures 2-4 which evaluate the value of
is the refractive index change. α and β are the sharpness parameters that were used to control the shape of the reflectivity spectra and group delay ripple, and Lg is the grating length. The role of α and β on the apodization profiles is to control the profile sharpness. This role can be seen in Figures 2-4 which evaluate the value of ![]() against the normalized grating length with several values of α and β. In the previous studies, the best value of α and β has never been reported, which shows the importance of our work.
against the normalized grating length with several values of α and β. In the previous studies, the best value of α and β has never been reported, which shows the importance of our work.

Figure 2: Tanh apodization profile with different sharpness parameters.

Figure 3: Exponential apodization profile with different sharpness parameters.

Figure 4: Hamming apodization profile with different sharpness parameters.
From Figure 2 (Tanh), we noticed that for different combination of α and β, the normalize grating length that produces maximum performance is different. For example, when α=2 and β=5, the maximum performance can be achieved at z/Lg=0.5. However, when α=5 and β=1, the maximum performance can be achieved not only at one value of z/Lg, but from z/Lg=0.35 to z/Lg=0.65. This can give us more flexibility in the design as we know that we have a range of grating length that can be used.
Similar characteristic can be observed for Exponential (Figure 3) and Hamming (Figure 4) apodization profiles. Between the three apodization profiles, the response differs. For example, the range of z/Lg that produces maximum performance for Exponential and Hamming is smaller in comparison to Tanh.
Euclidian Distance Method
Euclidean distance method analyses the normalized GDR and normalized FWHM spectral BW as shown in Equation 4 and Equation 5 [11,12].
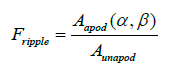 (4)
(4)
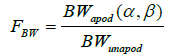 (5)
(5)
Where Aapod and Aunapod represent the amplitude of apodized and unapodized group delay ripple. BWapod and BWunapod represent the FWHM spectral BW of apodized and unapodized reflectivity spectrum.
From the relationship between Fripple and FBW, the Euclidian distance is derived, which is shown in Equation 6.
![]() (6)
(6)
To visualized the effect of α and β to the GDR and FWHM BW, the corresponding reflectivity and group delay at three different values of α were plotted with β=2.25. Figures 5-7 show the reflectivity and corresponding GDR for Tanh apodization profile at α=1, 40 and 16 respectively. Figure 5 shows when α=1, GDR is minimized but at the same time the FWHM BW is very narrow. In contrast, when large value of α was used huge GDR can be witnessed but with large FWHM BW. Based on these observations, it can be understood that trade-off between GDR and FWHM BW needs to be formulated. In Figure 7, the partially optimized apodization profile is shown when both GDR and FWHM BW are at tolerated values.

Figure 5: Reflectivity and corresponding group delay for Tanh apodization profile in case α=1 and β=2.25.

Figure 6: Reflectivity and corresponding group delay for Tanh apodization profile in case α=40 and β=2.25.

Figure 7: Reflectivity and corresponding group delay for tanh apodization profile in case α=16 and β=2.25.
Based on Equation (6), the optimum point of α is obtained at the minimum value of d, denoted as dmin. Figures 8-10 show the values of d at different value of α and β for different apodization profile.

Figure 8: Euclidian distance, d, versus sharpness parameter, α, for tanh apodization profile.

Figure 9: Euclidian distance, d, versus sharpness parameter, α, for exponential apodization profile.

Figure 10: Euclidian distance, d versus sharpness parameter, α for hamming apodization profile.
The values of dmin for Tanh, Exponential and Hamming profiles are 0.123, 0.283 and 0.257 respectively. These results are recorded at α=16 and β=2.25 for Tanh, α=66.67 and β=0.5 for Exponential, and α=1 and β=0.333 for Hamming profile.
The Euclidean distance was measured as follows. First, we fix β to 2.25, 0.5 and 0.333 for Tanh, Exponential and Hamming respectively. Next, by varying α, we plotted Fripple against FBW.
Figure 11 shows the relationship between FBW and Fripple for Tanh, Exponential and Hamming where the distance from the right bottom corner (FBW=1, Fripple=0) to any point in the curve is the Euclidean distance. From the Figure 11, it can be seen that the minimum Euclidian distance is at FBW=0.937 and Fripple=0.105 for Tanh, FBW=0.768 and Fripple=0.163 for Exponential, and FB=0.771 and Fripple=0.119 for Hamming apodization profile. From the results, it is clear that the best apodization profile is Tanh, while the best α and β is 16 and 2.25 respectively.

Figure 11: Fripple versus FBW, where the minimum Euclidian distance for Tanh, Exponential and Hamming is shown.
Conclusions
The optimization of apodization profile using Minimum Euclidean Distance method was formulated and tested. This method allows for accurate optimization of GDR and FWHM BW of the CDC. Our results also show that among the tested apodization profiles, Tanh was optimized the most by this new technique. The output of this paper is very important to the CD research and industry as it highlights an alternative solution to simplify the optimization process of CFBGbased CD Compensator.
Acknowledgment
The authors would like to extend their sincere appreciation to the Deanship of Scientific Research at King Saud University for supporting this work through RG-1437-008 Research Group Fund.
References
- Cho KY, Takushima Y, Chung YC (2010) Enhanced chromatic dispersion tolerance of 11 Gbit/s RSOA-based WDM PON using 4-ary PAM signal. Electron Lett 46: 1510-1512.
- Spolitis S, Ivanovs G (2011) Extending the reach of DWDM-PON access network using chromatic dispersion compensation. Communication Technologies Workshop (Swe-CTW), IEEE Swedish
- Zhao J, Ellis A (2012) Transmission of 4-ASK optical fast OFDM with chromatic dispersion compensation. IEEE Photon Techno Lett 24: 34-36
- Qian D, Shao Y, Hu J, Wang T, Ip E, et al. (2012) High capacity/spectral efficiency 101.7-Tb/s WDM transmission using PDM-128QAM-OFDM over 165-km SSMF within C-and L-bands. J Lightwave Technol 30: 1540-1548.
- Lyngsø J, Mangan BJ, Jakobsen C, Roberts PJ (2009) 7-cell core hollow-core photonic crystal fibers with low loss in the spectral region around 2 μm. Opt Express 17: 23468 -23473.
- Russell PSJ (2006) Photonic-crystal fibers. J Lightwave Technol 24: 4729-4749.
- Poletti F, Fokoua ERN, Petrovich MN, Wheeler NV, Baddela KN, et al. (2012) Hollow core photonic bandgap fibers for telecommunications: opportunities and potential issues. J Opt Soc Am
- Abramczyk H (2005) Dispersion phenomena in optical fibers. Laboratory of Laser Molecular Spectroscopy,Technical University of Lodz, Poland.
- Mohammed NA, Ali TA, Aly MH (2013) Performance optimization of apodized FBG-based temperature sensors in single and quasi-distributed DWDM systems with new and different apodization profiles. AIP Advances 3: 122125.
- Ashrafi R, Asghari MH, Azana J (2011) Ultrafast optical arbitrary-order differentiators based on apodized long-period gratings. IEEE Photon J 3: 353-364.
- Aladadi YT, Abas AF, Alresheedi MT (2016) Performance optimization of an apodized-chirped fiber Bragg gratings based chromatic dispersion compensator. IEEE Transparent Optical Networks (ICTON).
- Aladadi YT, Abas AF, Alresheedi MT (2016) Optimum Apodization Profile for Chirped Fiber Bragg Gratings based Chromatic Dispersion Compensator. J Eur Opt Soc Rapid Publ 11.