Research Article, J Vet Sci Med Diagn Vol: 12 Issue: 3
Fluorescent Immunoassay-Established Reference Intervals and Circannual Variation of Equine Plasma Adrenocorticotropic Hormone Concentrations in the Middle East
Camilla A Jamieson1*, Daniela Amado2, Sarah L Baillie2, Janinne Manuel2, Mohammad Ali2, Marcello Conte2 and Ian R Thompson3
1Department of Veterinary Medicine, Purdue University College of Veterinary Medicine, West Lafayette, Indiana, USA
2Department of Veterinary Medicine, Equine Veterinary Hospital, Al Shaqab, Qatar
3Department of Veterinary Medicine, Hamad Bin Khalifa University, Ar-Rayyan, Qatar
*Corresponding Author: Camilla A Jamieson
Department of Veterinary Medicine,
Purdue University College of Veterinary Medicine,
West Lafayette,
Indiana,
USA,
Tel: 8329191184;
E-mail: cajamies@purdue.edu
Received date: 03 April, 2023, Manuscript No. JVSMD-23-94180;
Editor assigned date: 06 April, 2023, PreQC No. JVSMD-23-94180 (PQ);
Reviewed date: 20 April, 2023, QC No. JVSMD-23-94180;
Revised date: 27 April, 2023, Manuscript No. JVSMD-23-94180 (R);
Published date: 25 May, 2023, DOI: 10.35248/2325-9590.23.12.100054
Citation:Jamieson CA, Amado D, Baillie SL, Manue J, Ali M, et al. (2023) Fluorescent Immunoassay-Established Reference Intervals and Circannual Variation of Equine Plasma Adrenocorticotropic Hormone Concentrations in the Middle East. J Vet Sci Med Diagn 12:3.
Abstract
Background: Adrenocorticotropic hormone is commonly measured to diagnose Pituitary Pars Intermedia Dysfunction (PPID) in horses. Diagnosis requires a validated analyzer and understanding of physiologic variations that affect hormone concentrations. Two commercially available ACTH analyzers are used in equine laboratories. Both are validated for detection of ACTH in equine plasma, but reference intervals have been established for the chemiluminescent analyzer only.
Objectives: Determine reference intervals for ACTH in adult horses via fluorescent immunoassay. Determine the effect of photoperiod on ACTH secretion in the Middle East. Establish normal reference intervals for all plasma ACTH in all months of the year in the Middle East.
Materials and methods: 60 healthy adult horses sampled once; 15 healthy adult horses sampled monthly for 12 months. A single timepoint evaluation of plasma ACTH, then a longitudinal observational repeated study of 15 horses sampled for 12 consecutive months.
Results: Reference intervals-10.3 pg/ml to 32.6 pg/ml. Monthly means and standard deviations lay within the established intervals; however significant differences between individual monthly means were identified.
Conclusion: The AIA-360 analyzer may be used to measure ACTH in horses and this study presents a large-sample reference range that may be used as a guideline in other laboratories. The attenuated photoperiod variability observed in the Middle East is associated with attenuation of the circannual rhythm of ACTH secretion. Significant seasonal variation in mean ACTH concentration was identified but the magnitude of fluctuation was small compared to previous reports. All monthly reference intervals lay within the initial interval, so seasonal adjustment is not needed when sampling horses in peri-equatorial regions.
Keywords: Horse, Pituitary pars intermedia dysfunction, Diagnostic testing, Daylight effect, Photoperiod
Abbreviations:
ACTH: Adrenocorticotropic Hormone; CIA: Chemiluminescence Analyzer; EMS: Equine Metabolic Syndrome; FIA: Fluorescence Immunoanalyzer; PPID: Pituitary Pars Intermedia Dysfunction
Introduction
Pituitary Pars Intermedia Dysfunction (PPID) is a disease of the pars intermedia of the pituitary gland of aging horses. PPID is one of the most frequently diagnosed endocrinopathies in horses [1], with a prevalence estimated at 21% in horses and ponies over 15 years old [2]. Despite its prevalence, understanding of the pathophysiology of PPID, and accurate diagnostic testing, is an area of ongoing research [3,4]. PPID causes a wide range of clinical signs, including muscle atrophy, laminitis, polydipsia/polyuria, hyperhidrosis, hypertrichosis, abnormal fat distribution and insulin resistance, immunosuppression leading to opportunistic infections, behavioral abnormalities, infertility and in some cases neurologic diseases [5,6]. The condition is caused by degeneration of the hypothalamic dopaminergic neurons leading to metabolically active hyperplasia of this region. This biologically active tissue overproduces many hormones and their precursors, the most consistent of which being Pro-Opio-Melanocortin (POMC). This molecule is then cleaved to α-Melanocyte Stimulating Hormone (α- MSH), β-endorphin, Adrenocorticotropic Hormone (ACTH) and a number of other less well elucidated hormones [7]. Each of these hormones plays a role in the development of the clinical signs seen in PPID [8].
The most frequently used screening test for PPID is measurement of basal plasma ACTH concentrations due to ease of sampling and test performance. Under ideal circumstances, this test performs well however there are many environmental and horse factors that can interfere with test interpretation [9]. Consistent pathologic elevation in plasma ACTH is indicative of PPID, however physiological elevations can occur with illness and environmental stressors, and not all horses with PPID exhibit elevated resting plasma ACTH levels, especially early in the course of disease [10]. Additionally, in healthy horses, ACTH exhibits a physiological peak associated with decreasing photoperiod times of year, fall in the northern hemisphere and spring in the southern hemisphere, with this peak being accentuated in PPID affected individuals. All of these factors must be accounted for when interpreting diagnostic test results [11]. An additional factor that must be considered when selecting and interpreting diagnostic test results is the analytical method used to obtain the results [12].
In horses, plasma ACTH concentrations may be measured by one of three immunoassay techniques, including Radioimmunoassay (RIA), Chemiluminescence Immunoassay (CIA) and Fluorescence Immunoassay (FIA). CIA and FIA are the most convenient analysis analysis techniques in a small laboratory practice as they both have short assay processing times and neither require the use of a of a radioisotope or overnight incubation, as with RIA. The immulite 1000 CIA has validated published reference intervals in horses, while the AIA-360 FIA does not, to date. The AIA-360 has been shown to have acceptable validity in measuring equine ACTH, but the interanalyzer agreement between the chemiluminescent methods and the fluorescent methods are poor meaning that laboratories using the AIA-360 analyzer must generate institutional reference ranges before interpreting results. Thus, unique reference intervals must be developed for both the chemiluminescent and immunofluorescent assays [13].
Additionally, it has been shown that horses in both the northern and southern hemispheres, who reside far from the equator, have a significant short-day peak in plasma ACTH concentrations; however this has not been evaluated in regions at or near the equator where photoperiod variability is minimal. The aims of this study were firstly to develop a standard reference interval for ACTH in healthy adult horses using the AIA-360 fluorescent immunoassay for in house and external laboratory use; secondly to longitudinally evaluate seasonal variation in ACTH levels in a region with reduced circannual photoperiod variability compared to other locations evaluated, and thirdly, to integrate the two datasets to develop an ACTH reference interval applicable in all seasons in the region investigated [14].
Materials and Methods
Inclusion and exclusion criteria
Healthy adult mares and geldings were evaluated for inclusion in all parts of the study. Pregnant mares were not considered for inclusion as pregnancy can alter normal ACTH levels [15]. Stallions were also avoided as the available population of stallions available was intensively managed with minimal exposure to natural light, which could confound the results obtained, and were not evenly breed distributed when compared to the rest of the sample population. Sample population was limited to sport horse/warmblood type horses that had been acclimatized to the current management system and environment for a minimum of 12 months. These criteria were included to reduce the effect of breed on results and minimize physiological stress response to travel and acclimatization to a new management system [16].
Horses were confirmed healthy by physical examination and had no history of medical treatment or significant stressors in the 30 days prior to inclusion. Significant stressors were defined as events associated with increases in basal cortisol levels, which may result in physiologically increased plasma ACTH levels, such as travel, competition, or hospitalization. Horses with known aversion to veterinary procedures were excluded from the sample population as were horses with overt signs of endocrinopathies, particularly EMS (horses exhibiting regional adiposity, pr current or past history of laminitis). Horses with a body condition score ≥ 7 or ≤ 3 were also excluded from the sample population [17].
Fluorescent Immunoassay ACTH Reference Intervals
Sixty healthy adult horses, mares and geldings between the ages of 6-15 years (mean 11.6 years) were selected for inclusion in a single time point cross sectional study to determine baseline normal ACTH values using the AIA-360 analyzer. 60 venous blood samples, from 60 horses, were collected on the same day, in May, the previously established non-peak season in the northern hemisphere [18].
Seasonal variation of ACTH
To determine the circannual variation in ACTH levels, 15 randomly selected horses, with the same inclusion criteria, but not included in the original 60 horses, were repeatedly sampled on the working day closest to the 15th of every month, for one calendar year, in a longitudinal repeated timepoint sampling format. All samples were frozen at -80°C and analyzed at one time point, to reduce inter-user variability, storage and processing ensured only one freeze-thaw cycle was undertaken per sample. Storage time at -80°C has been shown to prevent ACTH degradation in the sample. Thus, samples were stored from the time of collection to the time of processing, and storage duration varied by collection month [19-21].
Sampling and analysis methodology
Blood was collected by jugular venipuncture into 4 ml potassium- EDTA anticoagulated collection tubes from each horse, chilled immediately and separated by refrigerated centrifugation at 3500 rpm for 10 min within one hour of collection. After separation plasma was aliquoted and stored at -80°C until further analysis [22].
Plasma ACTH concentrations were measured immediately following a single thaw cycle, using a two-site immunoenzymometric assay performed entirely in ST-AIA-PACK ACTH test cups on the TOSOH® AIA-360 Automated Enzyme Immunoassay Analyzer, following operating procedure. TOSOH® AIA-360 is a competitive fluorescent enzyme immunoassay system which runs in proprietary single-use test cups, containing lyophilized magnetic beads, poly and monoclonal antibodies and activator reagents. The amount of enzymelabeled monoclonal antibody that binds to the beads is directly proportional to the plasma ACTH concentration in the test sample, yielding the numerical result value [23]. For each sample the instrument measures the calibration rate 6 times for concentrations 0, 15, 50, 313,837 and 2190 in triplicates after reaction initiation and before calculation of the final ACTH concentration. ACTH assay has a sensitivity of 2.0 pg/mL and an upper limit range of 2,000 pg/mL in specimen without dilution. Daily calibration curves and QC maintenance procedures were performed as described in the TOSOH AIA System Operator’s Manual. ACTH concentrations were determined in plasma samples from the standard curve obtained [24].
Statistical analysis
Normal reference intervals: Raw data were assessed for normality using Shapiro-Wilk test for normality using the rstatix (v0.7.0) package in R 4.1.2 and reference intervals were calculated by determining the mean, median, and 2.5th and 97.5th percentiles [25]. Bootstrap means, using 10,000 replicates, were calculated and used to generate 95% Bias-Corrected and accelerated (BCa) confidence intervals using the boot (v1.3-28) package in R 4.1.2 [25-29].
Seasonally adjusted reference intervals: Pairwise T-tests with Benjamini-Hochberg p-value correction for multiple testing were used to assess the significance of variation between the mean ACTH values for each month. Means and bootstrap means, using 10,000 replicates, and 95% BCa confidence intervals were calculated for each individual monthly reference range as well as the population baseline reference interval, as described above. Boxplots were produced using the ggplot 2 (v3.3.5) package in R 4.1.2. Significance was set at α=0.05 [30].
Results
Normal reference intervals
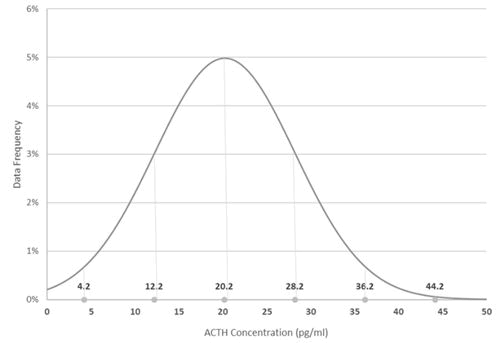
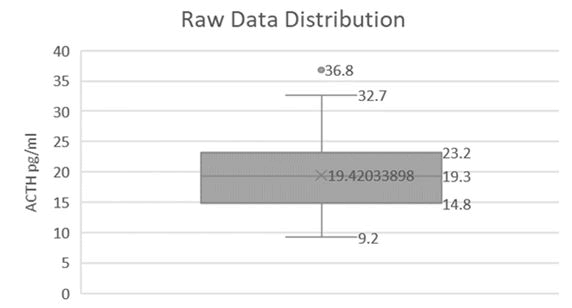
60 horses were selected for inclusion. All samples were collected without adverse event, frozen and processed as one batch. Raw data were assessed for normality and were found to follow a log-normal distribution (Figures 1,2 and Table 1).
| ACTH (pg/mL) | Lower reference interval | Upper reference interval | |
|---|---|---|---|
| Mean | Median | 2.5th percentile | 97th percentile |
| 19.4 | 19.3 | 10.83 | 32.66 |
Table 1: Distribution and reference intervals for ACTH in long-day season.
Circannual variation in ACTH secretion
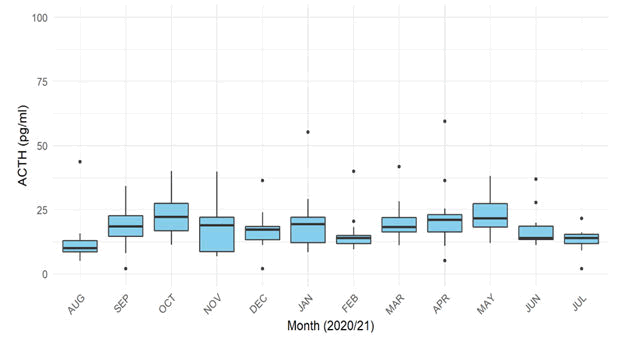
Of the 15 horses selected, one mare underwent emergency celiotomy for a colon torsion 1.5 weeks prior to the fifth sampling date, and her ACTH was significantly elevated at the following sampling time point, so this data point was excluded as the elevation in ACTH was attributable to a major stressor. The means and interquartile ranges were calculated for the data from each month, as shown in Figure 3 [31].
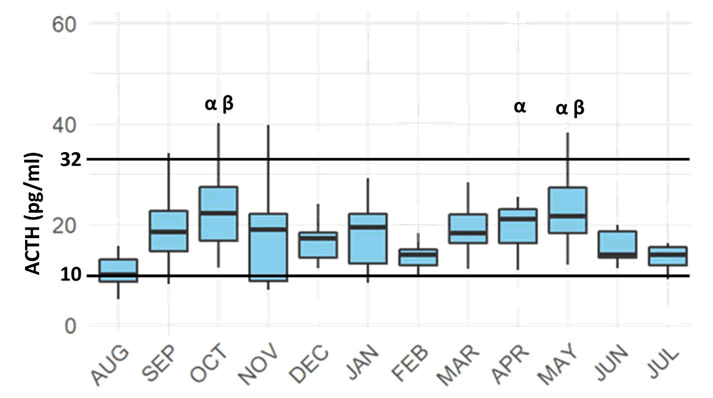
Pairwise T tests confirmed the visually appreciable trend, that there is a significant effect of month on mean plasma ACTH. The mean plasma ACTH concentrations in August were significantly (p<0.05) lower than in April, May or October, as were the means for the months of October and May significantly different to the dataset from July.
The rolling, significant variation between dataset means confirms a trend of seasonal variability, with months adjacent to one another failing to vary significantly but with months seasonally separated showing significant variation. A monthly dataset range was established for each month, with 95% confidence intervals (Tables 2 and 3) [32].
| Month | August | September | October | November | December | January | February | March | April | May | June |
|---|---|---|---|---|---|---|---|---|---|---|---|
| September | 0 .203 | - | - | - | - | - | - | - | - | - | - |
| October | 0 .034 | 0 .444 | - | - | - | - | - | - | - | - | - |
| November | 0 .380 | 0 .691 | 0 .216 | - | - | - | - | - | - | - | - |
| December | 0 .434 | 0 .615 | 0 .203 | 0 .934 | - | - | - | - | - | - | - |
| January | 0 .144 | 0 .850 | 0 .518 | 0 .518 | 0 .515 | - | - | - | - | - | - |
| February | 0 .518 | 0 .518 | 0 .173 | 0 .812 | 0 .873 | 0 .434 | - | - | - | - | - |
| March | 0 .144 | 0 .846 | 0 .518 | 0 .518 | 0 .515 | 0 .992 | 0 .434 | - | - | - | - |
| April | 0.034 | 0 .518 | 0 .873 | 0 .312 | 0 .248 | 0 .674 | 0 .209 | 0 .674 | - | - | - |
| May | 0 .034 | 0 .444 | 0 .992 | 0 .216 | 0 .203 | 0 .518 | 0 .173 | 0 .518 | 0 .873 | - | - |
| June | 0 .390 | 0 .674 | 0 .216 | 0 .992 | 0 .949 | 0 .518 | 0 .827 | 0 .518 | 0 .303 | 0.216 | - |
Table 2: P-values for inter-month variability of mean ACTH values.
| Month | Mean | Bootstrap | Confidence | Lower RI | Upper RI |
|---|---|---|---|---|---|
| August | 10.24 | 10.23 | 0.95 | 8.722 | 11.84 |
| September | 20.18 | 20 .18 | 0.95 | 16.81 | 24.2 |
| October | 22 .95 | 22 .95 | 0.95 | 19.33 | 27.46 |
| November | 17.1 | 17.1 | 0.95 | 13.22 | 22.4 |
| December | 16.22 | 16.22 | 0.95 | 14.48 | 18.32 |
| January | 17.52 | 17.53 | 0.95 | 14.34 | 20.99 |
| February | 13.04 | 13.03 | 0.95 | 11.8 | 14.63 |
| March | 18.56 | 18.54 | 0.95 | 16.25 | 21 |
| April | 19.23 | 19.25 | 0.95 | 16.38 | 21.44 |
| May | 22 .98 | 22.97 | 0.95 | 19.82 | 26.85 |
| June | 14.62 | 14.62 | 0.95 | 13.36 | 16.26 |
| July | 13.42 | 13.41 | 0.95 | 11 .980 | 14.48 |
Table 3: Monthly reference intervals.
When examining the two datasets, in conjunction, it is clear that while there is a significant annual variation in mean ACTH concentration, this variation lies within the reference intervals established in part 1, as shown in Figure 4.
Discussion
Part one of this study establishes normal reference intervals for ACTH, obtained via the FIA method. This information has not been previously reported. While the reference intervals obtained in this study are similar to those previously published using the CIA method, a number of comparative studies have shown that the agreement between ACTH results obtained via the CIA and the FIA methods are not interchangeable [33].
The second part of this study demonstrates an attenuated seasonal variation in mean ACTH levels throughout the year when compared to other locations. In the Northern and Southern Hemispheres, at locations distant from the equator, a physiological elevation in ACTH is noted when the seasons approach the shortest day of the year [34]. The initial studies based in the Northern Hemisphere, showed decreases in daily photoperiod/number of daylight hours per day in the fall, were correlated with elevated ACTH levels in healthy horses. Studies from Australia have shown similar trends of increasing ACTH associated with decreasing photoperiod, which occurred in the spring months in the Southern Hemisphere [35].
The circannual photoperiod variability in Qatar is significantly less than in any other region where these studies have been performed. The annual photoperiod variability, i.e., the difference between the longest day and shortest day in Qatar is only 3 hours and 9 minutes, as opposed to 5 hours and 15 minutes difference in Australia, and 6 hours and 4 minutes in Massachusetts/Ithaca NY, USA. The data presented here supports the hypothesis that with attenuated photoperiod variability, there is a reduced effect of seasonal variation on basal ACTH secretion in healthy adult horses. There is a statistically significant effect of season and month on the mean ACTH measurements obtained, however this fluctuation is reduced compared to the variation identified in other geographic locations. All mean values and reference intervals established for each individual month lay within the overall reference interval first calculated. As such, the reference ranges established above are applicable for all months of the year, and in peri-equatorial regions the previously published seasonally adjusted reference ranges are not applicable [36].
It has been shown that hours of daylight and changes in photoperiod have a much more significant impact on circadian and circannual rhythms of horses than ambient temperature [37]. This has been demonstrated both in relation to ACTH, α-MSH secretion, and PPID, as well as in relation to annual cyclicity in mares undergoing reproductive manipulation. Despite this, it is worth considering that there may be an effect of ambient temperature and significantly higher mean annual environmental temperature in Qatar compared to Northern or Southern Hemisphere locations where ACTH has been evaluated, however the clinical implications for the finding that ACTH secretion is consistent throughout the year is relevant regardless of impact of ambient temperature, as all geographic locations close to the equator have higher mean temperatures than most locations distant from the equator [38].
As there is good inter-test agreement demonstrated with the FIA technique, one can conclude from previous work, there should be no effect of analyzer type on the seasonal variation in ACTH secretion. However it has been shown that when analyzing samples obtained via Thyrotropin Releasing Hormone (TRH) stimulation testing, the FIA analyzer fails to detect seasonal variability as well as the CIA analyzer. Thus the type of testing and the analyzer used to obtain results must be considered critically before drawing diagnostic conclusions. The significant differences in monthly datasets with significant effect of season suggests that in the study population presented here, the FIA effectively detected seasonal variation in the breeds selected, although the magnitude of this variation was attenuated compared to data obtained in other geographic locations. Given that the AIA-360 analyzer is a commercially available unit that is supplied with manufacturer generated reagents and consumables, the inter-user variation of the analysis is minimized. Based on this, the reference intervals presented here should be widely acceptable for all testing employing the FIA analyzer; however it is prudent for each institution employing this technique to confirm applicability of these ranges based on their data generated [39].
Limitations of this study include the relatively homogenous population of warmblood and sport horses, so breed variation may not be fully accounted for, although the sample population was maintained as homogenous as possible to reduce the effects of breed on results. This is particularly important due to the high prevalence of Arabian horses in the Middle East. Previous studied have generated conflicting data regarding the effect of breed on baseline endocrine status. Initially, minimal impact of breed or gender on normal reference intervals or seasonality of ACTH secretion was described. More recent work however has demonstrated significant breed variation especially in Arabian, Andalusian and pony breeds. Based on this, Arabians and pony breeds were excluded from the sample population, as the aim of the study was to investigate the effect of reduced photoperiod variability on basal ACTH secretion in a baseline population of horses, initially and pony and Arabian breeds have been shown to have unique ACTH secretion patterns [39].
Further limitations to this study include the relative intensity of management system in which these horses were housed, with climate control during the hottest months of the year however this is both normal for horses in the Middle East, and essential to providing adequate welfare for horses living in these conditions. It was also confirmed when selecting horses for inclusion, that stabling provided minimal time under artificial lights, lights were turned off during the night, all horses had exposure to natural light via daily turnout and an external window, and stable lights were turned on after sunrise. This is important as there is data to support the effect of artificial photoperiod manipulation on hormonal axis of horses. Evaluation of the management conditions showed a similar level of environmental manipulation and levels of natural light exposure in this study population as in many other study populations of horses and most populations of performance horses around the world. A population of pasture housed horses without any artificial light or temperature manipulation would be ideal, but this is neither available nor humane in the Gulf region. Further work could include evaluation of horses in the Middle East that are housed outdoors year-round, however this poses significant welfare issues, as the heat, the intensity of UV exposure, and the lack of grazing in the desert are not compatible with equine health and welfare. Additionally, while the reference intervals demonstrated here give the clinician some data from which to build a framework for clinical diagnosis, further work using the FIA in various geographic locations in both varying breed populations and older normal and older PPID affected horses is required to make this data complete and broadly applicable [40].
Conclusion
This study provides the normal ACTH reference interval of 10.83 pg/ml-32.66 pg/ml for healthy adult horses. This is the first published reference intervals established via the AIA-360 equine plasma ACTH analyzer. While each institution employing this analyzer should confirm that data generated is in agreement, these references may be applicable across testing locations given the excellent inter and intra test agreement previously established for this analyzer. Further data should be collected with affected versus healthy horses before diagnostic conclusions are drawn for individual animals and case management. Monthly data analysis shows an attenuated effect of season on the magnitude of baseline ACTH variability, indicating that there is no need for seasonally adjusted reference ranges when measuring equine plasma ACTH in near-equatorial regions such as the Middle East.
References
- Frank C (2015) 136: Pituitary Pars Intermedia Dysfunction. Robinson's Current Therapy in Equine Medicine, Sprayberry and Robinson.
- Ireland JL, McGowan CM (2018) Epidemiology of pituitary pars intermedia dysfunction: A systematic literature review of clinical presentation, disease prevalence and risk factors. Veter J 235: 22-33.
[Crossref] [Google Scholar] [PubMed]
- Beech J, Boston RC, McFarlane D, Lindborg S (2009) Evaluation of plasma ACTH, α-melanocyte-stimulating hormone, and insulin concentrations during various photoperiods in clinically normal horses and ponies and those with pituitary pars intermedia dysfunction. J Ameri Veter Med Associati 235: 715-722.
[Crossref] [Google Scholar] [PubMed]
- McFarlane D (2019) Diagnostic testing for equine endocrine diseases: Confirmation versus confusion. Veter Clin Equi Pract 35: 327-338.
[Crossref] [Google Scholar] [PubMed]
- McFarlane D (2011) Equine pituitary pars intermedia dysfunction. Veter Clin Equi Pract 27: 93-113.
[Crossref] [Google Scholar] [PubMed]
- Schott HC (2002) Pituitary pars intermedia dysfunction: Equine Cushing's disease. Veter Clin Equ Pract 18: 237-270.
[Crossref] [Google Scholar] [PubMed]
- Durham AE (2016) Endocrine disease in aged horses. Veter Clin Equ Pract 32: 301-315.
[Crossref] [Google Scholar] [PubMed]
- Shepard KN, Haffner JC, Neal DL, Grubbs ST, Pearce GL (2019) Effect of delayed plasma centrifugation on equine adrenocorticotropic hormone concentration. J Veter Diag Invest 31: 585-587.
[Crossref] [Google Scholar] [PubMed]
- Tatum RC, McGowan CM, Ireland JL (2021) Evaluation of the sensitivity and specificity of basal plasma adrenocorticotrophic hormone concentration for diagnosing pituitary pars intermedia dysfunction in horses: A systematic review. Veter J 275: 105695.
[Crossref] [Google Scholar] [PubMed]
- Spelta CW (2015) Equine pituitary pars intermedia dysfunction: Current perspectives on diagnosis and management. Veter Med Res Report 12:293-300.
[Crossref] [Google Scholar] [PubMed]
- Perkins GA, Lamb S, Erb HN, Schanbacher B, Nydam DV, et al. (2002) Plasma Adrenocorticotropin (ACTH) concentrations and clinical response in horses treated for equine Cushing's disease with cyproheptadine or pergolide. Equ veter J 34: 679-685.
[Crossref] [Google Scholar] [PubMed]
- Cordero M, Brorsen BW, McFarlane D (2012) Circadian and circannual rhythms of cortisol, ACTH, and α-melanocyte-stimulating hormone in healthy horses. Dome Anim Endocrinol 43: 317-324.
[Crossref] [Google Scholar] [PubMed]
- Knowles EJ, Moreton‐Clack MC, Shaw S, Harris PA, Elliott J, et al. (2018) Plasma Adrenocorticotropic Hormone (ACTH) concentrations in ponies measured by two different assays suggests seasonal cross‐reactivity or interference. Equi Veter J 50: 672-677.
[Crossref] [Google Scholar] [PubMed]
- McGowan C (2018) Recommendations from the Australian and New Zealand equine endocrine group and the interpretation of plasma endogenous ACTH concentrations for the diagnosis of Pituitary Pars Intermedia Dysfunction (PPID). Aus Veter J 96: 317-318.
[Crossref] [Google Scholar] [PubMed]
- Couetil L, Paradis MR, Knoll J (1996) Plasma adrenocorticotropin concentration in healthy horses and in horses with clinical signs of hyperadrenocorticism. J Vet Int Med 10: 1-6.
[Crossref] [Google Scholar] [PubMed]
- Banse HE, Schultz N, McCue M, Geor R, McFarlane D, et al. (2018) Comparison of two methods for measurement of equine adrenocorticotropin. J Vet Diagn Invest 30: 233-237.
[Crossref] [Google Scholar] [PubMed]
- Mc Gowan TW, Pinchbeck GP, Mc Gowan CM (2013) Evaluation of basal plasma α‐melanocyte‐stimulating hormone and adrenocorticotrophic hormone concentrations for the diagnosis of pituitary pars intermedia dysfunction from a population of aged horses. Equ Vet J 45: 66-73.
[Crossref] [Google Scholar] [PubMed]
- Horn R, Stewart AJ, Jackson KV, Dryburgh EL, Medina‐Torres CE, et al. (2021) Clinical implications of using adrenocorticotropic hormone diagnostic cutoffs or reference intervals to diagnose pituitary pars intermedia dysfunction in mature horses. J Vet Int Med 35: 560-570.
[Crossref] [Google Scholar] [PubMed]
- McGilvray TA, Knowles EJ, Harris PA, Menzies‐Gow NJ (2020) Comparison of immunofluorescence and chemiluminescence assays for measuring ACTH in equine plasma. Equ Vet J 52: 709-714.
[Crossref] [Google Scholar] [PubMed]
- Gehlen H, Twickel S, Stockle S, Weber C, Bartmann CP, et al. (2020) Diagnostic orientation values for ACTH and other parameters for clinically healthy donkeys and mules (insulin, triglycerides, glucose, fructosamines, and V‐GT). J Anim Physiol Anim Nutrit 104: 679-689.
[Crossref] [Google Scholar] [PubMed]
- Marcilla M, Muñoz A, Satue K (2017) Longitudinal changes in serum catecholamines, dopamine, serotonin, ACTH and cortisol in pregnant Spanish mares. Res Vet Sci 115: 29-33.
[Crossref] [Google Scholar] [PubMed]
- Henneke DR, Potter GD, Kreider JL, Yeates BF (1983) Relationship between condition score, physical measurements and body fat percentage in mares. Equ Vet J 15: 371-372.
[Crossref] [Google Scholar] [PubMed]
- Hu K, Stewart AJ, Yuen KY, Hinrichsen S, Dryburgh EL, et al. (2020) The effect of freeze‐thaw cycles on determination of immunoreactive plasma adrenocorticotrophic hormone concentrations in horses. J Vet Int Med 34: 1350-1356.
[Crossref] [Google Scholar] [PubMed]
- Haffner JC, Neal DL, Hoffman RM, Grubbs ST (2019) Plasma adrenocorticotropic hormone concentration in horses decreases after freezing for 60 days. J Vet Diag Invest 31: 856-858.
[Crossref] [Google Scholar] [PubMed]
- Royston P (1995) Remark AS R94: A remark on algorithm AS 181: The W-test for normality. J Royal Statist Soc 44: 547-551. [Crossref]
[Google Scholar] [PubMed]
- R Core Team R (2013) R: A language and environment for statistical computing.
- Benjamini Y, Hochberg Y (1995) Controlling the false discovery rate: A practical and powerful approach to multiple testing. J Royal Stat Soc Ser 57: 289-300. [Crossref]
[Google Scholar] [PubMed]
- Irvine KL, Burt K, Hill AJ, Shaw S, Papasouliotis K (2016) Initial analytic quality assessment and method comparison of an immunoassay for adrenocorticotropic hormone measurement in equine samples. Vet Clin Pathol 45: 154-163.
[Crossref] [Google Scholar] [PubMed]
- Copas VEN, Durham AE (2012) Circannual variation in plasma adrenocorticotropic hormone concentrations in the UK in normal horses and ponies, and those with pituitary pars intermedia dysfunction. Equ Vet J 44: 440-443.
[Crossref] [Google Scholar] [PubMed]
- Byrne DP, Secombe CJ, Tan RHH, Perera DI, Watts SP, et al. (2018) Circannual variability in adrenocorticotropic hormone responses to administration of thyrotropin-releasing hormone in clinically normal horses in Australia. Vet J 238: 58-62.
[Crossref] [Google Scholar] [PubMed]
- Secombe CJ, Tan RHH, Perara DI, Byrne DP, Watts SP, et al. (2017) The effect of geographic location on circannual adrenocorticotropic hormone plasma concentrations in horses in Australia. J Vet Int Med 31: 1533-1540.
[Crossref] [Google Scholar] [PubMed]
- Haritou SJA, Zylstra R, Ralli C, Turner S, Tortonese DJ (2008) Seasonal changes in circadian peripheral plasma concentrations of melatonin, serotonin, dopamine and cortisol in aged horses with Cushing’s disease under natural photoperiod. J Neuro 20: 988-996.
[Crossref] [Google Scholar] [PubMed]
- Adams GP, Bosu WT (1988) Reproductive physiology of the nonpregnant mare. An overview and update. Veter Clin North Amer Equ Pract 4: 161-176.
[Crossref] [Google Scholar] [PubMed]
- McCue PM, Logan NL, Magee C (2007) Management of the transition period: Physiology and artificial photoperiod. Equ Vet Educat 19: 146-150. [Crossref]
[Google Scholar] [PubMed]
- Donaldson MT, McDonnell SM, Schanbacher BJ, Lamb SV, McFarlane D, et al. (2005) Variation in plasma adrenocorticotropic hormone concentration and dexamethasone suppression test results with season, age, and sex in healthy ponies and horses. J Vet Int Med 19: 217-222.
[Crossref] [Google Scholar] [PubMed]
- Bamford NJ, Harris PA, Bailey SR (2020) Circannual variation in plasma adrenocorticotropic hormone concentrations and dexamethasone suppression test results in Standardbred horses, Andalusian horses and mixed‐breed ponies. Aust Veter J 98: 616-621.
[Crossref] [Google Scholar] [PubMed]
- Durham AE, Potier JF, Huber L (2022) The effect of month and breed on plasma adrenocorticotropic hormone concentrations in equids. Veter J 286: 105857.
[Crossref] [Google Scholar] [PubMed]
- Hodge SL, Kreider JL, Potter GD, Harms PG, Fleeger JL, et al. (1982) Influence of photoperiod on the pregnant and postpartum mare. Amer J Vet Res 43: 1752-1755. [Crossref]
[Google Scholar] [PubMed]
- Walsh CM, Prendergast RL, Sheridan JT, Murphy BA (2013) Blue light from light-emitting diodes directed at a single eye elicits a dose-dependent suppression of melatonin in horses. Vet J 196: 231-235.
[Crossref] [Google Scholar] [PubMed]
- Nolan MB, Walsh CM, Duff N, McCrarren C, Prendergast RL, et al. (2017) Artificially extended photoperiod administered to pre-partum mares via blue light to a single eye: Observations on gestation length, foal birth weight and foal hair coat at birth. Theriogenol 12: 126-133.
[Crossref] [Google Scholar] [PubMed]
 Spanish
  Chinese
  Russian
  German
  French
  Japanese
  Portuguese
  Hindi
Hindi 