Mini Review, J Clin Exp Oncol Vol: 14 Issue: 1
Fractal Analysis in Medical Images
Alen Perez Labardi*
Department of Mathematics and Computer Science, University of Havana, Institute of Cryptography, Havana, Cuba
*Corresponding Author:Alen Perez Labardi
Department of Mathematics and Computer Science, University of Havana, Institute of Cryptography, Havana, Cuba
E-mail: alenperezlabardi@gmail.com
Received date: 13 October, 2023, Manuscript No. JCEOG-23-116815;
Editor assigned date: 16 October, 2023, PreQC No. JCEOG-23-116815 (PQ);
Reviewed date: 30 October, 2023, QC No. JCEOG-23-116815;
Revised date: 17 January, 2025, Manuscript No. JCEOG-23-116815 (R);
Published date: 24 January, 2025, DOI: 10.4172/2324-9110.1000449
Citation: Labardi AP (2025) Fractal Analysis in Medical Images. J Clin Exp Oncol 14:1..
Abstract
The fractal analysis of medical images is an investigation field in those that numerous results of important value have been obtained. This work describes the basic foundations of the fractal analysis and its application has more than enough medical images, leaning on in five scientific investigations. Fractal analysis has emerged as a valuable tool in the interpretation of medical images, allowing for the quantitative characterization of complex structures that cannot be effectively described using traditional Euclidean geometry. This study explores the foundational concepts of fractal geometry and its application to medical images, specifically using the Fractal Dimension (FD) to assess structural irregularities in biological systems such as tumors. By employing the box-counting method to calculate the FD, this work demonstrates its utility in the diagnosis and progression monitoring of various cancers, including lung cancer and melanoma. The fractal properties of medical images offer insights into tumor heterogeneity and potential correlations with treatment response. This approach can enhance diagnostic accuracy and contribute to personalized treatment planning in oncology. Additionally, the use of fractal analysis for analyzing vascular systems, retinas, and mammograms is discussed, highlighting its broad applicability in medical diagnostics.
Keywords: Fractal; Cancer; Box-counting; Fractal dimension
Introduction
A complex object in an image, it cannot be described if the Euclidian geometry is used, which is based on such regular objects as cubes, cylinders, cones, etc. Hausdorff, it introduced a method to measure the dimension of complex objects through a real value, although it presented certain difficulty in the practices. However Mandelbrot in 1983 it defined a method to which I call Fractal Dimension (FD) that is not but that the space that occupies a fractal set. These groups contain self-similar elements that are independent of scale. The natural images are composed by self-similar elements, then, all natural images can be considered as a fractal set. Investigators have used the FD for many applications: Quantification of noises, segmentation of images, analysis of textures, recognition of patterns, biometrics, ecology, cancer detection and tomography [1].
In the field of the biology we can find a great variety of systems that develop rough or irregular interfaces, being the but important the growth tumoral. The form of the profile of the tumor allows us to classify and to study the tumor type according to its geometry and dynamics, as well as it has been observed that the form of the contour gives a valuable indication of the dynamic behavior of the tumor. Kikuchi it showed that the surface of an adenocarcinoma endometrial possesses a structure fractal, and that the FD differs chord to the histological grade. In Lee's work, the FD allowed to differ among scaly cells, carcinoma and adenocarcinoma of the lung. Vasiljevic it showed that the parameters of the analysis multi-fractal are significantly different among three groups of malignancy (renal, mammaries, lungs) that produce metastasis in the bones, discovering a new potential application to detect primary tumors in patient with cancer metastasis of unknown origin [2].
The works mentioned previously possess as denominator common images, which are processed by different algorithms to obtain encouraging results and to offer a better one diagnose this way to patient [3]. This work seeks to show some general results in the environment of the digital prosecution of medical images, through the application of technical and methods sustained in the FG, to what is denominated Fractal Analysis (FA).
Literature Review
Fractal geometry
The word fractal derives of Latin fractus that means broken. It was given to know for the scientific B. Mandelbrot in the year 1975, to describe complex objects that presented a peculiar property to infinite scales. Each object fractal can be divided in parts but small, each one of those which is similar to the complete object, either in way: Exact, almost-exact or statistic-exact. It is this property defining for this object, and it is denominated self-similarity [4-8]. Mandelbrot showed that the form of building these objects is through functions recursive or iterative. Two classic examples are: The flake of snow of Koch and the triangle of Sierpinsky (Figures 1 and 2).
Figure 1: Flake of snow of Koch.
Figure 2: Triangle of sierpinsky.
We can characterize the objects fractales quantitatively using the concept of Fractal Dimension (FD). To determine the FD of an object, a standard unit of measure is used. To measure the longitude of a segment, we will use the unit of having measured ε, for th e total longitude of the segment L, then:
L=N*ε (1)
Where N is the number of units ε that are needed to cover the segment.
If we needed to cover a surface, we would use as standard measure a side square ε, for that that the surface it would be given for:
L2=N*ε2 (2)
In a similar way it would be calculated for a volume,
L3=N*ε3 (3)
And in general,
LD=N*εD (4)
Where D is the dimension topological of the object.
Clearing D in (4) we obtain:
D=ln (N)/(ln(L/ε)) (5),
The equation (5) we will write it as:
Df=ln(N)/(ln(L/ε)) (6),
And we will call fractal dimension to Df.
Fractal analysis
The Fractal Analysis (FA), in one of their branches, tries to characterize objects through the FD. Reason of interest and of wide investigations they are the images, in particular the Medical Images (MI) [9-12].
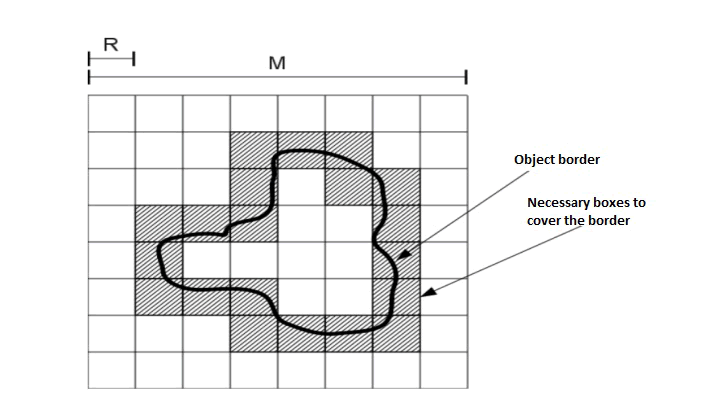
One in the ways but common of calculating the FD it has more than enough images, for their simple implementation, it is the method Box Counting (BC). BC takes an image of M×M, where M=2k, and it segments the image in size windows R=M/ε,(R=2k,i=0..k) and it counts the quantity of windows that they cover the object, N(R), like it is shown in the Figure 3. Then FD is calculated as:
Df=ln(N(R))/(ln(R)),
Where R≠1
Figure 3: Method BC. In this case they are necessary 20 boxes to cover the whole border of the object.
Quantification of structural heterogeneity using fractal analysis
The wicked tumors possess a heterogeneous structure, that which is recognized as one of the main problems in the propagation of the cancer and in the quimio-resistance. The evaluation of the texture of fabrics allows the detection and estimate of the homogeneity of the tumors in medical images, which cannot be predicted for the human eye. Previous works have demonstrated that the heterogeneity of the structure of the tumors this correlated with the answer to the treatment in cancer of: Head, neck, esophagus, lung and renal, in patients evaluated with images of Tomography (TC).
In this work, use of the software ImageJ is made (national institutes of health) and the plugin FracLac [13].
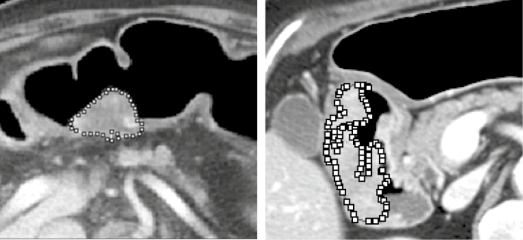
Using the software, the Method is applied BC it has more than enough images in scales of gray of 8-bit, to calculate the FD and to use it like a measure of heterogeneity or complexity. The region of interest (RDI) of the tumor it was selected manually by an observer (H.W, 3 years of experience in interpretation of abdominal TC), and supervised by a gastroenterologist (K.H, 14 years of experience in interpretation of abdominal TC). A partial result of a sample in the Figure 4.
Figure 4: To the left tumor of type I; to the right tumor of type III.
This study is the first report that it could demonstrate an impact in the I diagnose of the stomach cancer making use of the fractal analysis it has more than enough images TC, since it demonstrates that a high value of FD of a tumor, this significantly associated to the progression of this tumor, bearing to a worsening of the illness.
Discussion
Use of the methods of segmentation C-means, K-means and fractal geometry in the study in alive of the cancer of lung
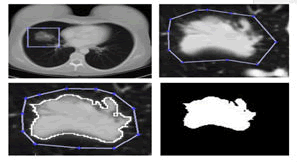
The FA applied to the lesions of lung tumors it has allowed the quantitative characterization of fabrics, the classification of the tumors and the quantification of the changes in the vascularization associated to the pathologies of the cancer (Figure 5).
Figure 5: Representation of the four steps that were made to have the segmentation finally cuts to court of the images TC of each tumor.
In this work, the growth of lung tumors in alive has been characterized by the analysis scaling, using data of TC. The cases that consist on different types of tumors, as the lung adenocarcinomas, nonsmall cells and healthy fabric in lung, were analyzed keeping in mind the morphology of the interface of the tumor guest to calculate their geometric dimensions, that is to say, the FD and the exponent criticize of local ruggedness αloc. As it was expected, the complexity of the tumor-guest's interface increases as the lesion becomes but aggressive, a fact that is reflected in the exponents of local ruggedness. Also, in the Table 1 are observed that each one of the stadiums in you become cancerous them of lung they have very marked differences [14-16].
| Type | dF averaged | αloc average |
|---|---|---|
| IIIA | 2.251 ± 0.01 | 0.050 ± 0.02 |
| IIIB | 2.151 ± 0.01 | 0.580 ± 0.01 |
| IIIC | 2.081 ± 0.01 | 0.676 ± 0.01 |
| IIID | 2.042 ± 0.01 | 0.723 ± 0.01 |
Table 1: Tumors of lung. Interface of the tumor host characterized by the FD, determined by the method BC, and the exponent of local ruggedness.
Although the complex dynamics of the growth tumoral requires a deep and extensive analysis to describe them appropriately, the dimension of the fractal capacity has demonstrated to be a fine and effective describer to establish differences among the properties of the fabric through the transition from the normal fabric to the neo-plasic, what makes it appropriate to incorporate it in clinical protocols and decisions prescribes [17].
Fractal analysis of nets microvasculars in human retinas
In this work, a total of 10 images of the retina of the human eye has been examined, obtained of the database of images STARE (Structured Analysis of the Retina), that they correspond to patient with some pathology. The images were taken with a specialized camera for the capture of pictures of retinas TopCon it marks TRV-50 to 35 FOV and digitized to a resolution of 700 × 605 pixels. In this database, they are three groups, two of them segmented by two different observers in a manual way and a third segmented group using the algorithm proposed by A. Hoover and collaborators. In the Figure 6 an image of the database is shown.
Figure 6: Image im0001 for a patient with antecedents of diabetic retinopatia a) Original image; b) Image in binary; c) Segmented image.
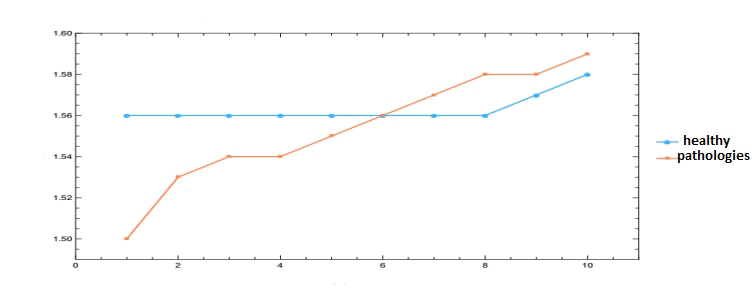
In a previous study presented by Santiago Cortes and collaborators, the dimension fractal is analyzed for a groups of images of 10 healthy patients' retina, with the same segmentation technique and the same characteristic in the I calculate of the dimension fractal carried out work presently. To the results of patient healthy, with those obtained for patient with some pathology, it is observed that the values of dimension fractal present a less fluctuating behavior in patient healthy that those observed in the patients with pathology [18]. The graph of the values average in upward order for patient healthy and with pathologies it is observed in the Figure 7.
Figure 7: Dimension fractal average of the retinas of patient healthy of patient healthy reported by Santiago Cortes and collaborators and patient with pathologies reported in this work.
So that a method of I diagnose it is efficient from the clinical point of view, it is necessary that this it provides elements that allow to carry out a process of early discrimination of the normal condition (including the biological variability) of the condition already with a pathology, besides showing high sensibility and appropriate specificity. As a result of this investigation, it was obtained that the value average of the FD of the vascular system of the retina in patient with pathologies is of 1,55 ± 0,05. When quantifying the FD of the vascular system of the retina, it is not possible to identify a characteristic pattern that allows to distinguish with clarity the different pathologies, however, if allows to differ among patient healthy and sick. Finally you concludes that the use of the analysis of the FD has a great potential in the evaluation clinical non-invasive of the human retina and offers clear advantages, but its interpretation this limited one to only value that you cannot use in the detection and quantification of some pathology in the retina [19].
Characterization of border structure using fractal dimension in Melanomas
Melanoma is the type of skin cancer but common inside the Caucasian population. If early is a detected big possibility they exist of eliminating it completely and that the patient recovers satisfactorily. Their identification is possible thanks to characteristic distinctive that differentiate them of the moles. Nevertheless, certain difficulty exists to recognize these characteristics, even for a trained dermatologist. It is this one of the reasons of the development of on-line applications that allows the attendance to the specialists to make an I diagnose early and but I specify of a Melanoma [20].
One of the characteristics that a Melanoma of a common mole differs is the irregularity of its border, which can be quantified with the help of the FD. The key of the process of detection of the border of the Melanoma, this in being able to differ between the mole and the skin in an image anyone, I process the one that is known as segmentation. After the segmentation process, the FD is calculated, like it is shown in the Figure 8.
Figure 8: Border detection for: (a) Lunar normal, (b) Melanoma. And their respective FD calculated by the method BC: (c) Lunar normal, (d) Melanoma.
As a result of the carried out tests, it was obtained that the algorithm developed computational possesses a success to detect Melanomas of the one 87%, and to detect Lunar normal a success of the one 83%. You concludes that the automatic classification of Melanomas is possible, that that not this exempt of risks. Nevertheless the risk of the one 13% it could be paid with the attendance of a specialist in dermatology.
Study of dimension fractal, entropy and analysis of data for mammography’s with micro-calcification or tumor
In this work they were carried out studies with images of mammography’s where are presented Micro Calcifications (MC) or Tumors (T). The main objective was to identify the tumor area (Tarea) and Micro-Calcification (MC-area) of the rest of the mammography image, which we call area of the tissue (t-area), and to know its location, in an easy way and with a high precision. We associate two quantities to each area to be able to differentiate MC and T with the rest of the mammography: Dimension fractal (FD) and entropy of Shannon (S). They were calculated for the regions that belong to T or MC and fabric of the map of densities. What was obtained was that the values of FD, are bigger for MC-area and T-area, while t-area is smaller (Figures 9 and 10).
Figure 9: Area of the tumor.
Figure 10: Micro-calcifications.
The present work proposes one where it is possible to visualize the MC and T, by means of a code that requires some few seconds of work computational, simple and easy of using that it doesn't require but that to elevate to some power the intensity of each bin. You also confirm the identity of each brilliant area by means of the relationships of S and FD, and differ of the tissue by means of the value of or product of the histograms. They are three methods that help us to characterize and to isolate wicked T and MC in the mammography image.
In conclusion, it is a reliable method to find a MC or T in a mammography that doesn't depend but that of parameters characteristic of the image and not of the interpretation of the I prescribe radiologist, however it is not sought to substitute the paper of the I prescribe, but offering support in the I diagnose. The development of the method contributes in the early detection of the cancer of the mammaries, because among 30% and 50% of the cases diagnosed as cancer of mammaries at world level, they have been through the detection of MC. It is also a tool that provides objective information of the images that are analyzed and of the characteristics that can be extracted by means of the use of the programmed code of them, that is to say that by means of the use of the mathematics, we can identify MC and T in a mammogram.
Conclusion
The application of the fractal analysis to the digital prosecution of images prescribes it is of great utility for the medical community, since allows to make an diagnose but I specify of the different pathologies and of its possible evolution in the time, being in less treatments or but aggressive as they are the cases, what would propitiate an increase of the effectiveness of the treatment and for ended in the quality and hope of the patients' life.
References
- Panigrahy C, Seal A, Mahato NK (2019) Quantitative texture measurement of gray-scale images: Fractal dimension using an improved differential box counting method. Meas 147: 106859.
- Grizzi F, Castello A, Qehajaj D, Russo C, Lopci E (2019) The complexity and fractal geometry of nuclear medicine images. Mol Imaging Biol 21: 401-409.
[Crossref] [Google Scholar] [PubMed]
- Khobragade P, Fan J, Rupcich F, Crotty DJ, Schmidt TG (2018) Application of fractal dimension for quantifying noise texture in computed tomography images. Med Phys 45: 3563-3573.
[Crossref] [Google Scholar] [PubMed]
- Chaudhuri BB, Sarkar N (1995) Texture segmentation using fractal dimension. IEEE Transactions on pattern analysis and machine intelligence. 17: 72-77.
- Keller JM, Chen S, Crownover RM (1989) Texture description and segmentation through fractal geometry. Comput Vision, Graph, Image Process 45: 150-66.
- Backes AR, Bruno OM (2013) Texture analysis using volume-radius fractal dimension. Appl Math Comput 219: 5870-5875.
- Neil G, Curtis KM (1997) Shape recognition using fractal geometry. Pattern Recog 30: 1957-1969.
- Yu L, Zhang D, Wang K, Yang W (2005) Coarse iris classification using box-counting to estimate fractal dimensions. Pattern Recogn 38: 1791-1798.
- Sugihara G, May RM (1990) Applications of fractals in ecology. Trends Ecol Evol 5: 79-86.
[Crossref] [Google Scholar] [PubMed]
- Bhandari S, Choudannavar S, Avery ER, Sahay P, Pradhan P (2018) Detection of colon cancer stages via fractal dimension analysis of optical transmission imaging of Tissue Microarrays (TMA). Biomed Phys Eng Express 4: 065020.
- Yang X, Zhang R, Ma S, Yang X, Wang F (2019) Fractal dimension of concrete meso-structure based on X-ray computed tomography. Powder Technol. 350: 91-99.
- Rivero Borja MA, Escobar Martinez JE (2020) Use of c-means, k-means and fractal geometry segmentation methods in the in vivo study of lung cancer.
- Kikuchi A, Kozuma S, Yasugi T, Taketani Y (2004) Fractal analysis of surface growth patterns in endometrioid endometrial adenocarcinoma. Gynecol Obstet Inves 58(2):61-7.
[Crossref] [Google Scholar] [PubMed]
- Lee LH, Tambasco M, Otsuka S, Wright A, Klimowicz A, et al. (2014) Digital differentiation of non-small cell carcinomas of the lung by the fractal dimension of their epithelial architecture. Micron 67:125-131.
[Crossref] [Google Scholar] [PubMed]
- Vasiljevic J, Reljin B, Sopta J, Mijucic V, Tulic G, et al. (2012) Application of multifractal analysis on microscopic images in the classification of metastatic bone disease. Biomed Microdevices 14: 541-548.
[Crossref] [Google Scholar] [PubMed]
- Konatar I, Popovic T, Popovic N (2020) Box-counting method in python for fractal analysis of biomedical images. In 2020 24th International Conference on Information Technology (IT).
- Watanabe H, Hayano K, Ohira G, Imanishi S, Hanaoka T, et al. (2021) Quantification of structural heterogeneity using fractal analysis of contrast-enhanced CT image to predict survival in gastric cancer patients. Dig Dis Sci 66: 2069-2074.
[Google Scholar] [PubMed]
- Durrett R, Foo J, Leder K, Mayberry J, Michor F (2011) Intratumor heterogeneity in evolutionary models of tumor progression. Genetics. 188: 461-477.
[Crossref] [Google Scholar] [PubMed]
- Pries AR, Cornelissen AJ, Sloot AA, Hinkeldey M, Dreher MR, et al. (2009) Structural adaptation and heterogeneity of normal and tumor micro-vascular networks. PLoS Comput Biol 5: e1000394.
[Crossref] [Google Scholar] [PubMed]
- Gillies RJ, Schomack PA, Secomb TW, Raghunand N (1999) Causes and effects of heterogeneous perfusion in tumors. Neoplasia 1: 197-207.
[Crossref] [Google Scholar] [PubMed]
 Spanish
  Chinese
  Russian
  German
  French
  Japanese
  Portuguese
  Hindi
Hindi 

