Spanish
  Chinese
  Russian
  German
  French
  Japanese
  Portuguese
  Hindi
Hindi Research Article, Res Rep Metals Vol: 1 Issue: 2
Intermetallic Phase Precipitation in Duplex Stainless Steels: Considerations on the Use of Johnson-Mehl-Avrami-Kolmogorov Equation
Paolo Ferro1*, Alberto Fabrizi1 and Jan-Olof Nilsson2
1Department of Engineering and Management, University of Padova, Stradella San Nicola 3, 36100 Vicenza, Italy
2JON Materials Consulting, N. Hasselgatan 11, 811 35, Sandviken, Sweden
*Corresponding author: Paolo Ferro
Department of Engineering and Management, University of Padova, Stradella San Nicola 3, 36100 Vicenza, Italy
Tel: +39 0444 998769
Fax: +39 0444 998888
E-mail: ferro@gest.unipd.it
Received date: April 03, 2017 Accepted date: April 20, 2017 Published date: April 25, 2017
Citation: Ferro P, Fabrizi A, Nilsson J (2017) Intermetallic Phase Precipitation in Duplex Stainless Steels: Considerations on the Use of Johnson-Mehl-Avrami-Kolmogorov Equation. Res Rep Metals 1:2.
Abstract
Despite the great interest in intermetallic phase precipitation in duplex and super duplex stainless steels, a common controlling factor in the kinetics of its formation has not been reached yet. For example, when the time-evolution of sigma phase precipitation is described by the Johnson-Mehl-Avrami-Kolmogorov (JMAK) equation, or its modified forms, very different kinetic parameters were found in the literature, even if duplex stainless steels with very similar chemical composition and initial conditions are used in the experiments. In this work, some critical points that affect the evaluation of the kinetic constants and may cause erroneous interpretation of intermetallic phase precipitation (kinetics) are highlighted and discussed. It was shown that the choice of a high impingement coefficient in the modified JMAK equation leads to a significant improvement in experimental data description. A series of recommendations for the future application of the JMAK equation applied to intermetallic phase precipitation in duplex stainless steels are finally suggested.
Keywords: Duplex stainless steel; Sigma phase; Precipitation; Kinetics; Modeling
Introduction
A great number of studies have been conducted on the kinetics and microstructural evolution of intermetallic phases in duplex and superduplex stainless steels (DSS, SDSS) since their presence significantly influences the mechanical properties and corrosion resistance of the mechanical components. With particular attention to s phase, many authors have tried to assess the kinetic precipitation mechanism from the volume fraction variation as a function of time [1-8]. In those works, isothermal s phase time-evolution was generally described by the Johnson-Mehl-Avrami-Kolmogorov (JMAK) equation, which is formulated in the original paper by Avrami [9] as follows:
 (1)
(1)
Where, V is the fraction transformed at time t, B is a function of temperature and k is a constant varying between 1 and 4 and depending upon the nucleation and growth mechanism. Since then, many workers commonly write Eq. (1) as:
 (2)
(2)
where Veq is the equilibrium amount of transformed phase at temperature T, K is an overall rate constant and n is the Avrami exponent. This equation is universal if the assumed conditions in the model are not violated. However, such conditions are seldom obtained experimentally. In the JMAK model, the transformation is supposed to occur in an infinite medium and initiate by homogeneous nucleation with nuclei having a negligible initial radius. Nuclei grow isotropically at a constant rate and their growth stops at points of impingement whereas it continues unabated elsewhere. Theoretically, the JMAK equation can be applied in the case of continuous nucleation or site saturation, and for volume diffusion controlled growth or interface controlled growth. The model cannot be derived for a mixture of the nucleation models [10]. However, when the kinetics parameters are calculated with JMAK-like equations, the values of the JMAK exponent are very often between the expected values for site saturation and continuous nucleation [10].
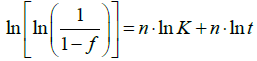
In order to extrapolate the kinetic parameters (n,K) from experimental data, Eq. (2) is often rearranged as follows:
 (3)
(3)
The phase transformation kinetics obeys the classical JMAK model when the evolution of ln[ln(1/(1-f))] as a function of ln(t) gives a straight line (Avrami plot).
When studying intermetallic phase precipitation, different authors [4,7,8] have found that a better interpolation of the experimental results is obtained by using a modified JMAK model [11]:
 (4)
(4)
where c (coefficient) is the impingement exponent used to correct some complex competing effects that may occur during precipitation such as: a) depletion of the solute content in the untransformed matrix due to competitive growth of the fraction products, b) direct collision of two advancing reaction products, or c) exhaustion of nucleation sites.
In addition to the theoretical restrictions of the JMAK model, there are also physical phenomena to take into account. Kinetic parameters of intermetallic phase precipitation are influenced by chemical composition [12], solution heat treatment [13] (and consequently primary phase proportion, phase and grain size), hot and cold working [14,15], as well as aging time and temperature. Although the analysis in the present paper refers to alloys within the specification of 2205 it is quite apparent that there are significant individual variations that cannot be ignored (Table 1). For instance, the alloy with the highest chromium content (22.87%) also exhibits the highest content of molybdenum (3.21%). Because both of these elements promote sigma-phase formation this particular alloy [8] is expected to be the one that is most unstable microstructurally. It is not surprising that very different JMAK kinetic parameters were found. For the above-mentioned reasons, a universal master model describing intermetallic phase precipitation is hardly deduced from literature data. Table 1 summarises the results obtained by different authors about the kinetics of sigma phase precipitation in a DSS 2205 starting from very similar initial conditions and aging temperatures of 1073 K (800°C) or 1123 K (850°C). Obviously, very different values of the Avrami time exponent were obtained.
| Authors | Chemical composition (wt%) of DSS 2205 | Te | Ts(°C),ts (min), (Vδ/Vγ) |
Ta(°C) | Tn(°C) | Veq | n | c | Q (KJ/mol) | Controlling factor in the formation of sigma phase | |||||||
|---|---|---|---|---|---|---|---|---|---|---|---|---|---|---|---|---|---|
| Cr | Ni | Mo | N | Mn | Si | C | Cu | ||||||||||
| Elmer et al.[1] | 22.43 | 4.88 | 3.13 | 0.18 | 0.14 | 0.67 | 0.023 | - | 860** | 1065,-,(54:46) | 850 | 800 | 24* | 7÷ 0.73 | 0 | 375÷466 | Nucleation |
| Radji et al. [4] | 22.65 | 5.01 | 2.19 | 0.13 | 1.21 | 0.29 | 0.03 | 0.21 | 1050,-,(51:49) | 850 | - | - | 1.4 | 0.3 | 98.91 | Diffusion (interface reaction) | |
| Magnabosco[3] | 22.2 | 5.70 | 2.98 | 0.16 | 1.6 | 0.44 | 0.016 | - | 940** | 1120,30,(41:59) | 850 | 850 | >54 | 1 | 0 | 185 | Grain Boundary Cr diffusion |
| Ferro and Bonollo[2] | 22.87 | 5.11 | 3.21 | 0.17 | 1.55 | 0.43 | 0.02 | 0.38 | 915 | 1050,30,(56:44) | 850 | 868 | 25 | 0.97 | 0 | - | Site Saturation |
| Lara et al. [5] | - | - | - | - | - | - | - | - | - | - | 800 | - | - | 0.77 | 0 | - | - |
| Momeni and Dehghani[14] | 21.23 | 6.55 | 3.03 | - | 0.024 | 0.87 | 0.02 | - | - | 1150,20,(47:53) | 800 | - | 25 | 1 | 0 | - | Site Saturation |
| Calliari et al. [26] | 22.75 | 5.04 | 3.19 | 0.16 | 1.46 | 0.56 | 0.03 | - | - | 1050,30,(49:51) | 850 | - | 25 | 4.11 | 0 | - | Grain Boundary diffusion |
| Sieurin and Sandstorm [30] | 21.46 | 5.5 | 2.98 | 0.16 | 1.46 | - | - | - | 930** | - | - | 865 | - | - | - | - | Diffusion of Mo |
| Calucio Dos Santos and Mafnabosco[32] | 22.07 | 5.68 | 3.20 | 0.17 | 1.38 | 0.34 | 0.017 | 0.15 | 960** | 1175,30, (57:43) | 850 | 850 | ~28% | 1.42;0.22 | 0 | 341;24 | Diffusion of Mo (σ nucleation) |
Table 1: Kinetic parameters related to sigma phase precipitation in a DSS 2205.
Other than theoretical and physical aspects, such anomalies may be due to uncertainties in the experimental data or to an incorrect use of the model as well. The first ones are associated with the experimental procedure (i.e.: difficulties in obtaining a rapid heating to the aging temperature or errors associated with intermetallic phase quantification methodology (e.g. Optical Microscope (OM), Scanning Electron Microscope (SEM), thermoelectric power [5], Electron Backscatter Diffraction (EBSD)). The incorrect use of the model may be related to the violated conditions of validity [16-20] as well as the inappropriate choice of the kinetic model (i.e.: Eq. (2) instead of Eq. (4)) [21] or an erroneous formulation of the model itself [22].
In this paper the possible causes of these anomalies are highlighted and a series of recommendations for the future application of the JMAK equation to intermetallic phase precipitation in DSS and SDSS are suggested. Some of these recommendations are already mentioned in the literature, others have not yet been taken into account. The aim of this work is to collect in a single paper the main critical issues related to the use of the JMAK equation in order to improve, in the future, the experimental data interpretation with particular attention to secondary phase precipitation in DSS and SDSS. As an example, in the final part of the paper it is shown that, by using an appropriate model for s phase precipitation and experimental data taken from the work of Elmer et al. [1], the value of the Avrami coefficient (n) can be reinterpreted (compared to the conclusions deduced by Elmer at al. [1]) and found more in agreement with the theoretical values (n=1÷4).
Theoretical Analysis
When the kinetics of intermetallic phase precipitation is studied in the frame of the JMAK theory or its modifications, the kinetic parameters are obtained by interpolating experimental results (f(t)) with Eq. (3) or its modified forms [4]. In the following paragraphs each parameter of the JMAK equation is analysed and discussed. All experimental data with particular reference to the kinetics of sigma phase precipitation in DSS 2205 are taken from literature.
Equilibrium amount of transformed phase at temperature T (Veq)
The use of Eq. (3) requires knowledge of the equilibrium amount of transformed phase at temperature T (Veq) and the time needed to reach it (Eqs. (2) and (3)). However, such parameters are often uncertain. First of all it is not always explicitly mentioned whether the equilibrium fraction of sigma-phase is that defined by the composition of ferrite or the overall composition. If the austenitic phase is not included in the calculations, the redistribution of nitrogen, which is very fast, is neglected. Although the role of nitrogen has not been investigated in detail it is highly likely that it plays an important role in the formation of sigma-phase.
The Veq value depends significantly on chemical composition of the alloy [12] and temperature. At temperature T=1123 K (850°C), thermodynamic calculations by means of Thermo-Calc© (TCFE8 database), give a value of Veq ≈ 24 pct. (against a value of 30 pct. obtained after 360 h of aging [31]). Previous calculation of the phase equilibria showed a value of Veq(1123 K (850°C)) ≈ 20 pct by using an earlier and a different version of ThermoCalc [1,3]. Even when such a parameter (Veq) is obtained by means of experimental tests, the measured values differ from thermodynamic calculations and from each other. For example, Magnabosco [3] obtained a value of Veq(1123 K (850°C)) ≈ 54 pct. He suggested that equilibrium was not reached at the studied temperatures even considering the long-term aging applied. Other researchers found values of about 25 pct (Table 1) by relative short-term aging (~10 h) and by a not specified estimation method [1]. Theoretically, by using the Avrami plot (Eq.3) and data of intermetallic phase volume fraction obtained by shortterm aging, it would be possible to extrapolate the value of Veq and the time needed to reach it. However it is not always possible to use such a methodology because data do not always follow the linear trend of the Avrami plot [1,4]. In those cases, the impingement exponent c should be known a priori.
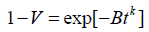
Some uncertainties about the value of Veq may depend on the methodology of investigation used (i.e.: SEM, EBSD, standard metallography) [23]. In particular, uncertainties on intermetallic phase quantification are strongly reduced if Z contrast mode-SEM (Z=atomic number) or EBSD techniques are used instead of standard metallography (image analysis applied to optical micrographs) [24-26]. If the corrosion products of the etchant enhance the contours, the image analysis overestimates the areas; while, if the intermetallic phase is not completely etched, image analysis underestimates the corresponding areas. Similar effects were observed when analysing sigma-phase in an austenitic stainless steel of type 347 [27] and is equally applicable in duplex stainless steels. In the present work, by using ten SEM micrographs at 1000X on unetched samples processed by ImageJ software, it was found that after 27 h at 1123 K (850°C) the sigma transformation is not yet completed (Figure 1); after 504 h ferrite completely disappeared and a value of V equal to 27.8 ± 0.5 pct. was obtained (DSS 2205 chemical composition: Cr 22.56, Ni 5.32, Mn 0.84, Mo 2.9, C 0.029, Si 0.34, Fe Bal. (wt%)). It can be observed that this value is close to the standard value assumed in the literature (25 pct., Tab. 1) and that was obtained after long-term aging [3]. From the above considerations it can be understood that a common value of Veq(T) has not yet been reached. Even if slight variations in alloy chemical composition may result in a high variation in the Veq value, further investigations and theoretical consideration seem necessary to obtain coherent and realistic values of such a parameter as a function of temperature.

Figure 1: Micrographs of 72h-aged 2205 DSS sample: a) EBSD phase map: sigma (yellow), austenite (red), ferrite (green); b) BSE-SEM micrograph: sigma (white); after polishing with colloidal silica, twins within γ-austenite grains can be seen.
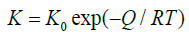
The rate constant (K) and the activation energy (Q)
In the literature, the JMAK equation is used by some authors [2,3,5,6,14] in its original form (Eq. (2)) [9] and by others authors [1,4,7] in the following form:
 (5)
(5)
where it can be noted that now K is squared to n and thus Eq. (3) becomes:
 (6)
(6)
At constant temperature, if it is assumed that the Avrami exponent n does not vary in time, n and K are constants. Consequently, the interpolation of experimental data with Eq. (3) or (6) does not affect the value of n; however, by using alternatively Eq. (3) or (6), different values of K are expected. In particular, the values obtained will differ by a constant. This could result in an error if the constant K is used to calculate the activation energy (Q) of the precipitation process by the following equation:
 (7)
(7)
where K0 is the pre-exponential factor, Q is the activation energy and R is the gas constant.
The use of an Arrhenius-like temperature dependence for the rate constant has been assumed several times [1,3,4], without motivation. Since the values of K were calculated with both Eq. (3) and Eq. (6), errors in the calculation of Q and erroneous interpretations of the precipitation mechanism of intermetallic phase are present in literature. In a recent work on σ phase dissolution in a DSS 2205 [28], it was found that if the activation energy was calculated by assuming the dependence of K by the exponent n, the activation energy value for σ phase dissolution was very close to the activation energy of Cr grain boundary diffusion; otherwise, the calculated values was an order of magnitude higher than the previous one and thus without physical significance. Consequently, it seems reasonable that the correct value of K is obtained by using Eq. (5) instead of Eq. (2).
Furthermore, it should be recognised that, in the case of intermetallic phase precipitation, the use of an Arrhenius-like temperature dependence for the rate constant is problematic if the undercooling is small. The rate of nucleation ( ) of sigma particles is given by:
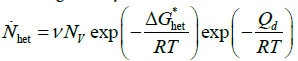 (8)
(8)
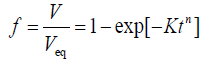
where ν is a vibration frequency factor, Nv is the total number of heterogeneous nucleation sites per unit volume, ΔG*het is the energy barrier against nucleation and Qd is the activation energy for the atomic migration across the nucleus/matrix interface. Now,  can be approximated as A/ΔT2 [10], where A is a constant and ΔT is the undercooling or overheating with respect to the temperature at which the two phases are in equilibrium. Conversely to intermetallic phase dissolution, during intermetallic phase precipitation the nucleation rate is highest at an intermediate temperature (due to the competitive influence of undercooling (driving force) and diffusivity on the reaction kinetics) (Figure 2).

Figure 2: Schematic representation of the nucleation frequency during precipitation and dissolution phenomena.
It means that the characteristic C-shape of time-temperaturetransformation (TTT) curves for precipitation cannot be modelled by substituting Eq. (7) in Eq. (5). Despite this, different authors used Eq. (7) for the calculation of Q without specifying the limits of applicability of that formula [3,4].
Now, if it is supposed that during the early stage of intermetallic phase precipitation, the reaction rate is controlled by the nucleation rate ( ), the time taken to precipitate a certain fraction of intermetallic phase (t*) is inversely proportional to [29]:
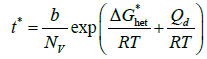 (9)
(9)
where b is a kinetic constant. By taking the natural logarithm on both sides of Eq. (9), the following equation is obtained [29]:
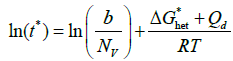 (10)
(10)
By plotting ln(t*) vs 1/T, a C-curve is obtained with well-defined asymptotes. At high undercooling, ΔG*het is negligible and the slope of the curve becomes constant and equal to Qd/R. Starting from the experimental C-curve, it is thus possible to calculate Qd. By using this method, Elmer et al. [1] calculated values of Qd for σ phase precipitation significantly higher than the activation energy for Cr and Mo diffusion as obtained by others authors [3,30]. They concluded that nucleation is likely a controlling factor in the formation of sigma. This is consistent with the observation that there is no well-defined orientation relationship between sigma and the ferritic matrix [31] and the fact that chi-phase, which is isomorphous with the matrix and therefore nucleates much more easily, often provides necessary nucleation sites for sigma-phase. It should be added that the ability to form chi-phase is a strong function of the composition, a circumstance that complicates comparisons even further. However, this method could be dependent on the number of discrete experimental points used to model the shape of the C-curve. As a matter of fact, the asymptote slope may vary accordingly.
Most experimental work of this kind has been performed by cooling down to room temperature before the ageing treatment. Because of the experimental limitations rather few investigations have employed ageing immediately after solution treatment, thereby avoiding cooling and subsequent heating. The former situation builds up more nuclei and, therefore, enhances the kinetics. This circumstance also leads to difficulties when comparing results from different sources.
The time exponent (n) and the impingement exponent (c)
Despite the use of DSS 2205 samples with similar composition and microstructure (prior to the aging heat treatment), different values of the Avrami exponent were obtained in the literature (Table 1). This is partly due to the dependence of n on many parameters related to the initial conditions of the material (i.e.: austenitic/ferritic grain size, solution time and temperature); partly to the difficulties inherent in the isothermal test execution. For example, the time to reach the isothermal temperature is critical and the use of small samples and salt bath is therefore crucial. De facto, the Avrami exponent calculation by using Eq. (5) and data obtained with short aging heat treatments may be significantly influenced by the experimental methodology used.
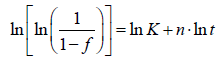
About sigma phase precipitation, the Avrami coefficient was found both constant [2-4] and variable during the isothermal aging [1,32]. In this last case, it was suggested that the variation of the local Avrami coefficient n(f) is due to a change in the transformation mechanism. However, as observed by Wang et al. [21], a changing kinetic exponent may result from inappropriate use of kinetic model. At T=1123 K (850°C), Elmer at al. [1] found that the local Avrami exponent varies from 0.7 to 7 (Figure 3a). They thus suggested that the mechanism for the transformation is changing as the transformation proceeds. However, by means of Eq. (4), it is easy to verify how it is possible to linearize the experimental results by Elmer et al. [1] in a plot ln[((1-f)-c-1/c)] versus ln(t). The values of n (≈ 4) were found to have only a slight dependence on temperature (Figure 3b).

Figure 3: JMAK plot of the sigma phase fraction: a) from JMAK equation (c=0) [1], b) from modified JMAK equation (c=6.75, (T=973-1023 K (700-750°C)), c=10 (T=1073-1123 K (800-850°C)), n(700°C)=4.23, n(1023 K (750°C))=5.5, n(1073 K (800°C))=4.65, n(1123 K (850°C))=4.15 ).
In order to linearize the experimental results by Elmer et al. [1], high values of the impingement coefficient c were found in this work compared to those found in literature about sigma phase precipitation (c=10 against c=0.3 [4]). It is however clear that the experimental results by Elmer et al. [1] are very different from those obtained by other authors in literature (Table 1) and deeper investigations may be necessary for a better comprehension of σ phase precipitation kinetics.
From the above observations, the following generalised JMAK model is thus suggested:
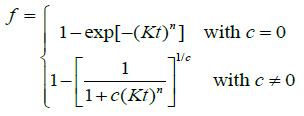 (11)
(11)
Conclusions
Intermetallic phase precipitation in DSS 2205 is influenced by many factors such as the initial alloy conditions, e.g. austenitic/ferritic grain size, primary phases balance, ageing temperature and heterogeneous nuclei distribution. For this reason it seems unlikely that a universal master model on the formation of intermetallic phase can be achieved. However, when the kinetic mechanism of intermetallic phase precipitation is assessed by means of the JMAK equation, some recommendations are suggested in order to correctly interpret the experimental results:
With particular reference to σ phase, the equilibrium amount of transformed phase at temperature T (Veq) should be obtained by very long aging heat treatments.
The general formulation of JMAK equation should be used (Eq. (11)).
When the rate constant K is used to calculate the activation energy (Q), it should be squared to n in the JMAK formulation.
In case of sigma phase precipitation, the activation energy should be calculated by using only experimental data at sufficiently low temperatures.
The amount of intermetallic phase, if calculated by means of image analysis, should be obtained by using EBSD or SEM micrographs of unetched samples.
The use of small samples and salt bath is recommended in order to reduce the time to reach the isothermal temperature, especially when volume fractions of intermetallic phase at short aging times have to be measured.
References
- Elmer JW, Palmer TA,Specht ED (2007) Direct observations of sigma phase formation in duplex stainless steels using in-situ synchrotron x-ray diffraction. Metall Mater TransA 38: 464-475.
- Ferro P, Bonollo F (2012) A semiempirical model for sigma-phase precipitation in duplex and superduplex stainless steels. Metall Mater TransA 43: 1109-1116.
- Magnabosco R (2014) Kinetics of sigma phase formation in a duplex stainless steel. Mat Res 12: 321-327.
- Badji R, Kherrouba N, Mehdi B, Cheniti B, Bouabdallah M, et al. (2014) Precipitation kinetics and mechanical behavior in a solution treated and aged dual phase stainless steel. Mater Chem Phys 148: 664-672.
- Lara NO, Ruiz A, Rubio C, Ambriz RR, Medina A (2011) Nondestructive assessing of the aging effects in 2205 duplex stainless steel using thermoelectric power. NDT&E International 44: 463-468.
- Wilson A, Nilsson JO (1996) Modelling the CCT-diagram of intermetallic phase precipitation in duplex stainless steels from isothermal experiments. Scand J Metall 25: 178-185.
- Badji R, Bouabdallah M, Bacroix B, Kahloun C, Bettahar K, et al. (2008) Effect of solution treatment temperature on the precipitation kinetic of s-phase in 2205 duplex stainless steel welds. Mater Sci Eng 496: 447-454.
- Ferro P, Bonollo F, Timelli G (2012) Sigma phase precipitation modelling in a UNS S32760 superduplex stainless steel. Metall Ital 5: 7-12.
- Avrami MJ (1939) Kinetics of phase change. I general theory. ChemPhys 7: 1103.
- Kempen ATW, Sommer F, Mittemeijer EJ (2002) Determination and interpretation of isothermal and non-isothermal transformation kinetics: the effective activation energies in terms of nucleation and growth. J Mater Sci 37: 1321-1332.
- Lee ES, Kim YG (1990) A transformation kinetic model and its application to Cu-Zn-Al shape memory alloys–I. Isothermal conditions. Acta metal Mater 38: 1669-1676.
- Huang CS, Shih CC (2005) Effects of nitrogen and high temperature aging on s phase precipitation of duplex stainless steel. Mater Sci Eng 402: 66-75.
- Kashiwar A, Vennela NP, Kamath SL, Khatirkar RK (2012) Effect of solution annealing temperature on precipitation in 2205 duplex stainless steel. Mater Charact 74: 55-63.
- Momeni A, Dehghani K (2010) Effect of Hot Working on Secondary Phase Formation in 2205 Duplex Stainless Steel. J Mater Sci Technol 26: 851-857.
- Cho HS, Lee K (2013) Effect of cold working and isothermal aging on the precipitation of sigma phase in 2205 duplex stainless steel. Mater Charact 75: 29-34.
- Liu F, Yang CL, Yang GC, Li JS (2007) Deviations from the classical Johnson-Mehl-Avrami kinetics. J Alloy Compd 560: 326-330.
- Liu F, Yang G (2007) Effects of anisotropic growth on the deviations from Johnson-Mehl-Avrami kinetics. Acta Mater 55: 1629-1639.
- Levine LE, Narayan KL, Kelton KF (1997) Finite size corrections for the Johnson-Mehl-Avrami-Kolmogorov equation. J Mater Res 12: 124-132.
- Sun NX, Liu XD, Lu K (1996) An explanation to the anomalous Avrami exponent. Scripta Mater 34: 1201-1207.
- Todinov MT (2000) On some limitation of the Johnson-Mehl-Avrami-Kolmogorov equation. Acta Mater 48: 4217-4224.
- Wang J, Kou HC, Gu XF, Li JS, Xing LQ, et al. (2009) On discussion of the applicability of local Avrami exponent: errors and solutions. Mater Lett 63: 1153-1155.
- Khanna YP, Taylor TJ (1988) Comments and recommendation on the use of the Avramiequation for physico-chemical kinetics. Polym Eng Sci 28: 1042-1045.
- Michalska J, Chmiela B (2014) Phase analysis in duplex stainless steel: comparison of EBSD and quantitative metallography methods. Mater Sci Eng 55: 1-9.
- Breda M, Pellizzari M,Frigo M. (2015) σ-Phase in lean duplex stainless steel sheets sin. Acta Metall Sin Engl 28: 331-337.
- Ferro P, Fabrizi A, Bonollo F (2016) Non-isothermal dissolution modelling of sigma phase in duplex stainless steels. Acta Metall Sin Engl 29: 859.
- Calliari I, Zanesco M, Ramous E (2006) Influence of isothermal aging on secondary precipitation and toughness of a duplex stainless steel SAF 2205. J Mater Sci 41: 7642-7649.
- Erneman J, Nylöf L, Andrén HO, Nilsson JO (2004) Quantitative metallography of sigma phase precipitates in AISI 347 stainless steel: a comparison between different methods. J Mater Sci Technol 20: 1245-1251.
- Ferro P (2013) A dissolution kinetics model and its application to duplex stainless steels. Acta Mater 61: 3141-3147.
- O. Grong (1994) Metallurgical modeling of welding. The Institute of Materials, London.
- Sieurin H,Sandström R (2007) Sigma phase precipitation in duplex stainless steel 2205. Mater Sci Eng 444: 271-276.
- Gregori A, Nilsson JO (2002) Decomposition of ferrite in commercial superduplex stainless steel weld metals: microstructural transformations above 700°C. Metall Mat Trans A 33A: 1009-1018.
- Dos Santos DC, Magnabosco R (2016) Kinetic study to predict sigma phase formation in duplex stainless steels.Metall Mat TransA 47: 1554-1565.