Research Article, J Ergon Res Vol: 1 Issue: 2
Investigating the Usability of a User Interface for Display of an Electro Vehicle in a Driving Simulation
Hamed Salmanzadeh1, Mohammad Pishnamazzadeh1, Seyed Reza Mirmajlesi1, Yaser Samimi1 and Kurt Landau2*
1Department of Industrial Engineering, K.N. Toosi University of Technology, Tehran, Iran
2École de Technologie Supérieure (ÉTS) - Montréal, Canada
*Corresponding Author : Kurt Landau
Associate professor, École de Technologie Supérieure (ÉTS) - Montréal, Canada
Tel: 06151 16-23100
E-mail: office@ioa-online.at
Received: December 19, 2017 Accepted: December 22, 2017 Published: February 12, 2018
Citation: Salmanzadeh H, Pishnamazzadeh M, Mirmajlesi SR, Samimi Y, Landau K (2018) Investigating the Usability of a User Interface for Display of an Electro Vehicle in a Driving Simulation. J Ergon Res 1:2.
Abstract
One of the main aspects of each product is the user satisfaction of its usability. User satisfaction is led as the physical and mental efforts are minimized. In this paper, a driver interface is designed that can handle both auditory and visual alarms. This interface is used for warning drivers about the remained battery in the electrical engine. A driving simulator is used for evaluating the usability of driving while using this interface. The key index of the usability is a driver’s stress, when uses this interface under different situations. For data gathering, this interface is used in 12 experiments which each one consists of four steps with two active variables. These variables are alarm types and traffic congestion that change during simulation. The participants’ satisfaction is evaluated and the results show that there is a relationship between the usability and active variables.
Keywords: Internal combustion engines; Electric vehicles; Driving Simulation; User Interface; Musculoskeletal disorders; Moment balance; Compressive forces
Introduction
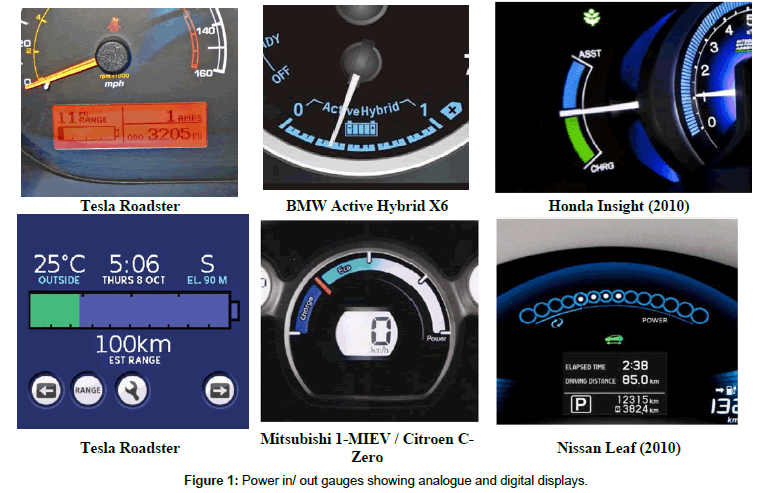
In order to compensate the scarcity of fossil fuels and reduce the negative environmental impact of their emissions, the automobile industry is facing a transition from internal combustion engines (ICEs) to electric vehicles (EVs). In upcoming days, we can expect more than half of fuel vehicle will likely to be replaced by electric vehicle [1]. But there are currently some adoption problems. These barriers include high initial cost, Lack of battery charging infrastructure and slow recharging. Improvements in rapid recharging and storage capacity are acute issues for developers in order to increase the range and decrease the battery size. The emergence of this type of vehicle created new concepts for drivers such as charging duration [2]. Current battery technology only allows for a limited range, depending on the size and design of the vehicle. This range varies between 60 and 200 km, which are 3-4 times less than ICE vehicles [3]. A big concern for the new drivers is running out of charge in the middle of a trip [4]. Thus the prediction and displaying of the range of charge is important to know how much capacity remains in the battery, also known as its state of charge (SOC) [5]. Concerning importance of monitoring the SOC in electric vehicles, the drivers have to spend more time to focus on display while the main visual related task of driver is the monitoring of the road event. The more time spending on secondary tasks (like monitoring of displays) may lead to distraction and mental workload of driver. The majority of EVs have some type of power in/ out gauge. Some vehicles also have a power in/out gauge in addition to an RPM gauge, where they are present; virtually over 70% of the displays are analogue using familiar needle and dial displays (Figure 1). In general, from resting needle position, clockwise needle movement indicates energy being used and anticlockwise needle movement indicates energy being recovered. Some, like the BMW Active E concept only shows power being used, closely mirroring the function of a rpm range. Digital displays which give exact values provide some advantage such as a quicker reading times and fewer errors in reading, but analogue displays can enable the user to make a quick qualitative assessment and easily convey the difference between current and target values. Many users prefer the simplicity of analogue dials [6].
In order to achieve a high safety and comfort in EVs, the driver’s workload should be kept within reasonable limits using an easy to use and modern interface design. Recent technologies enable the use of auditory and haptic systems as alternatives for visual systems to avoid of distraction in vehicle displays. Auditory warning signals can improve the performance and reduce accidents when they are employed successfully in a practical environment. They have an advantage over visual warning and displays in that they usually capture people’s attention regardless of where they are looking [7]. Moreover, voice is more expressive and efficient than text, as it places less cognitive demand on the speaker and permits more attention to be devoted to the content of the message. However, the use of urgent auditory icons may be further limited by the fact that these icons have been perceived to convey a high degree of urgency, so they may be considered unpleasant for the drivers [8]. One potentially interesting class of auditory warning signals is constituted of speech warnings. Verbal warning signals have the advantage that minimal training is required to an operator who understands the language to comprehend and act upon them efficiently [9]. Given that while driving, a person may be involved in other concurrent speech tasks such as conversing with the passenger or on the mobile phone, and/or listening to the radio, the utility of in-car speech warnings (particularly directional signals such as those given by navigation systems) may be somewhat limited [10-13]. Recent laboratory-based research has provided extensive evidence for the existence of crossmodal links in spatial attention among different sensory modalities, such as audition and vision [14]. In particular, researchers suggest that the efficiency of human multisensory information processing can be enhanced by presenting relevant information to different senses from approximately the same spatial location [15,16]. Cross- modal links in spatial attention have now been found among all possible combinations of auditory, visual, and tactile stimuli [15]. This paper is concerned with the study of usability for a horizontal display to monitor the SOS in electrical vehicles under driving simulator. But the problem of multisensory displays is that, the human are inherently limited capacity creatures and they are able to process only a small amount of sensory information at the moment [17]. In this study, the usability of visual display, auditory signals and the combination of both systems are investigated under different scenarios.
Literature Review
Since the usability criteria are different in various systems, there is not a unique accepted definition of usability, however, there have been many useful definitions provided by Bevan, Nielsen, Norman, Shakel and Shneiderman [18,19,20,21,22,23]. One of the most popular definitions of usability is provided by International Organization for Standardization (ISO): the extent to which a product can be used by specified users to achieve specified goals with effectiveness, efficiency and satisfaction in a specified context of use [24]. To present a framework for usability evaluation for in vehicle information system, Harvey et al. focus on the selection of the appropriate evaluation methods [25]. At the first point, they classified the past methods into two categories: desktop and experimental. Desktop methods (Like SHEPRA, CPA, and HTA) are mostly verifying concepts. Then with the experimental methods, predictive values can be verified. After presenting this process, they tested some methods of the literature on vehicle information system samples. Gaspar et al. Present a user satisfaction classifies and modeling framework with the objective of contributing to a more informed design process [26]. This paper tried to define user satisfaction dimension in an automotive audio interface and then relation between them and perceived product attributes. At the first step, they have collected user preferences in different products. Then, they analyzed the data for determining the dimensions of the user satisfaction and the relationship between dimensions and product attributes. They analyzed the gathered data by principal component analysis. Huth et al. proposed a paper aiming at experiment a system for motorcyclists that warn them when they approach a curve with inappropriate speed [27]. Moreover, this system will capture the GPS information and predict the speed in curves and it can also calculate the maneuvering space through the curve. When this level reaches a determined threshold, it emits a warning. Two methods are used for warning motorcyclists. In the first setup, using a force feedback throttle, the alert is transmitted to it and then is applied to the gas handle. In the second setup, the right glove transmits the warning signal by vibration applied to the rider’s wrist. After data gathering, riders were asked to fill a questionnaire and to choose which ride they had preferred and which ride had been the safest. Green described the overload and distraction problem for drivers [28]. He classified distractions and then described standards which can be used for designing Human Machine Interfaces. Graham said that regarding to the lack of the experimental study about auditory warnings, an experimental study can approve past articles [29]. He investigated the response time in an auditory warning comparing to the non-auditory ones. He chose some emergency warnings regarding to human factors and used them in emergency scenarios. In addition, the response time was calculated by coding of the brake pedal. Graham found that the emergency system improves the response time of the drivers, while age and sex did not affect the response time. In order to determine the user satisfaction and feeling about vehicle dashboard displays, Smith and Fu present a paper focusing on designing images more than hardware [30]. However, improving the design of displays will result to an effective and safe driving. So this paper aims at investigate the relationship between displays and drivers. They analyzed the data using the Quantity Theory. Cabral, et al., aimed at observing the first impression of drivers as regards driving between two speed limits by using natural audio warning [31]. They also investigated driving under time pressure. If speed was not between the limits an auditory warning would be heard. The results show that the auditory warning is efficient. McIlroy & Stanton presented an experimental evaluation of multisensory, Eco driving support tool, designed to discourage harsh acceleration and to encourage maximization of coasting phase of the vehicle when coming to an event slowing or stopping [32]. They designed three different alarms consist of auditory, visual and haptic. Lenné et al., investigated the driver behaviors at two railway crossing with active control include a stop sign, flashing red light and traffic signal [33]. Considering the share of the electric vehicle in the market and importance of battery in EVs, in this paper the usability of a driver interface for battery will be investigated which can handle both visual and auditory alarms by considering elements such as traffic and alarm type. In this paper, a battery gage is designed to evaluate the drivers’ stress under different circumstances during a driving simulation. The considered elements include traffic and the alarm types of remained battery. For data gathering, a number of subjects (drivers) are chosen in order to participate in the experiment. The aim of this paper is to evaluate the stress of drivers by asking them to check the remained battery of the engine. This procedure is analyzed under different situations of driving. Checking the remained battery can be executed using one of the alarm types including: auditory, visual, and visual and auditory.
Methods
In order to simulate the real hazards in driving, a simulator is used to evaluate the reaction of drivers under different circumstances. The simulator simulates an electric engine in which a battery gage is incorporated that shows the remained battery during the simulation time. A steering wheel, gas pedal and a manual gear are put on the driving simulator to enhance the reality of the simulation. Moreover, the traffic changes during the simulation. Drivers can be aware of the remained battery using three different ways:
• Visual
• Auditory
• Visual and Auditory
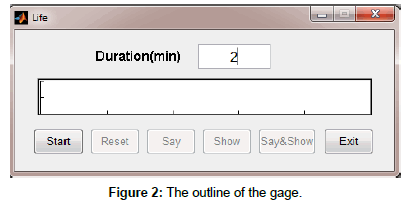
The outline of the battery gage is shown in Figure 2. MATLAB (2013) is used for designing it.
According to Figure 2, 6 push buttons are incorporated in the panel. The simulator manager can enter the duration in terms of minute in the blank space at the top of the panel. After that, the simulator manager should push the “Start” button on the gage to start the process, as Figure 3.
Based on Figure 3, at the beginning of the process the gage is in green. Subjects can push three buttons in order to be aware of the amount of the remained battery. After the process is started, the subject can push “Say” button and as a result, the gage will express the value of the remained battery in an auditory way. When the subject pushes the “Show” button, the gage will show the value of the remained battery in a separate box like Figure 4.
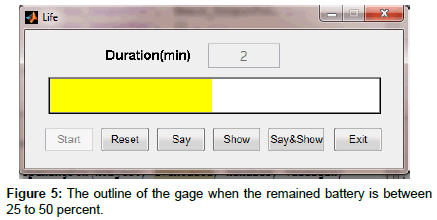
When the subject pushes “Say and Show” button, the gage will express the value of the remained battery in both auditory and visual ways. Some options are added to the proposed gage to simplify the usability. When the remained battery reaches to 50 percent, the color of the gage will be changed to yellow, as Figure 5.
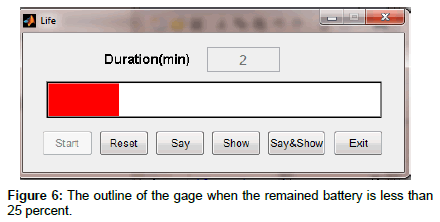
Moreover, when the remained battery reaches to 25 percent, the color will be changed to red, as Figure 6.
At the end of the process, when the time is finished, a warning alarm can be heard. The subjects are chosen randomly. They are asked to start the process using the simulator. In this paper, the simulation procedure consists of four steps:
1. Stopping before driving: The subject is asked to get on the simulator. After a while, the simulator manager asks the subject to use a predefined alarm type in order to be informed about the remained battery. Then the subject is asked to assign two integer scores: first) in a range between 1 (technicality) and 7 (humanity) to this question: “which score do you assign to this alarm type in terms of humanity or technicality?” and second) in a range between 1 (not efficient) and 7 (efficient) to this question: “which score do you assign to this alarm type in terms of efficiency?”. Note that efficiency is supposed to be the summation of the performance and effectiveness in each step.
2. First time driving: The subject is asked to drive during which the simulator manager asks the subject to use a predefined alarm type in order to be informed about the remained battery. After that, similar to step 1, the subject is asked to assign scores to the alarm type in terms of efficiency and ergonomic design.
3. Stopping after driving: Simulator manager asks the subject to stop. After a while, the subject is asked to use a predefined alarm type in order to be informed about the remained battery. Then similar to step 1, the subject assigns scores to the alarm type.
4. Second time driving: The subject starts to drive again. The simulator manager asks the subject to declare the remained battery using a predefined alarm type and to assign scores, similar to step 1, to the alarm type.
This experiment is repeated 12 times in which the sequence of alarm types is changed for each step based on Table 1.
| Experiment | Type of alarm | Traffic Congestion | |||
|---|---|---|---|---|---|
| 1st step | 2nd step | 3rd step | 4th step | ||
| 1 | Auditory | Visual | Visual and Auditory | Auditory | ✔ |
| 2 | Visual | Visual and Auditory | Auditory | Visual | ✔ |
| 3 | Visual and Auditory | Auditory | Visual | Visual and Auditory | ✘ |
| 4 | Auditory | Visual | Visual and Auditory | Auditory | ✘ |
| 5 | Visual | Visual and Auditory | Auditory | Visual | ✘ |
| 6 | Visual and Auditory | Auditory | Visual | Visual and Auditory | ✔ |
| 7 | Auditory | Visual | Visual and Auditory | Auditory | ✔ |
| 8 | Visual | Visual and Auditory | Auditory | Visual | ✔ |
| 9 | Visual and Auditory | Auditory | Visual | Visual and Auditory | ✘ |
| 10 | Auditory | Visual | Visual and Auditory | Auditory | ✘ |
| 11 | Visual | Visual and Auditory | Auditory | Visual | ✘ |
| 12 | Visual and Auditory | Auditory | Visual | Visual and Auditory | ✔ |
Table 1: The sequences of the alarm types in each experiment.
To reduce the active variables, according to Table 1, the sequence of these 12 experiments is considered the same for all subjects.
Numerical Analysis
In this paper, the subjects are chosen randomly (10 Males and 10 females) with the following aging distribution:
• 22 years old: 4 persons
• 23 years old: 2 person
• 24 years old: 8 persons
• 25 years old: 4 persons
• 27 years old: 2 person
The subjects are asked to drive in 4 steps including: before driving, first time driving, stopping after driving and second time driving which are described as follows.
Before driving
After a subject gets on the simulator, s/he is asked to use one of the predefined alarm types in order to be informed about the remained battery. Then s/he assigns a score to the alarm type in terms of being humanity or technicality. This step is incorporated in the experiment in order to make subjects familiar with the experiment procedure and alarm types. A descriptive analysis on the scores allocated to the 1st step (before driving) by the subjects is shown in Table 2.
| Gender, Alarm Type | Average of Point |
|---|---|
| Female | 4.19 |
| Auditive | 4.11 |
| Visual | 4.33 |
| Visual & Auditive | 4.08 |
| Male | 4.71 |
| Auditive | 4.38 |
| Visual | 4.69 |
| Visual & Auditive | 5.00 |
| Total | 4.19 |
Table 2: The scores of the 1st step (ergonomic design).
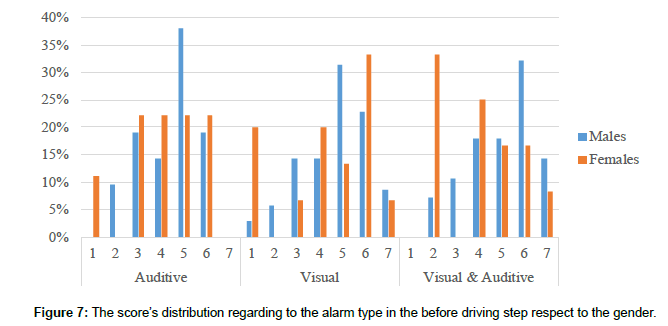
As shown in Table 2, males prefer visual and auditive alarm among the alarm types in the 1st step. However, females prefer visual alarm type. The average score for whole subjects is 4.56 out of 7. This average is 4.19 out of 7 for females and 4.71 for males. Hence, the average scores of males is more than females’ ones which is be investigated in Figure 7. The traffic congestion is not considered in this step since the subjects are supposed to become familiar with the system.
An important issue in this section is the distribution of scores in order to investigate the relationship of variables. Regarding to Figure 7 the mode of the community, as an important index, can be determined. Mode is the value that appears most often.
According to Table 3, females allocate higher scores than males so the average score for females is more than males. In the view of efficient design of the alarms, scores assigned from the subjects are shown in Table 4.
| Gender, Alarm Type | Mode ( Point that appears most often) |
|---|---|
| Female | 6 |
| Auditive | 3 , 4 , 5 and 6 |
| Visual | 6 |
| Visual & Auditive | 2 |
| Male | 5 |
| Auditive | 5 |
| Visual | 5 |
| Visual & Auditive | 6 |
| Total | 5 , 6 |
Table 3: The value of modes in the 1st step.
| Gender, Alarm Type | Average of Point |
|---|---|
| Female | 4.86 |
| Auditive | 5.08 |
| Visual | 4.75 |
| Visual & Auditive | 4.75 |
| Male | 4.86 |
| Auditive | 5.39 |
| Visual | 4.64 |
| Visual & Auditive | 4.54 |
| Total | 4.86 |
Table 4: The scores of the 1st step (Efficient design).
As can be seen in Table 4, if 3.5 supposed to be the average score of the efficient design, all of the alarm types are designed efficiently from the subjects view in this step. Average score for female is equal to the score assigned by males in the first step.
First time driving
In this step, subjects are asked to drive using the simulator. After a while, they are asked to use a predefined alarm type in order to be informed about the remained battery. The subject is then asked to stop driving and assign an appropriate score to the alarm usability. In this step, traffic congestion, as a variable, is added to the experiment and each person drives in two different traffic congestions: with and without traffic congestion. In Table 5 a descriptive analysis for this step is shown:
| Gender, Alarm Type | Average of Point |
|---|---|
| Female | 3.06 |
| Auditive | 3.92 |
| Visual | 1.92 |
| Visual & Auditive | 3.33 |
| Male | 2.95 |
| Auditive | 3.50 |
| Visual | 2.71 |
| Visual & Auditive | 2.64 |
| Total | 2.98 |
Table 5: The scores of the 2nd step.
According to Table 5, both males and females prefer auditive alarm type in this step. In other words, the average score for auditive alarm type is more than other alarm types. In this step traffic congestion is also incorporated. The average scores with and without traffic congestion are shown in Table 6.
| Traffic, Alarm type | Average of Point |
|---|---|
| With Traffic | 2.78 |
| Auditive | 2.90 |
| Visual | 2.40 |
| Visual & Auditive | 3.30 |
| Without Traffic | 3.18 |
| Auditive | 3.87 |
| Visual | 2.70 |
| Visual & Auditive | 2.40 |
| Total | 2.98 |
Table 6: The average point of different types of alarms with and without traffic congestion in the 2nd step (Ergonomic design).
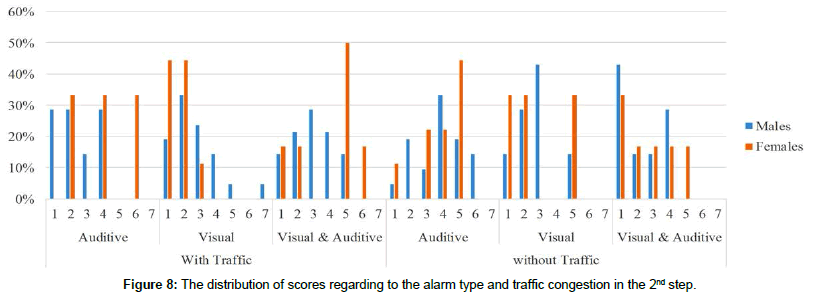
According to Table 6, the average score in a situation in which no traffic congestion is considered is more than the situation in which traffic congestion is considered. By considering traffic congestion subjects prefer visual and auditive alarm type but without any traffic congestion they prefer auditive alarm type. It can be justified that as the use of visual alarm type increases, the hazard of accident raises in the simulation process in a situation in which traffic congestion is considered. The distribution of scores is shown in Figure 8.
The most important index in Figure 8, is mode which is shown in Table 7.
| Gender, Traffic, Alarm Type | Mode |
|---|---|
| Female | 1 , 5 |
| With Traffic | 2 |
| Auditive | 2 , 4 , 6 |
| Visual | 1 , 2 |
| Visual & Auditive | 5 |
| Without Traffic | 5 |
| Auditive | 5 |
| Visual | 1 , 2 , 5 |
| Visual & Auditive | 1 |
| Male | 2 |
| With Traffic | 2 |
| Auditive | 1 , 4 |
| Visual | 2 |
| Visual & Auditive | 3 |
| Without Traffic | 3 |
| Auditive | 4 |
| Visual | 3 |
| Visual & Auditive | 1 |
| Total | 1 |
Table 7: The value of mode in the 2nd step.
According to Table 7, the most allocated score for each alarm type in both situations, with and without traffic congestion, is shown. As can be seen, the subjects allocate lower scores to a situation in which traffic congestion is considered than without traffic congestion. It can be justified that the alarm types are not appropriate for a situation in which traffic congestion is considered. The assigned scores in terms of efficient design of gage and alarms can be seen in Table 8.
| Gender, Alarm Type | Average of Point |
|---|---|
| Female | 3.92 |
| Auditive | 5.08 |
| Visual | 2.92 |
| Visual & Auditive | 3.75 |
| Male | 3.95 |
| Auditive | 4.93 |
| Visual | 3.43 |
| Visual & Auditive | 3.50 |
| Total | 3.94 |
Table 8: The scores of the 2nd step (Efficient design).
As can be seen in Table 8, females preferred auditive and visual and auditive alarms. Males consider all alarm types efficient. In this step, traffic congestion is added to the experiment as a variable. So efficiency of the design must be evaluated considering the traffic.
As can be seen in Table 9, all types of alarms are efficient without traffic congestion but under traffic congestion, just auditive and visual and auditive alarms are efficient. In other words, subjects do not prefer visual alarms under traffic congestion.
| Traffic, Alarm type | Average of Point |
|---|---|
| With Traffic | 3.48 |
| Auditive | 4.00 |
| Visual | 3.03 |
| Visual & Auditive | 3.90 |
| Without Traffic | 4.40 |
| Auditive | 5.30 |
| Visual | 4.00 |
| Visual & Auditive | 3.25 |
| Total | 3.94 |
Table 9: The average point of different types of alarms with and without traffic congestion in the 2nd step (Efficient design).
Stopping after driving
In this step, subjects are asked to stop in order to be informed about the remained battery. The difference between this step and the first one is the familiarity of the driver with the circumstances. So a stronger relationship among the variables is expected than the 1st step. In Table 10 a descriptive analysis is provided.
| Gender , Alarm type | Average of Point |
|---|---|
| Female | 5.44 |
| Auditive | 5.50 |
| Visual | 5.25 |
| Visual & Auditive | 5.58 |
| Male | 5.08 |
| Auditive | 5.29 |
| Visual | 5.04 |
| Visual & Auditive | 4.93 |
| Total | 5.19 |
Table 10: The scores of the 3rd step (Ergonomic Design).
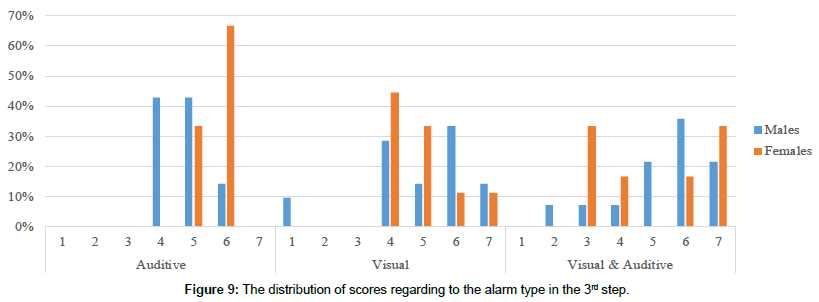
According to Table 10, the average score of females is more than males in this step. Females prefer visual and auditive alarm type and males prefer auditive one. Since in this step the subject is stopped, the traffic congestion does not make any difference to the scores allocated. Hence, the effect of this variable is ignored in this step. The average score in this step is higher than the 1st step. It can be concluded that the subjects are more familiar with the simulation process. Note that the average score assigned by females is more than males by about 0.4 point. The distribution of the scores for each alarm type is shown in Figure 9.
Based on Figure 9, the most often used point can be determined. This index shows the priority of the alarm types in this step.
According to Table 11, most of the subjects have chosen the score of 6 for the alarm type. Females do not prefer visual alarm type but they preferred this type of alarm in the 2nd step. For investigating the efficiency of the alarms design, subjects are asked to assign a score to the alarms in each step. Scores assigned to each alarms are shown in Table 12.
| Row Labels | Average of Point |
|---|---|
| Female | 6 |
| Auditive | 6 |
| Visual | 4 |
| Visual & Auditive | 3 , 7 |
| Male | 6 |
| Auditive | 4 , 5 |
| Visual | 6 |
| Visual & Auditive | 6 |
| Total | 6 |
Table 11: The value of mode in the 3rd step.
| Gender, Alarm Type | Average of Point |
|---|---|
| Female | 4.92 |
| Auditive | 4.25 |
| Visual | 5.00 |
| Visual & Auditive | 5.50 |
| Male | 4.98 |
| Auditive | 4.61 |
| Visual | 5.00 |
| Visual & Auditive | 5.32 |
| Total | 4.96 |
Table 12: The scores of the 3rd step (Efficient design).
The whole alarms are designed efficient in this step from the subjects’ view. The averages of score for each type of alarms are more than 3.5.
Second time driving
After assigning score to the 3rd step, subjects are asked to drive again. In order to be informed about the remained battery, the subjects are asked to express the remained battery using a predefined alarm type while they are driving. This step is similar to the 2nd step. Based on the assigned scores, a descriptive analysis is shown in Table 13.
| Gender , Alarm type | Average of Point |
|---|---|
| Female | 3.72 |
| Auditive | 4.50 |
| Visual | 3.08 |
| Visual & Auditive | 3.58 |
| Male | 3.19 |
| Auditive | 3.86 |
| Visual | 2.32 |
| Visual & Auditive | 3.39 |
| Total | 3.35 |
Table 13: The scores of the 4th step.
According to Table 13, the average score is increased comparing to the 2nd step. Repeated driving and stopping is a block variable. Block variable is considered in analyzing the relationship among the variables of the problem. Since traffic congestion is considered in this step, in Table 14 the average score for each alarm type for both with and without traffic congestion situations is shown.
| Traffic , Alarm Type | Average of Point |
|---|---|
| With Traffic | 3.45 |
| Auditive | 4.27 |
| Visual | 2.75 |
| Visual & Auditive | 3.36 |
| Without Traffic | 3.25 |
| Auditive | 3.78 |
| Visual | 2.25 |
| Visual & Auditive | 3.50 |
| Total | 3.35 |
Table 14: The average point of different types of alarms with and without traffic congestion in the 4th step.
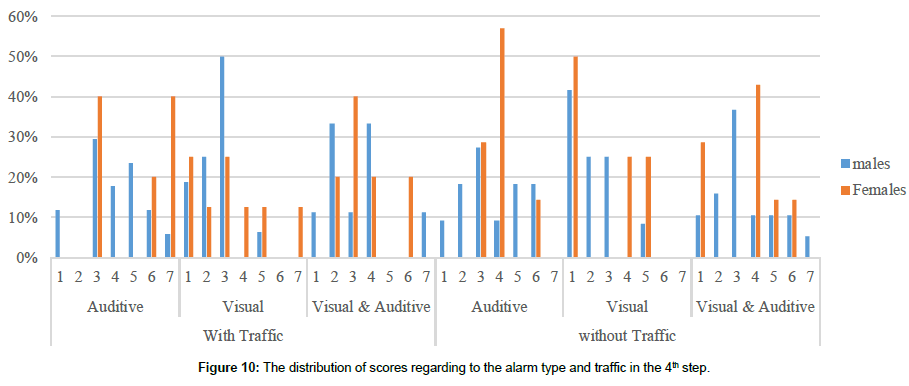
Based on Table 14, in this step the average score is higher than the 1st time driving (2nd step). In addition, in this step, subjects prefer auditive alarm type in both with and without traffic congestion situations. The average score by considering traffic congestion is more than without considering traffic congestion which shows the alarms are useful for the subjects. In Figure 10, the distribution of the scores is shown.
Based on Figure 10, mode is determined in Table 15.
| Gender, Traffic, Alarm Type | Mode |
|---|---|
| Female | 4 |
| With Traffic | 3 |
| Auditive | 3 , 7 |
| Visual | 1 , 3 |
| Visual & Auditive | 3 |
| Without Traffic | 4 |
| Auditive | 4 |
| Visual | 1 |
| Visual & Auditive | 4 |
| Male | 3 |
| With Traffic | 3 |
| Auditive | 3 |
| Visual | 3 |
| Visual & Auditive | 2 , 4 |
| Without Traffic | 3 |
| Auditive | 3 |
| Visual | 2 , 3 |
| Visual & Auditive | 3 |
| Total | 3 |
Table 15: The value of mode in the 4th step.
Based on Table 15, both females and males choose 3 as the most often score for alarm types. Females prefer auditive alarm type under traffic congestion. On the other hand, mode for males for both with and without traffic congestion is equal to 3. For the efficiency of the design of the gage and alarms, subjects are asked to assign a score to the design of the alarms in each step (Table 16).
| Gender, Alarm Type | Average of Point |
|---|---|
| Female | 4.14 |
| Auditive | 4.08 |
| Visual | 5.33 |
| Visual & Auditive | 3.00 |
| Male | 3.75 |
| Auditive | 3.89 |
| Visual | 4.64 |
| Visual & Auditive | 2.71 |
| Total | 3.87 |
Table 16: The scores of the 3rd step (efficient design).
Based on Table 16, unlike the 2nd step, visual and auditive alarms are designed inefficient from the view of both females and males. Considering the traffic as a variable in this step, efficiency should be evaluated under traffic congestion.
According to Table 17, visual alarms are not efficient under traffic congestion like the 2nd step. But all of the alarms are efficient without traffic congestion. It seems the benefits and drawbacks of multisensory displays is more case related and it must be investigated by experiments.
| Gender, Alarm Type | Average of Point |
|---|---|
| With Traffic | 4.05 |
| Auditive | 3.50 |
| Visual | 5.20 |
| Visual & Auditive | 2.60 |
| Without Traffic | 3.68 |
| Auditive | 4.10 |
| Visual | 3.80 |
| Visual & Auditive | 3.00 |
| Total | 3.87 |
Table 17: The average point of different types of alarms with and without traffic congestion in the 4th step (Efficient design).
Generalized linear model
The linear model usually encompasses both systematic and random components in a statistical model but the model shall be restricted to include only the systematic component.
 (1)
(1)
Where  assumes as independent variable whose values are supposed known and
  considers as a parameter.
  may be known or unknown or need to be estimated. Consider:
 (2)
(2)
Where the data are indexed by factors whose levels are denoted by i and j. The term  includes n parameters associated with a qualitative variable represented by n dummy x - variable component taking value of 1 for one level and 0 for the rest.
  represents a quantitative variable, namely u with single parameter β and
  shows p parameters
  associated with a mixed independent variable whose p components take the value of
  for one level of j and zero for the rest. Now systematic and random components are combined and resulted in a model characterized by:
1. A dependent variable z whose distribution with parameter θ.
2. A set of independent variable  and predicted
3. A linking function  connecting the parameter θ of the distribution of z with the
  s of the linear model.
Where z is normally distributed with the mean of θ and variance  and when
  , resulted in a ordinary linear model with Normal errors [34].
Results and Discussions
The aim of this paper is to investigate the interaction between alarm type and the allocated score in each step. In other words, there is a response value (score) and other predictors. The aim is to estimate the regression parameter between predictors and response variables. So a Generalized Linear Model (GLM) is used to estimate the parameter using SPSS commercial software on a 6GB RAM memory and COREi7 CPU system. There are two main predictors and response variables. These two main variables are alarm types and traffic congestion. First of all, in one particular step, parameter estimation is used to determine the relationship between predictor and response variable. Since GLM will fail by discrete variable as dependent, an Ordinal Probit method is used for dependent variable. As described, each experiment is repeated one time for subjects. Since there are a lot of variables in the experiment and they have multiple values in each step, a blocking procedure is used for age and repetition of the experiments for reducing the variability. Moreover, traffic, alarm types and steps are defined as factor variables and person and Gender are defined as covariate in calculations. The Wald Square Test is shown in Table 18.
| Source | Type III | ||
|---|---|---|---|
| Wald Chi-Square | df | Sig. | |
| GP_Step * Alarm * Traffic | 89.761 | 4 | .000 |
| Dependent Variable: Point Model: (Threshold), GP_Step * Alarm * Traffic |
|||
Table 18: Tests of model effects.
As can be seen in Table 18, alarm types, steps and traffic are statistically meaningful. Since the p-value is less than 0.05, if the alpha level sets to 0.05, the null hypothesis will be rejected and it will be concluded that the regression coefficient for parameter has found to be statistically different from zero. In Table 19, based on Table 18, parameter estimation for all the variables is shown.
| Parameter | B | Std. Error | 95% Wald Confidence Interval | Hypothesis Test | ||||
|---|---|---|---|---|---|---|---|---|
| Lower | Upper | Wald Chi-Square |
df | Sig. | ||||
| Threshold | [Point=1.0] | -1.270 | .1137 | -1.493 | -1.047 | 124.769 | 1 | .000 |
| [Point=2.0] | -.732 | .1046 | -.937 | -.527 | 48.978 | 1 | .000 | |
| [Point=3.0] | -.227 | .1021 | -.428 | -.027 | 4.961 | 1 | .026 | |
| [Point=4.0] | .279 | .1025 | .079 | .480 | 7.433 | 1 | .006 | |
| [Point=5.0] | .902 | .1065 | .694 | 1.111 | 71.781 | 1 | .000 | |
| [Point=6.0] | 1.688 | .1238 | 1.446 | 1.931 | 185.976 | 1 | .000 | |
| [GP_Step=1.00] * Alarm * Traffic | .110 | .0359 | .040 | .181 | 9.461 | 1 | .002 | |
| [GP_Step=2.00] * Alarm * Traffic | -.129 | .0362 | -.200 | -.058 | 12.705 | 1 | .000 | |
| [GP_Step=3.00] * Alarm * Traffic | .218 | .0389 | .142 | .295 | 31.503 | 1 | .000 | |
| [GP_Step=4.00] * Alarm * Traffic | -.058 | .0350 | -.126 | .011 | 2.708 | 1 | .100 | |
| Dependent Variable: Point | ||||||||
Alarm * Traffic * GP_Step.
Step 1= Before driving , 2=Driving 1, 3=Stopping, 4=Driving 2.
Table 19: Parameter estimates.
Considering that the predictors in the experiment are discrete, for estimating parameters, each state must be investigated separately (based in Table 19). The first column shows the parameters and their states. The second column (B) shows the coefficients of the variables. The third column (Std. Error) are the standard errors of individual regression coefficient. The fourth and fifth columns (upper and lower for Wald Chi-Square interval) show a 95 percent interval for Wald Chi square test. The sixth column (Wald Chi-Square) tests the null hypothesis. The seventh column (df) is the degrees of freedom for each of the coefficients. The eighth column (sig.) is the p-values of the coefficients. Coefficient is assumed zero given that the rest of the predictors are in the model. They are based on the Wald test statistics of the predictors, which can be calculated by dividing the square of the predictor’s estimate to the square of its standard error. The probability that a particular Wald test statistic is as extreme as or more than what has been observed under the null hypothesis is defined by the p-value. If the p-value is less than 0.05 and the alpha level is set to 0.05, we will reject the null hypothesis and conclude that the regression coefficient for parameter has found to be statistically different from zero. Based on Table 19, except the two driving steps, for the rest steps, there is a statistically coefficient between dependent variable and interacted predictor variable including alarm types, steps and traffic congestion.
Conclusion and Future Scope
By 2020, it is expected that more than half of the new vehicle sales will likely be electric vehicle. So drivers will face new aspects like charging, battery and challenges for the charging time. In this paper, a gage was designed to alarm the drivers in the electric vehicles about the remained battery which support both auditory and visual alarms. To evaluate the usability of the interface, the stress of drivers is investigated during the simulation using a driving simulator. 12 experiments consist of four steps are examined including two changing variables. These variables are traffic congestion and alarm types of the interface. The alarm types are categorized into three groups:
1. Auditory
2. Visual
3. Both auditory and visual
The subjects are asked to be informed about the remained battery using one of the three predefined alarm types. Subjects were asked to assign two separate points to the gage; one for ergonomic design and another for efficient design. In this paper a descriptive analyzed were provided for the efficient design of the gage. For analyzing the results, the point, assigned by the subjects, is defined as response variable. There are 3 predictor variables including alarm types, traffic congestion and step. The aim of the paper is to investigate the relationship between predictor and response variables. The results show that the average score in the stopping situations is more than the driving situations and subjects prefer auditive alarm type more than others in all steps. Furthermore, the relationship between interacted variables is investigated which reveals a meaningful relationship between alarm types, steps and traffic with the point. Estimation for regression parameters is also calculated. As further studies it is recommended to consider the following suggestions:
1. Add more changing variables such as the height of the driver seat and the location of the gear and to analyze the relationship between user satisfaction and respective variables.
2. In this paper, the gage is designed horizontally. It is possible to design it vertically and compare the results with the horizontally state.
3. It is possible to extend the age range in order to include it as a parameter in the research.
4. The simulator includes only steering wheel, gear and pedal which caused too many restrictions. It is recommended to use a car real space since it improves the efficiency of the experiment and also it is possible to incorporate and analyze elements such as road visibility.
References
- Strömberg H, Andersson P, Almgren S, Ericsson J, Karlsson M, et al., (2011) Driver interfaces for electric vehicles, New York, USA: ACM Press P:177.
- Buehler F, Franke T, Krems F (2011) Usage Patterns of Electric Vehicles as a Reliable Indicator for Acceptance? Findings from a German Field Study.
- Turrentine T (2010) Driving climate change; a case study of electric vehicle drivers in Los Angeles and New York.
- Cocron P, Franke T, Neumann I, Bühler F, Krems F (2010) Expectances and experiences of drivers using an EV: Findings from a German field study PP: 250-251.
- He W, Williard N, Chen C, Pecht M (2013) State of charge estimation for electric vehicle batteries using unscented kalman filtering. Microelectronics Reliability, 53: 840-847.
- Wellings T, Binnersley J, Robertson D, Khan T (2011) Human Machine Interfaces in Low Carbon Vehicles-Market Trends and Us. Document number HMI
- Edworthy J, Loxley S, Dennis I (1991) Improving auditory warning design: relationship between warning sound parameters and perceived urgency, Human Factors, 33: 205-231.
- McKeown D, Isherwood S (2007) Mapping candidate within-vehicle auditory displays to their referents. Hum Fac Hum Factors 49: 417-28.
- Edworthy J, Hellier E (2006) Alarms and human behaviour: implications for medical alarms. Br J Anaesth, 97:12-17.
- Dibben N, Williamson J (2007) An exploratory survey of in-vehicle music listening. Psychology of Music, 35:571-589.
- Ho C, Reed N, Spence C (2007) Multisensory In-Car Warning Signals for Collision Avoidance, J Hum Fac Ergon Soc, 49:1107-1114.
- Ramsey L, Simmons B (1993) High-Powered Automobile Stereos, Otolaryngology-Head and Neck Surgery, 109:108-110.
- Strayer L, Johnston A (2001) Driven to distraction: Dual-Task Studies of Simulated Driving and Conversing on a Cellular Telephone, Psycho Sci 12: 462-466.
- Driver J, Spence C (2004) Crossmodal spatial attention: Evidence from human performance, Crossmodal space and crossmodal.
- Spence C, Driver J (2004) A new approach to the design of multimodal warning signals, Eng Psycho Cog Ergon, PP:455-461
- Soto-Faraco S, Morein-Zamir S, Kingstone A (2005) On audiovisual spatial synergy: The fragility of the phenomenon, Percep Psychophy 67: 444-457.
- Ho C, Spence C (2012) The multisensory driver: Implications for ergonomic car interface design. Ashgate Pub, Ltd.
- Harvey C, Stanton A, Pickering A, McDonald M, Zheng P (2010) Context of use as a factor in determining the usability of in-vehicle devicesm, Theo Iss Ergon Sci.
- Bevan N (2001) International standards for HCI and usability, Int J Hum-Comp Stud 55: 533-552
- Nielsen J (1994) The Usability Engineering Lifecycle , first edition, Elsevier Science 11.
- Norman A (1983) Design principles for human-computer interfaces, New York, USA: ACM Press PP: 1-10.
- Shakel B (1986) Ergonomics in design for usability, in People and computers: Design for usability, Cambridge University Press PP: 44-64.
- Shneiderman B (1992) Designing the user interface: strategies for effective human-computer interaction 3.
- International Organization for Standardization (ISO) (1998) International Standard Ergonomic requirements for office work with visual display terminals (VDTs)-Part 11: Guidance on Usability.
- Harvey C, Stanton N, Pickering C, McDonald M, Zheng P (2011) A usability evaluation toolkit for In-Vehicle Information Systems (IVISs), App Ergon 42: 563-574.
- Gaspar J, Fontul M, Henriques E, Silva A (2014) User satisfaction modeling framework for automotive audio interfaces, Int J Ind Ergon 44: 10-13.
- Huth V, Biral F, Martín Ó, Lot R (2012) Comparison of two warning concepts of an intelligent Curve Warning system for motorcyclists in a simulator study. Accident Analysis and Prevention, 44: 118-125.
- Green P (2008) Driver interface/HMI standards to minimize driver distraction/overload
- Graham R (1999) Use of auditory icons as emergency warnings: evaluation within a vehicle collision avoidance application, Ergon 42: 1233-1248.
- Smith S, Fu H (2011) The relationships between automobile head-up display presentation images and drivers’ Kansei 32: 58-68.
- Cabral P, Mendonça L, Cabral A (2015) Synesthetic Metering for Speed - Evaluation Applied to Young Drivers’ Speeding, Proc Manufac 3: 6198-6205
- McIlroy C, Stanton A (2015) Encouraging Eco-driving with Multi-sensory Information. Proc Manufac 3:2474-2481
- Lenné G, Rudin-Brown M, Navarro J, Edquist J, Trotter M, et al., (2011) Driver behaviour at rail level crossings: Responses to flashing lights, traffic signals and stop signs in simulated rural driving, App Ergon 42: 548-554.
- Nelder A, Baker J (2006) Generalized Linear Models. In Encyclopedia of Statistical Sciences, NJ, USA: John Wiley & Sons, Inc.
 Spanish
  Chinese
  Russian
  German
  French
  Japanese
  Portuguese
  Hindi
Hindi 