Spanish
  Chinese
  Russian
  German
  French
  Japanese
  Portuguese
  Hindi
Hindi Commentary, Jtsdt Vol: 12 Issue: 5
Living with Post-Traumatic Stress Disorder: Strategies for Coping and Recovery
Shammah Ahmed Ali*
Faculty of Applied Medical Science, Umm AL-Qura University, Mecca, Saudi Arabia
*Corresponding Author:
Shammah Ahmed Ali
Department of Applied Medical Science,
Umm AL-Qura University,
Mecca,
Saudi Arabia;
E-mail: ahghamdi2@gmail.com
Received date: 08 May, 2023, Manuscript No. JTSDT-23-103536;
Editor assigned date: 11 May, 2023, PreQC No. JTSDT-23-103536 (PQ);
Reviewed date: 25 May, 2023, QC No. JTSDT-23-103536;
Revised date: 05 June, 2023, Manuscript No. JTSDT-23-103536 (R);
Published date: 03 July, 2023, DOI: 10.4172/2324-8947.100378
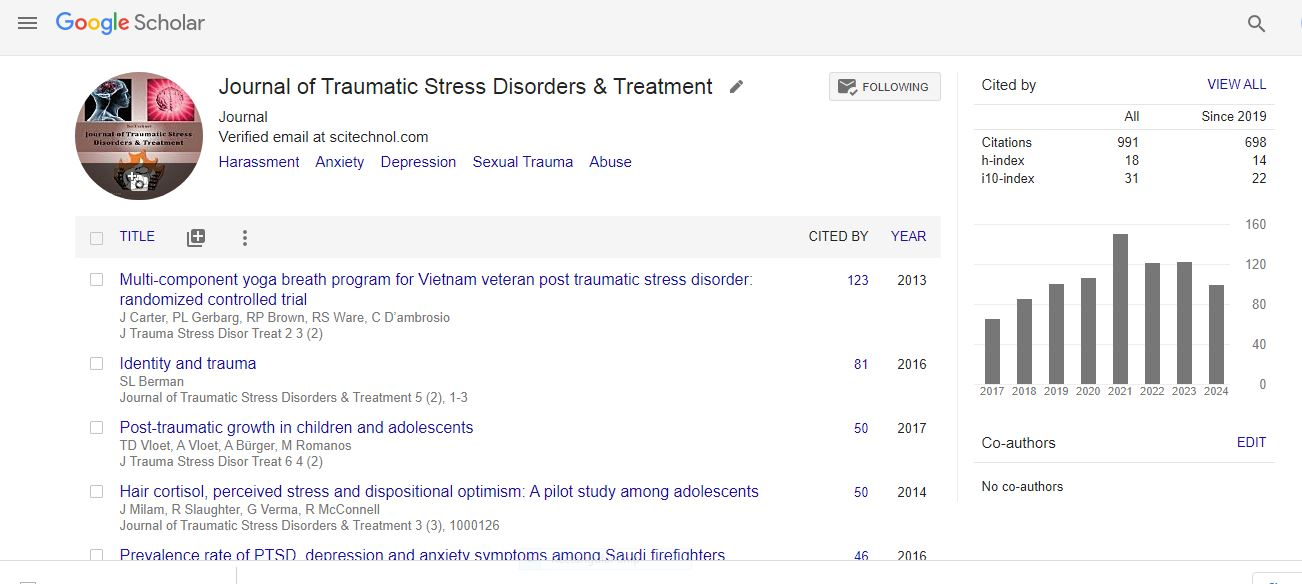
Citation: Ali SA (2023) Post-Traumatic Stress Disorder among Paramedics in Makkah Region 2022. J Trauma Stress Disor Treat 12:7.
Abstract
Background: Post-Traumatic Stress Disorder (PTSD) is a mental and behavioral disorder caused by witnessing or experiencing an actual terrifying event. This study was done to examine the prevalence rate of Post-Traumatic Stress Disorder (PTSD) among paramedics in the Makkah region in 2022.
Methods: This descriptive statistical study was done in Umm- Alqura (UQU), Makkah, SA. The questionnaire used in this study was selected from several studies by the (PTSD) national center. Using the questionnaire, we assessed the prevalence rate among paramedics in the Makkah region out of (972) only (200) were included.
Results: This study showed a low incidence of post-traumatic stress disorder among paramedics, according to the result we found that the majority of participants have no symptoms of post-traumatic stress disorder.
Conclusion: This study found low PTSD. A continuing education program on adaptation to PTSD could be somehow helpful to those who have symptoms of PTSD. A screening to recognize high-risk individuals.
Keywords: Post-traumatic stress disorder; Paramedics;
Behavioral disorder; Anxiety
Introduction
Post-Traumatic Stress Disorder (PTSD) is a mental and behavioral disorder caused by witnessing or experiencing an actual terrifying event such as Sexual assault, warfare, traffic collection child abuse or other threats on a person's life. PTSD may cause a broad range of symptoms including bad memories and nightmares of the event, anger, anxiety, distress, irritability and weekend concentration. Symptoms should persist for more than a month for a diagnosis of PTSD rather than acute stress disorder [1]. Factors that increase the risk of PTSD are as follows: (I) pre-traumatic factors such as genetic, cultural factors and prior psychiatric disorders; (II) peri-traumatic factors that include the severity of the trauma, threat to life and personal injury and (III) post-traumatic factors such as poor coping strategies, frequent exposure and social support. Interestingly, emotional support is protective against developing PTSD. According to the report of the National Institute of Mental Health (NIMH), 7.7 million adults or 3.5% of adult people suffer from PTSD. Nayback. According to posttraumatic stress disorder among emergency medical services personnel: A cross-sectional study in Saudi Arabia 26% of EMS personnel had a positive screening for PTSD [2].
This study examined the prevalence of PTSD among paramedics in the Makkah region. From 972 paramedics in the Makkah region according to the general authority of statistics, only 200 paramedics were included in this study, all participants were men. The study targeted all paramedics, students and employees in the Makkah region. Study subjects were privately selected and approached through their email provided by the EMS department [3].
Materials and Methods
Design
This descriptive statistical study was done in Makkah, KSA.
Sample and setting
A total of 200 paramedics were included in this study were given the same questionnaire evaluating post-traumatic stress disorder. Each participant received a link to participate in the study. The target and objectives were illustrated and their answers to the designed questionnaire were obtained [4].
Questionnaire
Participants from paramedics completed a standardized assessment instrument measuring post-traumatic stress disorder. The questionnaire used in this study was selected from several studies by the (PTSD) national center [5].
The first part examined demographic variables, such as gender, age, marital status, level of education, years of experience, working shift, deal with victim directly and experience traumatic event [6].
The second part measured the common signs and symptoms of (PTSD). Such as the desire to change career, work satisfaction, reexperience of the event, self-blame, isolation, difficulty in daily life, insomnia, flashbacks, nightmares and scary thoughts [7].
Data collection and analysis
Information about the study was given to the participants by online form. Privacy was kept by putting no name or other personal information in the questionnaire. The questionnaire was handed out and distributed to the participants through their email provided by Saudi Red Crescent authority and social media. All questions listed in the questionnaire were answered. The data were gathered in Microsoft Excel 2016 version 15.25 and analyzed using SPSS version 29 [8]. Categorical variables are presented as percentages and frequency. Descriptive analysis was used to define the characteristics of the sample and examine the PTSD common symptoms [9].
Results
Demographic variables
A total of 200 paramedics participated in the study. All participants were men; 7 (3.5%) were older than 50 years, 153 (76.5%) were between 18-29 years old and 40 (20%) were between 30-49 years old. 154 (77%) were not married and 46 (23%) were married [10]. The majority had a bachelor 113 (56.5%), 49 (24.5%) were students, 33 (16.5%) had a diploma and 5 (2.5%) had a master. The majority had worked for less than 5 years 175 (87.5%), 14 (7%) had worked more than 15 years and 11 (5.5%) had worked 5 to years. 120 (60%) work in the morning, 20 (10%) work in the evening and 60 (30%) work in the morning and the evening. 86 (43%) work less than 100 hours per month, 71 (35.5%) work 100-150 hours per month, 28 (14%) work 150-200 hours per month, and 15 (7.5%) work more than 200 hours per month. 155 (77.5%) deal with the victim directly and 45 (22.5%) do not deal with the victim directly. 119 (59.5%) had experienced a traumatic event and 81 (40.5%) had experienced a traumatic event (Tables 1-7) [11].
| Age | Frequency | Percent | Valid percent | Cumulative percent | |
|---|---|---|---|---|---|
| Valid | 18-29 years old | 153 | 76.5 | 76.5 | 765 |
| 30-49 years old | 40 | 20 | 20 | 96.5 | |
| >50 years old | 7 | 3.5 | 3.5 | 100 | |
| Total | 200 | 100 | 100 | - | |
Table 1: Demographic variables for age.
| Marital status | Frequency | Percent | Valid percent | Cumulative percent | |
|---|---|---|---|---|---|
| Valid | Married | 46 | 23 | 23 | 23 |
| Not married | 154 | 77 | 77 | 100 | |
| Total | 200 | 100 | 100 | - | |
Table 2: Demographic variables for marital status.
| Years of experience | Frequency | Percent | Valid percent | Cumulative percent | |
|---|---|---|---|---|---|
| Valid | Less than 5 years | 175 | 87.5 | 87.5 | 87.5 |
| 10 to 15 years | 11 | 5.5 | 5.5 | 93 | |
| More than 15 years | 14 | 7 | 7 | 100 | |
| Total | 200 | 100 | 100 | - | |
Table 3: Demographic variables for years of experience.
| Working shift | Frequency | Percent | Valid percent | Cumulative percent | |
|---|---|---|---|---|---|
| Valid | Morning | 120 | 60 | 60 | 60 |
| Evening | 20 | 10 | 10 | 70 | |
| Morning and evening | 60 | 30 | 30 | 100 | |
| Total | 200 | 100 | 100 | - | |
Table 4: Demographic variables for working shift.
| Working hours per month | Frequency | Percent | Valid percent | Cumulative percent | |
|---|---|---|---|---|---|
| Valid | <100 | 86 | 43 | 43 | 43 |
| 100-150 | 71 | 35.5 | 35.5 | 78.5 | |
| 150-200 | 28 | 14 | 14 | 92.5 | |
| >200 | 15 | 7.5 | 7.5 | 100 | |
| Total | 200 | 100 | 100 | - | |
Table 5: Demographic variables for working hours per month.
| Direct interaction with victim | Frequency | Percent | Valid percent | Cumulative percent | |
|---|---|---|---|---|---|
| Valid | Yes | 155 | 77.5 | 77.5 | 77.5 |
| No | 45 | 22.5 | 22.5 | 100 | |
| Total | 200 | 100 | 100 | - | |
Table 6: Demographic variables for direct interaction with victim.
| Experienced traumatic event | Frequency | Percent | Valid percent | Cumulative percent | |
|---|---|---|---|---|---|
| Valid | Yes | 119 | 59.5 | 59.5 | 59.5 |
| No | 81 | 40.5 | 40.5 | 100 | |
| Total | 200 | 100 | 100 | - | |
Table 7: Demographic variables for experienced traumatic event.
36 (18%) had the desire to change their career and 164 (82%) had no desire to change their career [12]. The majority were satisfied with their work 125 (62.5%), 50 (25%) were partially satisfied and 25 (12.5) were dissatisfied. 108 (54%) relive or re-experience the event and 92 (46%) do not relive or re-experience the event. 46 (23%) blamed themselves and 154 (77%) did not blame themselves. 92 (46%) avoided certain people, situations or places and 108 (54%) did not avoid certain people, situations or places. 53 (26.5) had difficulty functioning in their daily life and 147 (73.5) had no difficulty functioning in their daily life. 132 (66%) had adequate sleeping and 68 (34%), had inadequate sleeping. 106 (53%) had the symptoms of (flashbacks, nightmares and scary thoughts), 48 (24%) had flashbacks, 8 (4%) had nightmares, 20 (10%) had scary thoughts and 30 (15%) had all the three symptoms, 94 (47%) had none of these symptoms (Tables 8-17) [13].
| Desire to change the career (career shift desire) | Frequency | Percent | Valid percent | Cumulative percent | |
|---|---|---|---|---|---|
| Valid | Yes | 36 | 18 | 18 | 18 |
| No | 164 | 82 | 82 | 100 | |
| Total | 200 | 100 | 100 | - | |
Table 8: Demographic variables of desire to change the career (career shift desire).
| Work satisfaction | Frequency | Percent | Valid percent | Cumulative percent | |
|---|---|---|---|---|---|
| Valid | Satisfied | 125 | 62.5 | 62.5 | 62.5 |
| Dissatisfied | 25 | 12.5 | 12.5 | 75 | |
| Partially satisfied | 50 | 25 | 25 | 100 | |
| Total | 200 | 100 | 100 | - | |
Table 9: Demographic variables of work satisfaction.
| Self-blame for event | Frequency | Percent | Valid percent | Cumulative percent | |
|---|---|---|---|---|---|
| Valid | Yes | 46 | 23 | 23 | 23 |
| No | 154 | 77 | 77 | 100 | |
| Total | 200 | 100 | 100 | - | |
Table 10: Demographic variables of self-blame for event.
| Re-experience the event | Frequency | Percent | Valid percent | Cumulative percent | |
|---|---|---|---|---|---|
| Valid | Yes | 108 | 54 | 54 | 54 |
| No | 92 | 46 | 46 | 100 | |
| Total | 200 | 100 | 100 | - | |
Table 11: Demographic variables of re-experience the event.
| Self-blame for event | Frequency | Percent | Valid percent | Cumulative percent | |
|---|---|---|---|---|---|
| Valid | Yes | 46 | 23 | 23 | 23 |
| No | 154 | 77 | 77 | 100 | |
| Total | 200 | 100 | 100 | - | |
Table 12: Demographic variables of self-blame for event.
| Avoid certain people or places | Frequency | Percent | Valid percent | Cumulative percent | |
|---|---|---|---|---|---|
| Valid | Yes | 92 | 46 | 46 | 46 |
| No | 108 | 54 | 54 | 100 | |
| Total | 200 | 100 | 100 | - | |
Table 13: Demographic variables of avoid certain people or places.
| Re-experience the event | Frequency | Percent | Valid percent | Cumulative percent | |
|---|---|---|---|---|---|
| Valid | Yes | 108 | 54 | 54 | 54 |
| No | 92 | 46 | 46 | 100 | |
| Total | 200 | 100 | 100 | - | |
Table 14: Demographic variables of re-experience the event.
| Difficult to function in daily life | Frequency | Percent | Valid percent | Cumulative percent | |
|---|---|---|---|---|---|
| Valid | Yes | 53 | 26.5 | 26.5 | 26.5 |
| No | 147 | 73.5 | 73.5 | 100 | |
| Total | 200 | 100 | 100 | - | |
Table 15: Demographic variables of difficult to function in daily life.
| Sleeping hours | Frequency | Percent | Valid percent | Cumulative percent | |
|---|---|---|---|---|---|
| Valid | Adequate | 132 | 66 | 66 | 66 |
| Inadequate | 68 | 34 | 34 | 100 | |
| Total | 200 | 100 | 100 | - | |
Table 16: Demographic variables of sleeping hours.
| Do you have any of these symptoms? | Frequency | Percent | Valid percent | Cumulative percent | |
|---|---|---|---|---|---|
| Valid | Flashback | 48 | 24 | 24 | 24 |
| Nightmares | 8 | 4 | 4 | 28 | |
| Scary thoughts | 20 | 10 | 10 | 38 | |
| All | 30 | 15 | 15 | 53 | |
| None | 94 | 47 | 47 | 100 | |
| Total | 200 | 100 | 100 | - | |
Table 17: Demographic variables for do you have any of these symptoms.
Discussion
This study showed a low incidence of post-traumatic stress disorder among paramedics, according to the result we found that the majority of participants have no symptoms of post-traumatic stress disorder. The flowing results explain the low incidence.
36 paramedics had the desire to change their career the maximum was for married, >50 years old, students, paramedics. Also, for paramedics with more than 15 years of experience.
25 paramedics were dissatisfied with their work, the majority of which was not married, >50 years old, students and less than 5 years of experience.
Forty-six paramedics blamed themselves for what happened, most of not married, 18-29 years old, had a bachelor's degree and had less than 5 years of experience.
Around half of the participants did not have any of common symptoms of PTSD (flashbacks, nightmares, and scary thoughts) (Tables 18-20).
| Desire to change the career (career shift desire) | Marital status | Age | Level of education | Years of experience | |
|---|---|---|---|---|---|
| Yes | Number | 36 | 36 | 36 | 36 |
| Minimum | Not married | 18-29 years old | Master | Less than 5 years | |
| Maximum | Married | >50 years old | Student | More than 15 years | |
| No | Number | 164 | 164 | 164 | 164 |
| Minimum | Not married | 18-29 years old | Master | More than 15 years | |
| Maximum | Married | >50 years old | Bachelor | Less than 5 years | |
Table 18: Marital status age level of education years of experience*desire to change the career (career shift desire).
| Work satisfaction | Marital status | Age | Level of education | Years of experience | |
|---|---|---|---|---|---|
| Satisfied | Number | 125 | 125 | 125 | 125 |
| Minimum | Married | >50 years old | Master | More than 15 years | |
| Maximum | Not married | 18-29 years old | Bachelor | Less than 5 years | |
| Dissatisfied | Number | 25 | 25 | 25 | 25 |
| Minimum | Married | 18-29 years old | Master | More than 15 years old | |
| Maximum | Not married | >50 years old | Diploma | Less than 5 years | |
| Partially satisfied | Number | 50 | 50 | 50 | 50 |
| Minimum | Married | 18-29 years old | master | 10 to 15 years old | |
| Maximum | Not married | >50 years old | student | Less than 5 years | |
Table 19: Marital status age level of education years of experience*work satisfaction.
| Do you blame yourself for what happened | Marital status | Age | Level of education | Years of experience | |
|---|---|---|---|---|---|
| Yes | Number | 46 | 46 | 46 | 46 |
| Minimum | Not married | >50 years old | Master | More than 15 years | |
| Maximum | Married | 18-29 years old | Student | Less than 5 years | |
| No | Number | 154 | 154 | 154 | 154 |
| Minimum | Married | >50 years old | Master | More than 15 year | |
| Maximum | Not married | 18-29 years old | Bachelor | Less than 5 years | |
Table 20: Marital status, age, level of education, years of experience, self-blame for event.
Conclusion
In conclusion, this study found a low PTSD prevalence relative to findings from the results. A continuing education program on adaptation to PTSD could be somehow helpful to those who have symptoms of PTSD. A screening to recognize high-risk individuals, particularly those who want to work in emergency departments could be another way.
Acknowledgment
I am very thankfully appreciating the contribution and the effort of all the people who helped us in this research especially anesthesia technology students, UQU, Makkah, SA. Also the author would like to thank the deanship of scientific research at Umm Al-Qura university for supporting this work by grant code: (23UQU4210127DSR01).
References
- Brewin CR, Andrews B, Valentine JD (2000) Meta-analysis of risk factors for posttraumatic stress disorder in trauma-exposed adults. J Consult Clin Psychol 68: 748.
[Crossref] [Google Scholar] [PubMed]
- Ozer EJ, Best SR, Lipsey TL, Weiss DS (2003) Predictors of posttraumatic stress disorder and symptoms in adults: A meta-analysis. Psychol Bulletin 129: 52.
[Crossref] [Google Scholar] [PubMed]
- Nayback AM (2009) PTSD in the combat veteran: Using Roy's adaptation model to examine the combat veteran as a human adaptive system. Issues Mental Health Nurs 30: 304-310.
[Crossref] [Google Scholar] [PubMed]
- Alaqeel MK, Aljerian NA, AlNahdi MA, Almaini RY (2019) Post-traumatic stress disorder among emergency medical services personnel: A cross-sectional study. Asian J Med Sci 10: 28-31.
- Taft CT, Vogt DS, Marshall AD, Panuzio J, Niles BL (2007) Aggression among combat veterans: Relationships with combat exposure and symptoms of posttraumatic stress disorder, dysphoria and anxiety. J Trauma Stress 20: 135-145.
[Crossref] [Google Scholar] [PubMed]
- Yambo T, Johnson M (2014) An integrative review of the mental health of partners of veterans with combat-related posttraumatic stress disorder. J Am Psychiatr Nurse Assoc 20: 31-41.
[Crossref] [Google Scholar] [PubMed]
- Solomon Z, Dekel R (2007) Posttraumatic stress disorder and posttraumatic growth among Israeli ex‐pows. J Trauma Stress 20: 303-312.
[Crossref] [Google Scholar] [PubMed]
- Taft CT, Schumm JA, Panuzio J, Proctor SP (2008) An examination of family adjustment among operation desert storm veterans. J Consult Clin Psychol 76: 648.
[Crossref] [Google Scholar] [PubMed]
- Kaysen D, Resick PA, Wise D (2003) living in danger: The impact of chronic traumatization and the traumatic context on posttraumatic stress disorder. Trauma Violence Abuse 4: 247-264.
[Crossref] [Google Scholar] [PubMed]
- Feng J, Lau PWC, Shi L, Huang WY (2022) Movement behaviors and posttraumatic stress disorder during the COVID-19 pandemic: A retrospective study of Chinese university students. J Exerc Sci Fit 20: 263-268.
[Crossref] [Google Scholar][PubMed]
- Zhang Y, Pi DD, Liu CJ, Li J, Xu F (2022) Psychological impact of the COVID-19 epidemic among healthcare workers in paediatric intensive care units in China. Plos One 17: e0265377.
[Crossref] [Google Scholar][PubMed]
- Sencan I, Bulut D, Sencan IH, Agalar C (2021) Global health emergencies during the pandemic and their solutions. Turk J Med Sci 51: 3194-3206.
[Crossref] [Google Scholar][PubMed]
- Gilleen J, Santaolalla A, Valdearenas L, Salice C, Fuste M (2021) Impact of the COVID-19 pandemic on the mental health and well-being of UK healthcare workers. J Psych Open 7: e88.
[Crossref] [Google Scholar][PubMed]