Spanish
  Chinese
  Russian
  German
  French
  Japanese
  Portuguese
  Hindi
Hindi Review Article, J Electr Eng Electr Technol Vol: 14 Issue: 1
Maximum Power Point Tracking for Photovoltaic Panels Based on Fuzzy Logic and Artificial Neural Network Algorithms
Hayder Dakhil Atiyah1*, Mohamed Boukattaya2 and Fatma Ben Salem3
1Department of Electrical Power, National School of Engineering of Sfax, Tunisia
2Department of Electrical Engineering, Laboratory of Sciences and Techniques of Automatic Control and Computer Engineering, National School of Engineering of Sfax, Tunisia
3Department of Electrical Engineering, Control and Energy Management Laboratory (CEMLab), ENIS Sfax University, Tunisia
*Corresponding Author:Hayder Dakhil Atiyah
Department of Electrical Power, National School of Engineering of Sfax, Tunisia
E-mail: haydergfg@gmail.com
Received date: 14 October, 2023, Manuscript No. JEEET-23-116828;
Editor assigned date: 16 October, 2023, PreQC No. JEEET-23-116828 (PQ);
Reviewed date: 30 October, 2023, QC No. JEEET-23-116828;
Revised date: 17 January, 2025, Manuscript No. JEEET-23-116828 (R);
Published date: 24 January, 2025, DOI: 10.4172/2325-9833.1000988
Citation: Atiyah HD, Boukattaya M, Sahu S, Salem FB (2025) Maximum Power Point Tracking for Photovoltaic Panels Based on Fuzzy Logic and Artificial Neural Network Algorithms. J Electr Eng Electr Technol 14:1.
Abstract
The abstract summarizes a research study focused on improving the efficiency of Photovoltaic (PV) systems through an innovative Maximum Power Point Tracking (MPPT) technique, particularly designed for Partial Shading Conditions (PSC). Here's a breakdown of the key points from the abstract: Importance of MPPT: The abstract emphasizes the significance of MPPT controllers in enhancing the efficiency of PV systems. Challenges under Partial Shading Conditions (PSC): Conventional MPPT techniques are acknowledged to face challenges when dealing with partial shading conditions, where the irradiance on the PV panels is not uniform. Proposed MPPT technique: The study introduces a novel MPPT technique designed specifically for PSC. This technique combines two elements: A) Artificial Neural Networks (ANNs) can be used for a wide range of prediction the area where the Global Maximum Power Point (GMPP) is likely to be located. B) Perturb and Observe (P and O) algorithm: Employed to precisely determine the exact position of the GMPP within the predicted area validation through computer simulations: To assess the effectiveness of this new technique, computer simulations were conducted using the MATLAB/Simulink program. The results of these simulations confirmed that the proposed MPPT method can track the GMPP faster compared to other existing techniques. In summary, this research aims to address the limitations of conventional MPPT techniques in partial shading conditions by introducing an approach that combines ANN prediction with the classic P and O algorithm. The computer simulations validate the effectiveness of this method in improving the efficiency of PV systems under challenging shading conditions.
Keywords: Photovoltaic panel; Maximum power point tracking; Algorithm; Partial shading conditions
Introduction
The research highlights the global challenges related to energy consumption, fossil fuel depletion, greenhouse gas emissions, and global warming. It suggests that in response to these challenges, scientists are actively seeking and creating new renewable energy resources [1]. The solar energy as an abundant and environmentally friendly Photovoltaic (PV) cells, commonly known as solar cells, are designed to convert sunlight directly into electricity [2]. This underscores the importance of optimizing energy generation in Photovoltaic (PV) systems, given that the power output of PV plants is typically lower when compared to conventional power plants [3]. Climatic conditions, specifically temperature and radiation intensity are interconnected a substantial impact on the power generated by solar panels, permanent changes in temperature and radiation intensity can indeed lead to shifts in the Maximum Power Point (MPP) of solar panels [4]. This means that the conditions under which a panel operates affect its optimal power output. The passage mentions that several methods have been proposed for Maximum Power Point Tracking (MPPT) of solar panels, with one of them being "Perturbation and Observation" (P and O). This suggests that P and O is a commonly used technique for optimizing the performance of solar panels by continuously perturbing the system and observing how it affects the power output in order to find the maximum power point [5]. By conducting a current sweep, researchers or engineers can determine the current at which the PV device produces its maximum power output. This current, known as the Maximum Power Point (MPP) current, is a crucial parameter for optimizing the efficiency of the PV system. Once the MPP current is identified, the PV system can be designed or controlled to operate at or near this point to extract the maximum available power from the solar panels [6]. ANNs can be used to develop MPPT algorithms that dynamically adjust the operating point of a photovoltaic system to maximize power output under changing environmental conditions [7]. The point highlights the significance of artificial intelligence techniques, particularly artificial neural networks, fuzzy logic, and meta-heuristic algorithms are powerful tools in their own right, each with its unique strengths and applications, in addressing nonlinear processes and identifying relationships between variables [8]. These techniques are used to estimate to calculate the hourly global solar irradiation on tilted solar absorbers from horizontal measurements. In other words, they are applied to calculate how much solar energy is received by solar panels or absorbers that are tilted at an angle relative to the horizontal plane. This estimation is valuable for optimizing the positioning and orientation of solar panels to maximize energy capture [9]. Another application of artificial intelligence techniques, particularly artificial neural networks and other predictive models, in the field of solar energy is for predicting solar radiation (Figure 1) [10].
Literature Review
Outlines the structure and organization of the paper, providing an overview of the sections that follow. Here's a breakdown of what each section covers:
Section 2: Modeling of PV cells: This section explains modeling Photovoltaic (PV) cells involves developing mathematical relationships that describe how these cells convert sunlight into electrical energy that govern their behavior. It likely discusses the principles and equations used to describe how PV cells convert sunlight into electricity.
Section 3: Data collection methods: In this section, the paper discusses the methods used to collect data. This may include details on the sources of data, the types of measurements taken, and the instruments or techniques used for data collection.
Section 4: Certainly, the application of fuzzy logic and Artificial Neural Networks (ANNs) is prevalent in modeling complex and nonlinear processes in various fields it may provide insights into how these techniques are employed in the context of the study.
Section 4 (Continued): Evolutionary algorithms: Within the same section, the paper briefly introduces genetic algorithms, PSO is relatively simple to implement and computationally efficient. It may explain their relevance to the study.
Section 4 (Continued): MPPT application and comparison: This part of the section applies fuzzy inference systems In conclusion, comparing Fuzzy Inference Systems (FIS) and Artificial Neural Networks (ANNs) for Maximum Power Point Tracking (MPPT) using real-world data and performance metrics like RMSE and MAE is a valuable exercise for optimizing the efficiency of PV systems and understanding the trade-offs between different modeling approaches likely assessing the performance of these methods in optimizing PV system efficiency.
Section 5: Conclusion and discussion: The final section likely contains the paper's conclusions and discusses the implications of the study's findings. It may also mention areas for further research or applications of the techniques discussed.
In summary, the paper seems to focus on modeling Photovoltaic (PV) cells and optimizing their performance involves a combination of data collection, modeling techniques, and optimization algorithms for MPPT, and concludes with a discussion of the results and their significance.
PV modeling
The section discusses the modeling of Photovoltaic (PV) cells, specifically focusing on the equivalent circuits used for simulating their behavior. Here are the key points:
Equivalent circuits for PV Cells: Various equivalent circuits have been developed for simulating the behavior of photovoltaic cells.
Two major groups: These equivalent circuits are typically categorized into two major groups: single-diode and two-diode models.
Single-diode model: The passage mentions the single-diode model as one of the most common equivalent circuits for PV cells. It is presented in Figure 1. The single-diode model is a simplified representation used to describe how a photovoltaic cell converts sunlight into electricity. It is a widely used and accepted model in the field of photovoltaic, providing a basis for understanding and simulating the performance of PV cells and panels.
In Figure 1, several components and variables related to the equivalent circuit for the Photovoltaic (PV) panel are identified:
- IPV: This represents the photovoltaic current, which is the current generated by the PV cell due to incident sunlight.
- ID: This represents the diode current, which accounts for the behavior of the diode within the PV cell.
- RSH: This indicates the parallel resistance, which is a component of the equivalent circuit that represents the resistance in parallel with the PV cell.
- RS: This denotes the series resistance, which is another component of the equivalent circuit that represents the resistance in series with the PV cell.
- I: This variable represents the net cell current, which is the overall current produced by the PV cell.
Equation (1):
I=IPV-ID (1)

Figure 1: The equivalent circuit of a PV array.
Furthermore, the passage states that, by applying certain defined relations, the ultimate mathematical equation (Equation 2) of this model is extracted. This equation describes the current-voltage (I-V) properties of the photovoltaic panel and likely provides a mathematical representation of how the current output of the PV panel varies with changes in voltage. The specific form of Equation (2) may depend on the details of the equivalent circuit and modeling assumptions used in the study.
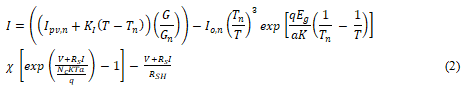
The equation you've provided, relation (1), is a mathematical model used to describe the behavior of Photovoltaic (PV) cells under varying environmental conditions. Here's an explanation of the parameters in this equation: IPV, n: Nominal current generated by the PV cells under standard or nominal conditions. This is the current output of the PV cell when it's exposed to Standard Test Conditions (STC), which typically include an irradiance level of 1000 W/m2 and a cell temperature of 25°C. It represents the cell's rated performance. KI: The current coefficient. It describes how the PV cell's current output changes with variations in temperature. It accounts for the temperature dependence of the PV cells current. T: Ambient temperature. This is the temperature of the surroundings in which the PV cell is operating. It affects the cell's performance as temperature changes can influence the current-voltage characteristics of the cell. Tn: Nominal temperature. This is the reference temperature at which the cell's nominal current (IPV, n) is defined. It's typically 25°C. G: Ambient radiation intensity. This represents the level of solar irradiance or sunlight intensity that falls on the PV cell. It's usually measured in watts per square meter (W/m2). Gn: Ambient nominal radiation intensity. Similar to IPV, n, this is the reference radiation intensity at which the cell's nominal current is defined. It's typically the solar irradiance under STC conditions. Io, n: Inverse saturation current under nominal conditions. It's a parameter related to the diode characteristics of the PV cell. It's typically defined at STC. q: The unit of electric charge. This is a fundamental constant in physics representing the elementary charge. Eg: Solid-state semiconductor gap energy. It's the energy difference between the valence band and conduction band in the semiconductor material used in the PV cell. It's a material property. Nc: The number of cells connected in series. This parameter is related to how multiple PV cells are connected within a PV module or panel. a: The cell's ideal coefficient. This parameter relates to the efficiency of the cell and is used to model its behavior. K: The Boltzmann constant. It's a fundamental constant in physics related to the behavior of particles in a physical system. This equation allows researchers and engineers to predict the current output of a PV cell under different environmental conditions, primarily temperature and solar irradiance. It's essential for modeling and optimizing the performance of PV systems and designing Maximum Power Point Tracking (MPPT) algorithms to maximize energy output. The equation helps understand how a PV cell's performance deviates from its nominal values under real-world conditions. Equation (2) represents the complexity of modeling a Photovoltaic (PV) cell's behavior, as it demonstrates that both temperature and radiation intensity significantly affect the cell's current, which in turn impacts its voltage and power output. Here's a breakdown of how temperature and irradiance influence the maximum power point (MPP) of PV panels:
- Effect of irradiance (Solar insolation): As shown in Figure 2, an increase in irradiance (solar insolation or sunlight intensity) generally leads to an increase in the power output of PV panels. This relationship makes intuitive sense: when more sunlight is available, the PV panels receive more energy, resulting in higher power production.
- Effect of temperature: Conversely, an increase in temperature tends to reduce the power output of PV panels. This is because elevated temperatures can cause several adverse effects on PV cell performance:
Increase in intrinsic carrier concentration: Higher temperatures can generate more electron-hole pairs in the semiconductor material of the PV cell, which can lead to increased leakage current. can generate more electron-hole pairs in the semiconductor material of the PV cell, which can lead to increased leakage current.
Reduced band gap: Temperature can reduce the energy bandgap of the semiconductor material, affecting the voltage characteristics of the cell.
Increased internal resistance: Elevated temperatures can increase the internal resistance of the cell, reducing its ability to deliver power to the load.
Due to these opposing effects, changes in temperature and irradiance cause the Maximum Power Point (MPP) of PV panels to shift. This means that under different environmental conditions (varying temperature and sunlight intensity), the PV panel's MPP will have a unique value.
To maximize the power output of a PV system, especially in realworld conditions where temperature and irradiance vary, researchers and engineers often employ Maximum Power Point Tracking (MPPT) algorithms. MPPT algorithms continuously adjust the operating point of the PV panels to ensure that they are operating at or near their MPP, thus optimizing the energy harvest from the system. These algorithms help mitigate the negative impact of changing environmental conditions and ensure that the PV system operates efficiently (Figure 2).

Figure 2: illustrates the impact of irradiance (solar insolation) and ambient temperature on the Maximum Power Point (MPP) of Photovoltaic (PV) panels. This information is crucial for understanding how the varying environmental conditions affect the performance of PV systems.
Equation (4) represents the mathematical model for the power output of photovoltaic (PV) cells, which is a complex function dependent on Temperature (T) and irradiance (G). This equation is essential for understanding how the power generated by PV panels varies with changing environmental conditions. Here's a breakdown of the key components of this equation:
- P(T, G): This represents the power output of the PV cells, which is the desired output of the PV system and is influenced by temperature and irradiance.
- IPV,n: This is the nominal current generated by the PV cells under standard conditions.
- KI: The current coefficient, which accounts for how the current changes with variations in temperature.
- T: Ambient temperature, which affects the PV cell’s performance.
- Tn: Nominal temperature, typically a reference temperature at which the PV panel’s performance is characterized.
- G: Ambient radiation intensity (irradiance), which is the amount of solar energy incident on the PV panel.
- Gn: Nominal radiation intensity, often a reference value for irradiance.
- Io,n: The inverse saturation current under nominal conditions, which is related to the properties of the diode in the PV cell.
- q: The unit of electric charge.
- Eg: The energy gap of the semiconductor material used in the PV cells.
- a: The cell’s ideal coefficient, which characterizes the relationship between temperature and current.
- K: The Boltzmann constant.
- V: The voltage across the PV cell.
- Rs: The series resistance in the equivalent circuit of the PV cell.
- I: The current through the PV cell.
- Nc: The number of cells connected in series.
- KTa: A temperature-dependent factor.
- RSH: The parallel resistance in the equivalent circuit of the PV cell.
This equation reflects the complex interplay between temperature and irradiance in determining the power output of PV cells. As environmental conditions change, the optimal operating point (maximum power point) for the PV panel also changes. To track and maintain operation at the maximum power point under varying conditions, Maximum Power Point Tracking (MPPT) algorithms are used. These algorithms adjust the operating voltage and current of the PV system to maximize power output, improving overall system efficiency.
Given the complexity of Equation (4), intelligent methods, such as artificial intelligence and optimization algorithms, are often employed to efficiently perform MPPT and ensure that the PV system operates at its peak performance under different environmental conditions. These methods can adapt to changing conditions and find the optimal operating point more effectively than conventional analytical techniques.
| 1 | Rated maximum power (Pmax) | 30 W |
| 2 | Power tolerance | 3% |
| 3 | Voltage at Pmax (Vmp) | 18.2 V |
| 4 | Current at Pmax (Imp) | 1.65 A |
| 5 | Open-circuit voltage (Voc) | 21.84 V |
| 6 | Short-circuit current (Isc) | 1.75 A |
Table 1: Provides the electrical characteristics of the photovoltaic panel you mentioned. These characteristics are essential for understanding the panel's performance and for modeling it in various applications.
These characteristics are fundamental for modeling and designing photovoltaic systems, especially for Maximum Power Point Tracking (MPPT) algorithms, which aim to extract the maximum power from the panel under varying environmental conditions.
The experimental procedure: Described in your text outlines the process used to collect data from an Isola solar panel. This data is essential for understanding the panel's performance under various conditions. Here's a summary of the experimental procedure:
Solar panel information: The electrical characteristics of the Isola solar panel, such as its rated maximum power (Pmax), voltage at maximum power (Vmp), current at maximum power (Imp), opencircuit voltage (Voc), and short-circuit current (Isc), are provided in Table 1.
Controlled environment: All experiments were conducted in a controlled Matlab environment to ensure that external factors like sunlight and heat did not affect the data collection process.
Light source: Were used to provide controlled light irrational. This controlled lighting is important for simulating different irradiance levels.
Variable load: To measure the panel's performance under various load conditions, 25 different resistances ranging from 22 ohms to 1 megaohm were used. Each resistance was individually connected to the solar panel to calculate different power outputs.
Data collection stages
Temperature regulation: The ambient temperature was controlled and monitored using a thermometer. Temperature is a critical factor affecting solar panel performance.
Irradiance measurement: Irradiance, which represents the level of incoming solar radiation, was regulated and measured using a measurement in simulation.
Voltage and current measurements: With irradiance and ambient temperature held constant, the electric current and voltage generated by the solar panel were measured for each resistance value.
Power calculation: The power generated by the solar panel was calculated for each resistance setting. Additionally, the Maximum Power Point (MPP) of the panel was recorded. The MPP is the point at which the panel produces its maximum power output.
Data generation: The data collection process resulted in two sets of data: One set with constant ambient temperature and irradiance, and another set with varying ambient temperature and irradiance. This dataset comprises a total of 60 records, including measurements of ambient temperature, irradiance, and the corresponding maximum power output of the solar panel.
This experimental procedure provided the necessary data for your research, which likely involves modeling and optimizing the solar panel's performance, especially in relation to Maximum Power Point Tracking (MPPT) under changing environmental conditions.
Results and Discussion
The results and discussion section of your research paper appears to focus on Maximum Power Point Tracking (MPPT) using a fuzzy logic-based approach. Here's an overview of this section:
Fuzzy logic-based MPPT
- A Mamdani-type fuzzy inference system was designed for MPPT.
- The system has inputs, which are the ambient temperature and irradiance, and an output, which is the maximum power value.
Data split for evaluation
The dataset was divided into two parts:
- 70% of the data was used for training the fuzzy system.
- 30% of the data was reserved for testing the system.
Evaluation metrics
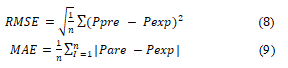
The performance of the fuzzy system was evaluated using two metrics:
- Root Mean Square Error (RMSE): A common measure of the differences between values predicted by the model (in this case, the fuzzy system) and the observed values (the actual data).
- Mean Absolute Error (MAE): Another measure of the magnitude of errors between predicted and actual values.
Algorithm characteristics
Presumably, Table 2 contains details about the characteristics and parameters of the fuzzy logic-based MPPT algorithm. These parameters likely influence the system's performance.
Performance evaluation
The fuzzy logic-based MPPT system was tested using the reserved 30% of the data.
RMSE and MAE were calculated to assess the system's accuracy in predicting the Maximum Power Point (MPP).
The results obtained from this fuzzy logic-based MPPT approach, as assessed by RMSE and MAE, will likely be discussed in more detail in this section. These metrics will provide insights into how well the fuzzy logic system performed in tracking the MPP under varying ambient temperature and irradiance conditions. Any observations, trends, or conclusions drawn from this analysis would be part of the discussion.
| And methods | Minimum |
| Or methods | Maximum |
| Implication's | Minimum |
| aggregations | Maximum |
| Defuzzifications | Centroid |
Table 2: Characteristics of the Mamdani Fuzzy Inference System (FIS).
It appears that you have provided additional details regarding the implementation of the fuzzy logic-based MPPT system. Let's summarize the key points:
Membership functions selection: The number of membership functions and their types for the input variables (ambient temperature and radiation intensity) and output variable (maximum power) were determined through a trial-and-error process. Specifically, 7 Gaussian membership functions were used for the ambient temperature input, 9 triangular membership functions for the radiation intensity input, and 12 triangular membership functions for the maximum power output.
Rule base: The number of rules in the fuzzy system was determined based on the number of membership functions used for the input variables. In this case, 63 fuzzy rules were employed.
Validation: A part of the code has been provided to validate the work. This code likely involves the implementation of the fuzzy logicbased MPPT system using the specified membership functions and rules the advantage of the fuzzy logic-based MPPT system you've described, as implemented in MATLAB, is its ability to automate the design process to a significant extent. Here are some key takeaways:
- Automation: The system automatically determines the number and type of membership functions for variables (ambient temperature and radiation intensity) without requiring manual design by an expert. This automation simplifies the setup process and makes it accessible for users without in-depth knowledge of fuzzy logic.
- Adaptability: The system can adapt to different scenarios and datasets. This means it can be applied to various scenarios for MPPT of solar panels without manual adjustments to the fuzzy logic system.
- Error minimization: The primary objective is to minimize prediction error, as indicated by the RMSE and MAE values. This automation aims to find the best combination of membership functions and rules that yield the lowest prediction error.
- User-friendly: By automating much of the design process, this system becomes user-friendly and accessible to a broader range of users, even those who may not have expertise in fuzzy logic or MPPT.
Overall, the system's automation and adaptability make it a promising tool for efficiently designing MPPT systems for solar panels, particularly in scenarios where manual expert intervention might be challenging or time-consuming. Users can focus on collecting data and evaluating results, rather than delving into the intricacies of fuzzy logic design.
MPPT using artificial neural networks
In this section, you mention that you employed a three-layer perceptron Artificial Neural Network (ANN) for Maximum Power Point Tracking (MPPT) and explored the possibility of combining this ANN with meta-heuristic algorithms. You used ambient temperature and irradiance as input variables and the maximum power value as the output. The performance of the ANN was The Root Mean Square Error (RMSE) and Mean Absolute Error (MAE) is commonly used evaluation metrics for regression problems.
ANNs are known for their ability to model complex and nonlinear relationships between variables, making them suitable for tasks like MPPT in solar panels. However, the choice of meta-heuristic algorithms for optimization can influence their performance. It's essential to choose the right combination of algorithms and fine-tune their parameters to achieve optimal results (Figures 3 and 4).

Figure 3: Fuzzy interference system configuration.

Figure 4: a) Perceptron artificial neural network b) Artificial neural network
The setup and configuration of an artificial neural network for a specific application. You've mentioned that 80% of the data were used for training, 20% for testing, and that the network uses a hyperbolic tangent activation function. The context of machine learning or optimization problems, you need to configure several parameters to control how the algorithm. Network is shown in Figure 4. The artificial neural network was trained using three different algorithms: Genetic algorithm, particle swarm optimization algorithm, and imperialist competitive algorithm. In this study, three distinct artificial neural networks were used, each characterized by the specific method training a neural network involves several key components and techniques. The fundamental parameters of these algorithms are delineated in Tables 3-5. In order to get optimal results, the algorithms have been configured to use a total of 500 replications. Provide a general overview of parameters commonly used in the context of simulating fuzzy logic, artificial neural networks, and meta-heuristic algorithms using MATLAB. The RMSE and MAE values derived from the approaches used in this study for both The training and test data are presented in Tables 6 and 7, respectively. The findings indicate that all of the used methodologies have successfully forecasted the Maximum Power Point (MPP) of the solar panel across various environmental circumstances. The modest differences seen in the statistical indices acquired from various sources suggest that reactive power is being used to maintain a stable voltage profile within the distribution network.
| Parameters | Value |
|---|---|
| Initial population | 72 |
| Selection percent | 21 |
| Crossover percent | 61 |
| Mutation percent | 21 |
| Max iteration | 600 |
Table 3: Genetic algorithm of different parameters.
| Parameters | Value |
|---|---|
| Initial of the particles | 71 |
| Max-iteration | 600 |
| C1 | 3 |
| C2 | 3 |
Table 4: Particle Optimization (PSO) is a population-based optimization algorithm that uses a swarm of particles to search for optimal solutions in a search space.
| Parameters details | |
|---|---|
| Number of the countries | 80 |
| starting point of the optimization process | 21 |
| Number of regions | 52 |
| Max - iteration | 600 |
Table 5: Imperialist Competitive Algorithms (ICAs), several parameters need to be set to configure and control the optimization process.
| Statistical-criteria | FL | ANN and GA | ANN and PSO | ANN and ICA |
|---|---|---|---|---|
| The RMSE (W) | 0.0062 | 0.0059 | 0.0056 | 0.0061 |
| The MAE (W) | 0.0053 | 0.0052 | 0.0044 | 0.0055 |
Table 6: RMSE (Root Mean Square Error) and MAE (Mean Absolute Error) values obtained for test data.
| Temperature-areas (â?¦C) | FLC | ANN and GA | ANN and PSO | ANN and ICA |
|---|---|---|---|---|
| 9.1 |
0.0068 | 0.0082 | 0.0085 | 0.0099 |
| 16 |
0.0058 | 0.0062 | 0.0091 | 0.0071 |
| 19.5 |
0.0061 | 0.0103 | 0.0079 | 0.0088 |
| 21 |
0.0057 | 0.0072 | 0.0051 | 0.0063 |
| 25 |
0.0067 | 0.0056 | 0.0035 | 0.0062 |
| 26 |
0.0072 | 0.0066 | 0.0071 | 0.0055 |
| 29.6 |
0.0067 | 0.0138 | 0.0122 | 0.0138 |
Table 7: This study investigates the effectiveness of fuzzy logic and artificial neural network models, employing meta-heuristic algorithms, over different temperature ranges. The assessment is conducted using the Root Mean Square Error (RMSE) metric.
The techniques employed. Furthermore, the appropriate trend and performance of each approach in monitoring the highest power point can be shown in Figures 5 and 6.

Figure 5: Presents a visual representation of the performance of the systems used inside the training area.

Figure 6: (a) and (b) that show diagrams related to Root Mean Square Error (RMSE) and Mean Absolute Error (MAE) in different thermal areas.
Comparative analysis of the outcomes obtained from the implemented algorithms
Comparison of various intelligent methods, including fuzzy logic and Artificial Neural Networks (ANNs) trained with Genetic Algorithms (GA), Particle Swarm Optimization (PSO), and Imperialist Competitive Algorithms (ICA), for Maximum Power Point Tracking (MPPT) in Photovoltaic (PV) systems under different temperature ranges. Based on the statistical indices presented in Tables 8 and 9, as well as the RMSE and MAE diagrams in different temperature areas, it appears that the fuzzy logic approach a specific modeling or optimization approach has outperformed other methods, including ANN-based methods (Genetic Algorithms or GA, Particle Swarm Optimization or PSO, and Imperialist Competitive Algorithms or ICA). Additionally, the fuzzy logic approach showed faster convergence to the optimal response. The research also assessed the complexity of implementation, with ANN-ICA being identified as the most complex among the ANN-based methods.
| Temperature areas (°C) | FL | ANN and GA | ANN and PSO | ANN and ICA |
|---|---|---|---|---|
| 9.1 |
0.0058 | 0.0073 | 0.0077 | 0.0083 |
| 16 |
0.0053 | 0.0048 | 0.0077 | 0.0067 |
| 19.5 |
0.0056 | 0.0086 | 0.0067 | 0.0077 |
| 21 |
0.0044 | 0.0058 | 0.0038 | 0.0052 |
| 25 |
0.0054 | 0.0051 | 0.0028 | 0.0056 |
| 26 |
0.0065 | 0.0055 | 0.0064 | 0.0049 |
| 29.6 |
0.0056 | 0.0103 | 0.0089 | 0.0103 |
Table 8: Presents the evaluation of the FL and ANN models, which were developed using meta-heuristic methods, over various temperature ranges. The performance of these models is assessed based the Mean Absolute Error (MAE) is a metric commonly used to evaluate the accuracy of ANN models.
| Method response | Time (minutes) |
|---|---|
| ANN-ICA refers to the combination of Artificial Neural Networks (ANNs) and Imperialist Competitive Algorithms (ICAs) | 04:17 |
| ANN-PSO refers to the combination of Artificial Neural Networks (ANNs) and Particle Swarm Optimization (PSO) | 06:02 |
| ANN-GA refers to the combination of Artificial Neural Networks (ANNs) and Genetic Algorithms (GAs) | 06:42 |
Table 9: Comparing various Artificial Neural Networks (ANNs) involves assessing their performance, architecture, and suitability for specific tasks.
Fuzzy logic vs. Artificial Neural Networks (ANNs): Fuzzy logic outperformed ANNs (trained with GA, PSO, and ICA) in terms of stability and accuracy for predicting Maximum Power Points (MPPs) in PV systems across different temperature ranges. The fluctuation of fuzzy logic results was lower than that of ANNs, which exhibited similar performance among themselves.
Convergence and speed: Fuzzy logic achieved faster convergence to the optimal response, taking less than 2 seconds to reach the solution. In contrast, ANN-based methods required at least 500 iterations, significantly prolonging the calculations.
Complexity: The complexity of implementation was assessed based on coding complexity. Among the ANN-based methods, ANN-ICA, ANN-GA, and ANN-PSO were considered more complex than fuzzy logic. Reproducibility: The research ensured the reproducibility of the methods by running the systems three times, which yielded consistent results.
Conclusion: The comparison results strongly support the superiority of the designed fuzzy logic approach in tracking MPPs. While ANNs, particularly with meta-heuristic algorithms, performed well within certain temperature ranges, their reliability was affected by major fluctuations. Therefore, the fuzzy system is proposed as a cost-effective and efficient method for MPPT.
Conclusion
Research highlights the innovative use of fuzzy logic when it comes to modeling and optimizing Photovoltaic (PV) systems, Artificial Neural Networks (ANNs) enhanced by integrating Genetic Algorithms (GAs), Particle Swarm Optimization (PSO), and Imperialist Competitive Algorithms (ICAs), to create a rapid and highly effective method for Maximum Power Point Tracking (MPPT) in solar panels. The study involved extensive comparisons between these methods, focusing on their stability, computational speed, and implementation complexity. The results demonstrate that the developed fuzzy logic approach surpasses the other methods in terms of:
- Speed: It achieves faster convergence to the optimal solution compared to the alternative methods.
- Accuracy: The fuzzy logic method exhibits higher accuracy in predicting maximum power points.
- Ease of implementation: Implementing the fuzzy system is relatively straightforward, and it does not require specialized expertise, making it accessible for a wider range of users.
- Stability: The fuzzy logic approach demonstrates Achieving greater stability against changes in ambient conditions is a crucial objective in the design and operation of Photovoltaic (PV) systems.
Based on these findings, it can be concluded that the proposed fuzzy logic method is well-suited for MPPT in solar panels. Its speed, accuracy, ease of implementation, and robustness make it a valuable tool for optimizing power generation in photovoltaic systems. This research contributes to the field of renewable energy by providing an efficient and accessible solution for improving the performance of solar panels.
References
- Al-Majidi SD, Abbod MF, Al-Raweshidy HS (2018) A novel maximum power point tracking technique based on fuzzy logic for photovoltaic systems. Int J Hydrogen Energy 43: 14158-14171.
- Falkner R (2018) Climate change, international political economy and global energy policy. InHandbook of the International Political Economy of Energy and Natural Resources. Edward Elgar Publishing. 77-88.
- Chaibi Y, Malvoni M, Chouder A, Boussetta M, Salhi M (2019) Simple and efficient approach to detect and diagnose electrical faults and partial shading in photovoltaic systems. Energy Conv Manag 196: 330-343.
- Messai A, Mellit A, Guessoum A, Kalogirou SA (2011) Maximum power point tracking using a GA optimized fuzzy logic controller and its FPGA implementation. Solar Energy 85: 265-277.
- Othman AM, El-arini MM, Ghitas A, Fathy A (2012) Realworld maximum power point tracking simulation of PV system based on Fuzzy Logic control. NRIAG J Astron Geophys 1: 186-194.
- Duru HT (2016) A maximum power tracking algorithm based on Impp=f (Pmax) function for matching passive and active loads to a photovoltaic generator. Solar Energy 80: 812-822.
- Zegaoui A, Aillerie M, Petit P, Sawicki JP, Charles JP, et al. (2011) Dynamic behaviour of PV generator trackers under irradiation and temperature changes. Solar Energy. 85: 2953-2964.
- Masoum MA, Dehbonei H, Fuchs EF (2022) Theoretical and experimental analyses of photovoltaic systems with voltageand current-based maximum power-point tracking. IEEE Trans. Energy Convers 17: 514-522.
- Habibi MN, Windarko NA, Tjahjono A (2019) Hybrid maximum power point tracking using artificial neural network-incremental conduction with short circuit current of solar panel. In2019 International Electronics Symposium (IES). IEEE.
- Joshi P, Arora S (2017) Maximum power point tracking methodologies for solar PV systems–A review. Renew Sustain Energy Rev 70: 1154-1177.