Spanish
  Chinese
  Russian
  German
  French
  Japanese
  Portuguese
  Hindi
Hindi Research Article, J Polym Sci Appl Vol: 2 Issue: 1
Oxygen Permeability Properties of Ethylene Methyl Acrylate/ Sepiolite Clay Composites with Enhanced Mechanical and Thermal Performance
Subhadip Mondal1, TusharKanti Das1, SayanGanguly1, Poushali Das2, Revathy Ravindren1, Subhashis Sit3, Sabyasachi Ghosh1 and Narayan Ch Das1*
1Rubber Technology Centre, Indian Institute of Technology, Kharagpur, 721302, India
2School of Nanoscience and Technology, Indian Institute of Technology, Kharagpur 721302, India
3Department of Mechanical Engineering,Indian Institute of Technology, Kharagpur 721302, India
*Corresponding Author : Narayan Ch. Das
Rubber Technology Centre, Indian Institute of Technology, Kharagpur, 721302, India
Tel: 03222-283190
E-mail: ncdas@rtc.iitkgp.ernet.in
Received: June 15, 2017 Accepted: August 24, 2017 Published: August 28, 2017
Citation: Mondal S, Das TK, Ganguly S, Das P, Ravindren R, et al. (2017) Oxygen Permeability Properties of Ethylene Methyl Acrylate/Sepiolite Clay Composites with Enhanced Mechanical and Thermal Performance. J Polym Sci Appl 1:2.
Abstract
A facile, eco-friendly, and industrially viable melt mixing method was introduced to incorporate sepiolite (SP) clay into ethylene methyl acrylate (EMA) matrix for the fabrication of transparent, highly flexible, and mechanically/thermally stable composites. The structural information was investigated by Fourier transform infrared spectroscopy (FTIR) and X-ray diffraction (XRD) analysis. The ultraviolet-visible spectroscopy (UV) study also indicates the transparency of the composites. The electron micrographs were employed to characterize the dispersion of SP clay inside the EMA matrix and also revealed proper dispersion of SP clay in EMA matrix. The strong polymer-filler interaction is responsible for enhanced properties of EMA composites with SP clay content, that evaluated by both bound rubber content and dynamic mechanical analysis. The proposed composites demonstrate the improved thermal, mechanical properties as compared to pure EMA matrix. The significant deterioration of oxygen permeability and water absorption performance of EMA/SP clay composites may be attributed to the well dispersion of SP clay inside the EMA matrix and improved restriction of the free movement of EMA molecular chains. Thus, the proposed EMA/SP composites show a high potential in the membranes and packaging application
Keywords: Ethylene methyl acrylate; Sepiolite clay; Mechanical property; Bound rubber content; Oxygen permeability; Water absorption; Thermal property
Introduction
Last few decades, polymer nanocomposites containing clay nanofillers have attracted a promising deal of both academic and industrial attention due to the improvements in the various desired properties with their relatively low-cost, ease of process ability, and easy handling [1-4]. The successful fabrication of well dispersed nanoclay in polymer matrix that results in the improved mechanical robustness, thermal durability, flame retardancy, water resistance, and gas barrier performance as compared to their unfilled state [4-7].
Recently, several investigations have been performed on the incorporation of nanofillers such as carbon nanofiber , carbon black, carbon nanotube, layered silicates, halloysite nanotube, montmorillonite, etc., inside the polymer matrix whereas only few works have been reported on one-dimensional sepiolite nanoclay [1,8-14]. Sepiolite is a special class of fibrous hydrated magnesium silicate (Si12O30Mg8(OH)4(OH2)4.8H2O) consisting of two tetrahedral silica sheets enclosing a octahedral magnesia layer with an average length of 44 μm and an average diameter of 100-150 nm [7,15]. SP clay has enormous advantages in potential application because of its non-toxic nature, low-cost, wide availability, easy handling, anisotropic morphology, and high surface area [7,16]. In addition, their unique features (nanorod structure) and presence of silanol groups (Si-OH) can enhance the molecular adsorption, molecular transport, and interfacial interaction between SP clay and polar polymers [17,18]. EMA copolymer, being polar in nature, is an appropriate choice for fabrication of nanocomposites with unmodified SP clay.
EMA is the synthetic copolymer of ethylene (non-polar) and methyl acrylate (polar) segments formed through free radical polymerization which can be used as electrical insulation, high temperature applications, low temperature applications, packaging/ membrane applications, and high voltage electrical applications [19,20]. Moreover, it has some unique properties such as good thermal, weather, heat and chemical resistance, excellent insulation, excellent flexibility, respectively [19]. Here, EMA and SP clay have been used as the base polymer matrix and reinforcing nanofiller, respectively. The dispersion of nanoclay in polymer matrix has immense trouble because of their aggregation tendency. However, the compatibilizers are used to overcome this profound problem but it suffers from high cost and rigorous chemical reactions. To reduce these problems, much promotion has been made to figure out via incorporation of SP clay in polar EMA copolymer by applying high shear assisted singlestep melt mixing strategy.
Despite of an extensive search, detailed study on mechanical, thermal, oxygen permeability and water absorption of EMA/SP composites has not been reported. In this present study, our great attention hold on the fabrication of EMA/SP composites using industrially viable melt mixing process and evaluate the effect of SP clay content on the mechanical, thermal, oxygen permeability, and water uptake properties of EMA composites.
Experimental
Materials
Commercial grade of ethylene methyl acrylate (EMA) copolymer (Elvaloy® 1330 DuPont) with 30 wt% methyl acrylate content, and density of 0.95 gm/cm3 was gifted from Nicco Corporation Limited, India. Sepiolite clay was purchased from Sigma Aldrich, India.
Preparation of EMA/SP composite by melt mixing
EMA and SP clay were dried separately in vacuum oven for 10 h at 60°C to remove the entrapped moisture. Different amount of SP clay have been incorporated separately to pure EMA in a BrabenderPlasticorderPLE-330 at 140˚C for 10 min with a constant rotor speed of 60 rpm. After melt blending, the melt composites were sheeted out through two rollmill with 1 mm nipgap. Further, the compounded sheets were hot compressed in a hydraulic press (Moore Presses, George E. Moore and Sons Birmingham Ltd, UK) at 160°C for 5 min under 5 MPa pressure to prepare sheets with an average thickness of ~2.0 mm for further characterization. Before removing the samples the mold was cooled to room temperature under the same constant pressure. Melt mixing strategy of EMA/SP composites is shown schematically in Figure 1.

Figure 1: Schematic representation of preparation of EMA/SP composites.
The resultant composites were labeled as ‘EMSP-X’; where ‘EM’ stands for ethylene methyl acrylate copolymer (EMA), ‘SP’ represents sepiolite clay particles; and ‘X’ stands for wt% of clay.
Material characterization
The Fourier transformed infrared spectroscopy (FTIR) spectra of the SP clay and EMA/SP composites were measured on a Perkin-Elmer FTIR spectrometer (model-Spectrum-2, Singapore)in attenuated total reflection (ATR) mode inthe range of 4000-400 cm-1.Wide angle X-ray diffraction (WAXD) profile of the EMA/SP composites were studied at room temperature in a X-ray diffractometer (model: X'Pert PRO, made by PANalytical B.V., Netherlands) using Nifiltered Cu Kα radiation (λ=1.5418 Å) and a scanning rate of 0.005° (2θ)/s). The angle of diffraction was varied from 5-740°. The UV-vis spectra of the pristine EMA sheet and the EMA/SP composite sheets were performed in a UV-visible spectrophotometer, Perkin Elmer, Lambda 35. The cryo-fractured surface morphology of the goldpalladium alloy coated EMA and EMA/SP composites was observed by using scanning electron microscope (SEM, ZEISSEVO-60, Carl ZEISSSMT, Germnay) with the accelerating voltage set to 5 kV. The bulk morphology was investigated by using transmission electron microscope (FEI-TECHNAI G2 20S-TWIN, TEM, USA) operated at 120 kV. The composite specimens for TEM analysis was prepared by an ultra cryomicrotome (Leica ultracut EM, FCS, GmbH, Austria) using sharpened glass knives with cutting edge of 45o to get cryo-sections having thickness around 300 nm at around -60°C. The cryo-sections were then placed by a loop on a 400 mesh copper grid. Bound rubber content of composites was measured by extracting the unbound rubber portion in THF solvent for 7 days at 25-30°C. The rubber specimens are weighted before and after solvent extraction. Solvent was refreshed daily for separating unbound rubber fractions from the system. The dynamic mechanical properties were investigated by using Dynamic Mechanical Analyzer, Metravib 50N, France, at a constant frequency of 10 Hz, a strain of 0.001%, and temperature ranges from -70°C to 100°C at a heating rate 3°C /min. The mechanical properties were carried out using a Universal testing machine (UTM), Hounsfield H 10KS (UK) at a constant crosshead speed of 500 mm/min with a fixed jaws gap of 40 mm as per ASTM D412-98 standard. Dumb-bell shaped tensile testing specimens (40 mm (length) × 4 mm (width) ×2mm (thickness) were punched out from the molded samples using a standard cutting die (ASTM Die C). The hardness in Shore A scale was measured by Rex Duro meters, Model 2000, Buffalo Grove (ASTM D2240). All results were reported on the average value of three measurements. The thermal stability was measured by using thermo gravimetric analyzer (TGA50, Shimadzu, Japan) in nitrogen atmosphere at scanning rate of 10°C/min. Tests were performed from room temperature to 700°C. The sample weight was about 10-12 mg. The water absorption was measured on specimens (10 mm × 10 mm × 3.5 mm3) which were dried under vacuum oven at 85°C prior to immersion in distilled water at 25-27°C for 2,24, and 48 h. Weight gain of specimens were measured after removal of the specimens from water. The oxygen permeability of EMA composites was investigated using a constant pressure system and soap bubble flow meter. Oxygen permeation measurements were carried out at 25°C with feed gas pressure of 5 bar gage. The average value of three specimens from every formulation was reported. The gas permeability is expressed as the volume rate of gas penetrating the unit thickness rubber at constant temperature and pressure, and calculated using following equation, P = (l/AΔP)×(dV/dt), where P is the permeability in barrer, l is the thickness of the composites in meter, A is the effective surface area (12.5 × 10 -4 m2), ΔP is the pressure difference across the membrane, t is the permeation time in second, and V is the volume of gas permeated through the composite membrane (m3(STP)).
Results and Discussion
FTIR analysis of EMA/SP composites
The FTIR spectra of EMA and EMA/SP composites are displayed in Figure 2a. As can be seen, a very substantial absorption peak of EMA is visible at 1736 cm-1 due to carbonyl (-C=O) stretching vibration of the ester group and also two strong absorption peaks are observed at 1156 cm-1 and 1200 cm-1 that may be attributed to the stretching of ethereal linkage (O-C) and the O-CH3 stretching of the methyl ester group, respectively [20]. The EMA characteristic peaks are in 2922 cm-1 and 2847 cm-1 for the –CH stretching of the ethylene segment [7]. From the Figure 2b, the characteristic bands of SP claycan be observed at 3694 cm-1, 3662 cm-1, 3562cm-1 and 1661 cm-1 which are assigned to O–H stretching vibration of inner-surface hydroxyl groups, zeolitic water, or coordinated bonded water molecules, and deformation of water respectively [17]. The peaks observed at 3630 and 3562 cm-1 are ascribed to the Mg-OH groups [17]. The bands observed at 1210, and 1021-975 cm-1 for Si-O-Si in plane vibration whereas the peak at 778 cm-1 is due to the-OH deformation vibration. The peak at around 690-645 cm-1 is due to the Mg3OH bending vibrations. The absorption peak at 1736 cm-1 is capable of being involved in hydrogen bonding between methyl acrylate groups and Si-OH groups [17]. It can be also seen that this absorption peak shift to the lower values with the addition of SP clay nanofiller, indicating the presence of strong hydrogen bonding.

Figure 2: FTIR spectra of pure EMA and EMA/SP composites.
XRD analysis of EMA/SP composites
The XRD patterns of pure EMA, SP clay and EMA/SP composites with varying SP clay are displayed in Figure 3. From the Figure 3, it is seen that the intense diffraction peaks of sepiolite are visible at around 7.20°, 11.54°, 13.06°, 19.54°, 20.45°, 23.55°, 26.31°, 27.76°, 34.79°, and 36.59°. This result has widely been reported in the published literature [7,15,17,21]. The XRD pattern of EMA matrix depicts the main peak at 21.6° which suggests the crystalline nature of monoclinic α-form of ethylene domains [19]. The characteristic SP clay peaks at 7.2o, 23.47°, and 26.51° are gradually increased with SP clay loading in EMA/SP composites.

Figure 3: XRD patterns of pure EMA, SP clay, and EMA/SP composites.
UV analysisand transparency of EMA/SP composites
Figure 4a shows the optical transparency measurement of the composite films. Pristine EMA (unfilled) showed around 79% optical transparency. But with filler loading the % transmittance value decreased. Up to 3 wt% filler loading the transparency decreased marginally (approx. 4% decrement), but beyond 5 wt% the composite lose transparency drastically. For 5 wt% the transparency was around 64% which decreased to 56% for maximum loading of 10 wt%. 56 % transparency normally referred to translucency of the composites which had been revealed in the present work even at high filler loading (here 10 wt%). 5 wt% loading can be termed as a ‘threshold loading’ beyond which the optical transparent character diminished gradually and a translucency arose.

Figure 4: (a) UV spectra, (b) digital images of transparent pure EMA and EMA/SP composites (0.5 mm thickness).
Digitally taken images in Figure 4b also affirm the transparency of the EMA-SP composites. The image revealed that with clay loading, the transparency demerits gradually, but in low filler loading there was no such severe degradation of transparency. This result also corroborates the polar-polar interaction between clay surface and EMA pendant polar moieties. Because of superior miscibility between these two phases the composite showed macroscopically a non-phase separated homogeneous transparent nanocomposite.
SEM analysis of pure EMA and EMA/SP composites
The dispersion and distribution of nanofiller in a polymer matrix is one of the key factors for final performance of composites. SEM study can be used for evaluating the interfacial interaction and adhesion between nanofiller and the polymer chains. Figure 5(a-f) shows the SEM micrographs of the fractured surfaces of the EMA/SP composites containing 0-10 wt% SP clay loading. SP filler are clearly observed like tubular stick at the rough cryo-fractured surfaces of the EMA composites. It is seen that the SP filler are well dispersed in in EMA matrix whereas very few aggregates are found in the composites at higher SP filler loading. Existence of a few scattered aggregates of clay in EMA matrix indicates sufficient dispersion and distribution of SP filler due to the strong filler-polymer and interfacial adhesion between SP filler and the polar moiety of the ethylene methyl acrylate copolymer [17]. It is seen that the individual SP fillers were not pulled out from the EMA fractured surface and also voids and porosity were not found on the fractured surfaces. Expectedly, the strong interfacial adhesion between the SP filler and EMA molecular chains are theresult of physisorption of polymer chains on hydroxyl functional groups anchored SP filler surfaces. This dispersion state could also be demonstrated by TEM micrographs.

Figure 5: Cryo-fractured SEM images of EMA and EMA/SP composites, (a) pure EMA, (b) 1 wt%, (c) 3 wt%, (d) 5 wt%, (e) 7 wt%, and (f) 10 wt% SP clay content. The arrows indicate the SP clay and circles indicate the aggregation of SP clay.
TEM analysis of EMA/SP composites
Assessment of bulk dispersion state of the nanofiller inside the polymer matrix was studied by TEM micrographs, and this is essential to understand the composite properties. The TEM micrographs of EMA/SP composites with different SP clay loading (1, 3, 5, and 10 wt%) were displayed in Figure 6 (a-d). From the figure, it is obvious that the dark lines are the SP clay filler (needle type) and each layer is well dispersed inside the EMA matrix. The dispersion of SP clay in EMA matrix is effected with increasing SP clay loading. At lower SP clay loading (1-5 wt%), the proper dispersion of SP clay filler is observed in EMA matrix whereas at higher loading, well dispersed clay in EMA matrix with minor aggregation is also observed. In addition, the SP fillers form a network like architecture inside the EMA matrix phase due to the applied high shearing force, which may be responsible for the good properties of the EMA/SP composites. This can be attributed from the strong interaction between SP clay and EMA matrix through polar-polar interaction between the SP clay (needle structure, presence of surface functionalities) and EMA matrix (presence of polar group).

Figure 6: TEM images of EMA/SP composites, (a) 1 wt%, (b) 3 wt%, (c) 5wt%, and (d) 10 wt% SP clay content.
Bound rubber content (BRC) of EMA/SP composites
Bound rubber content experiment was performed to evaluate trapping of rubber chains in the nanofiller surface within the polymer composites that cannot be extracted by suitable solvent. Mainly, determination of adherence of polymer chains on the available filler surfaces in composites and calculated by using following equation,
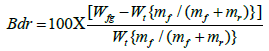
where Wfg and Wt are the weight of swollen rubber filler-gel and the rubber sample. mf and mr are the weight fraction of the nanofiller and rubber in composite [19]. The BRC of the EMA/SP composites with SP clay nanofiller content is shown in Figure 7. From the figure, it is found that the BRC of EMA composites increases with the increase in SP clay content.This result is attributed to some factors [19,22]; (i) physico-chemical strong adsorption of EMA chains on available SP clay surfaces, (ii) high surface area and surface activity of SP clay, (iii) polarity enhances the interfacial interaction between EMA chains and clay surfaces, and (iv) proper dispersion of SP clay filler within the EMA matrix that demonstrates the strong polymer-filler interactions between SP clay and EMA molecular chains.

Figure 7: Bound rubber content of EMA/SP composites.
Dynamic mechanical analysis (DMA) of pure EMA and EMA/SP composites
The interactions between the nanofiller surfaces and polymer chains play a significant role in results obtained by thermodynamomechanical analysis. It is an important technique to measure mobility transitions related to the relaxation of different segments of the polymer chains as well as evaluate the response to elastic deformation and damping behavior with a sinusoidal load [23]. Herein, we measure the storage modulus and main relaxation (tanδ) corresponding to glass transition temperature with the variation of temperature (-70 to 90°C) as shown in Figure 8a and b. The storage modulus of EMA/SP composites increases with the increase in the SP clay content which may be due to the restriction of EMA molecular chains through strong adsorption on SP clay surfaces (Figure 8a). The storage modulus value decreases progressively as temperature increases and a drastic decrease is observed at temperature close to the Tg of the composites. This behavior confirms that the rigidity increases with higher SP clay content and also related to the good polymer-filler interaction between SP clay and EMA chains. The damping behavior (tanδ) is also represented the molecular relaxation mechanism in the EMA matrix during glass transition. It is noted that the Tg increases from-24.9°C for pure EMA matrix to -16.1°C for EMSP-10 composite (Figure 8b). The tanδmaximum is slightly shifted to higher temperature which intimately related with the microstructure and good interaction of the composites [19]. In addition, the increased Tg of the composites have been found due to the EMA molecular chains are strongly tied down by the SP clay surfaces.

Figure 8: (a) Storage modulus, (b) damping behaviour of pure EMA and EMA/SP composites as function of temperature, inset signifies the magnified modulus portion at around glass transition temperature.
Mechanical properties of pure EMA and EMA/SP composites
The reinforcing effects of nanofillerfor polymer matrices are influenced by various factors such as nanofiller type, polymer type, the degree of dispersion and distribution of filler inside the polymer matrix and their interfacial interactions. For the evaluation of the mechanical properties of EMA composites with SP clay loading, stress-strain curve of composites were investigated (Figure 9). The effect of SP clay on the mechanical properties (tensile strength, elongation at break, modulus, and hardness) of the EMA composites was studied in Figure 10(a-d). Pure EMA exhibits the tensile strength value of 7.8MPa whereas with the increased amount of the SP clay, the tensile strength of the composites increases significantly (Figure 10a). This behavior revealed the better interfacial interaction, proper dispersion, higher concentration, and reinforcing efficiency of SP clay in EMA matrix. In addition, presence of network architecture of SP clay becomes able to distribute the stress from the nanofiller to viscoelastic polymer phase. At the same time, the modulus and hardness values calculated from stress-strain curve increases when the SP clay loading is increased from 1 to 10 wt% (Figure 10b and 10d). This behavior not only depends on the enhancing degree of stiffness but also on the nanofiller content and proper chain entanglement [7,12]. On the other hand, the elongation at break value increases with increasing SP clay loading which describe the strong adsorption, interaction, and trapped rubber chains on SP clay filler surfaces, facilitating enhancement of resistant to crack propagation and higher strain that can be tolerated by the EMA composites (Figure 10c) [10,17]. Therefore, it can be realized that the strong interfacial interaction, proper dispersion and good adhesion of SP clay in the EMA composites are attributed to the improved mechanical properties.

Figure 9: Stress- strain curve of pure EMA and EMA/SP composites.

Figure 10: Mechanical properties of pure EMA and EMA/SP composites, (a) tensile strength, (b) modulus, (c) elongation at break, and (d) hardness.
Flexibility of EMA/SP composites is shown in Figure 11 (a and b). The digital photographs (bent and rolled state) of composite (EMSP- 10) demonstrate the high flexible behavior of EMA/SP composites.

Figure 11: Flexibility study of EMA/SP composite (EMSP-10) at 2 mm thickness, (a) bent and (b) rolled state.
Thermal durability of pure EMA and EMA/SP composites
Thermogravimetric (TGA) and differential thermogravimetric (DTG) analysis of the EMA/SP composites are measured to characterize the thermal durability and serviceability upon exposure to temperature (Figure 12 (a and b))[24]. Figure 12 and Table 1 data describe the thermal durability of EMA/SP composites with SP clay loading as a function of temperature range of 40-700°C under nitrogen atmosphere. From the Figure 12, it is obvious to note that the thermal stability increases with the increase in SP clay content which implying the improved dispersion and intercalated structure of SP clay. TGA curves, the one step degradation process of composites is observed at 390oC due to decomposition of the methoxycarbonyl side groups followed by β C-C scission [19]. In addition, the thermal durability such as 5% weight loss (T5), 10% weight loss (T10), 20% weight loss (T20), 30% weight loss (T30), and maximum mass loss (T1max) of EMA/ SP composites was improved upon the addition of SP clay nanofiller at proposed temperature (Table 1). The residue of composites increases with increase in SP clay content at 700°C. The first onset degradation value of EMA/SP composites with the addition of SP clay filler was significantly increases as 468°C,469°C, 471°C, 474°C, 477°C, and 480.1°C, respectively. Expectedly, the enriched thermal durability may also due to the restricted mobility of chains and excellent adhesion between SP clay and EMA molecular chains.

Figure 12: (a) TGA (b) DTG analysis of pure EMA EMA/SP composites under nitrogen atmosphere, inset describes 5% mass loss(upper figure) and formation of residue (below figure).
| Sample designation | T1max (˚C) | T 5% loss (˚C) | T 10% loss(˚C) | T 20% loss(˚C) | T 30% loss(˚C) | T 50% loss(˚C) | % Residue (char) |
|---|---|---|---|---|---|---|---|
| Pure EMA | 468 | 386 | 411 | 430 | 440 | 453 | 1.2 |
| EMSP-1 | 469.3 | 390 | 417 | 437 | 448 | 461 | 2.2 |
| EMSP-3 | 471.1 | 394 | 418 | 439 | 450 | 463 | 3.9 |
| EMSP-5 | 474.2 | 397 | 421 | 442 | 453 | 468 | 6.8 |
| EMSP-7 | 477.3 | 402 | 427 | 446 | 456 | 471 | 9.1 |
| EMSP-10 | 480.1 | 405 | 433 | 453 | 463 | 478 | 11.2 |
Table 1: Thermal stability data of pure EMA and different EMA/SP composites.
Oxygen permeability of pure EMA and EMA/SP composites
The oxygen permeability value of pure EMA and EMA/SP composites is summarized in Table 2. From the table data, it is worthy noted that the oxygen permeability reduces up to 5 wt% SP clay loading as compared to pure EMA matrix whereas it increases with higher SP clay loading. The obtained results show similar trend with other investigations performed on polymer composites. The reduced permeability is depend on some factors such as (i) impermeable nature of SP clay nanofiller, (ii) presence of strong interfacial interaction, (iii) well dispersion of SP clay forms tortuous pathway, (iv) presence of amorphous region, (v) lower free volume, (vi) hydrogen bonding, and (vii) good chemical affinity between oxygen molecules and composite membrane [12,25-27]. The clay nanorods in polymer matrix lead to an increment in diffusion distance after creating a lengthier tortoise pathway for the diffusing gas than pristine polymer. Contrarily, the oxygen permeability increases with 7 and 10 wt% Sp clay loading. The cause of such result is dominance of filler-filler interaction than polymer-filler interaction [12]. The filler-filler surface cohesive force restricts the polymer chains to reach their close proximity even at high shear. Thus polymer physisorption on to the SP clay surface is very hard to occur, which results improper dispersion of SP clay nanorods and inferior barrier property as well mechanical features.
| Composites | Oxygen permeability (barrier) | Water absorption (%) | ||
|---|---|---|---|---|
| 2 h | 24 h | 48 h | ||
| Pure EMA | 3.12 | 0.82 | 1.45 | 1.82 |
| EMSP-1 | 2.87 | 0.56 | 0.86 | 0.98 |
| EMSP-3 | 2.45 | 0.28 | 0.41 | 0.53 |
| EMSP-5 | 2.23 | 0.19 | 0.31 | 0.47 |
| EMSP-7 | 2.76 | 0.26 | 0.34 | 0.51 |
| EMSP-10 | 2.97 | 0.39 | 0.53 | 0.84 |
Table 2: Oxygen permeability and water absorption of pure EMA and its composites.
Water absorption of pure EMA and EMA/SP composites
Water absorption is the penetration of water molecules into the absorbing solid surface [28]. Mainly, absorption process is attributed to the contact of a free liquid phase with a solid phase that is able to hold the liquid on the solid surface. The water absorption test was determined by % weight gain and calculated as follows; % weight gain = {(WW – Wd)/ Wd} × 100, where WW and Wd refer to the weight of specimens after and before immersion in water, respectively [12]. Here, we measure the water absorption of EMA and EMA/SP composites for 2, 24, and 48 h as summarized in Table 2. From the Table 2, it is worthy noted that the water absorption of composites decreases with increase in SP clay content as compared to the pure EMA matrix. This behavior is attributed to the some factors [7,29,30]; (i) strong interfacial interaction, (ii) formation of hydrogen bond, (iii) well dispersion of nanofiller, (iv) less porosity and voids, (v) denser and more compact structure, (vi) high aspect ratio and higher surface energy of SP clay, and (vii) strong adhesion between SP clay and EMA matrix, which in turn reduces the diffusion of water molecules in the EMA composites. At higher SP clay loading, water absorption slightly increases which may be due to the presence of higher hydroxyl groups of SP clay.
Conclusion
EMA based flexible thermoplastic composites filled with SP clay were successfully prepared by industrially viable melt mixing process. The SEM and TEM micrographs verified well dispersion of SP clay inside the EMA matrix. The shift in carbonyl groups absorption peak to the lower wavenumbers is implied that the presence of strong hydrogen bonding interaction between SP clay and EMA matrix. The strong interfacial interaction and strong reinforcement of EMA composites was also confirmed by BRC and DMA analysis. The improved mechanical and thermal properties are also observed with the addition of SP clay content. The water uptake and oxygen permeability of EMA/SP composites were decreased with the addition of nanofiller loading. Hence, it can be concluded that melt mixed EMA/SP composites have potential interest for membrane applications, packaging applications, and airtight polymer products.
Acknowledgement
Subhadip Mondal is grateful to the Rajiv Gandhi National Fellowship, UGC (RGNF-2014-15 SC-WES-57061) for financially supporting this work sincerely.
References
- Devi KU, Deepalekshmi P, Valerio C, Sabu T (2015) Enhanced morphology and mechanical characteristics of clay/styrene butadiene rubber nanocomposites. Appl Clay Sci 114: 568-576.
- Hedicke-Höchstötter K, Lim GT, Altstädt V (2009) Novel polyamide nanocomposites based on silicate nanotubes of the mineral halloysite. Compos Sci Technol 69: 330-334.
- Liu M, Guo B, Du M, Lei Y, Jia D (2008) Natural inorganic nanotubes reinforced epoxy resin nanocomposites. J Polym Res 15: 205-212.
- Ganguly S, Das NC (2017) Water uptake kinetics and control release of agrochemical fertilizers from nanoclay-assisted semi-interpenetrating sodium acrylate-based hydrogel. Polymer-Plastics Technology and Engineering 56: 744-761.
- Deng S, Jianing Z, Lin Y, Jingshen W (2008) Toughening epoxies with halloysite nanotubes. Polymer 49: 5119-5127.
- Silva D, Mohd S, Goh L, Wahit U, Bee H (2016) Influence of the processing methods on the properties of poly (lactic acid)/halloysite nanocomposites. Polymer Composites 37: 861-869.
- Bidsorkhi HC, Mohd S, Pour RH, Mohamad Z (2014) Mechanical, thermal and flammability properties of ethylene-vinyl acetate (EVA)/sepiolite nanocomposites. Polymer Testing 37: 117-122.
- Mondal S, Nayak L, Rahaman M, Das NC (2017) An effective strategy to enhance mechanical, electrical, and electromagnetic shielding effectiveness of chlorinated polyethylene-carbon nanofiber nanocomposites. Composites Part B: Engineering 109:155-169.
- Mondal S, Ganguly S, Rahaman, M, Aldalbahi A, Chaki TK, et al. (2016) A strategy to achieve enhanced electromagnetic interference shielding at low concentration with a new generation of conductive carbon black in a chlorinated polyethylene elastomeric matrix. Phys Chem Chem Phys 18: 24591-24599.
- Hoang AS (2012) Electrical conductivity and electromagnetic interference shielding characteristics of multiwalled carbon nanotube filled polyurethane composite films. Adv Nat Sci-Nanosci 2: 025007.
- Ganguly S, Mondal S, Das TK, Das NC (2016) Synthesis of polydopamine-coated halloysite nanotube-based hydrogel for controlled release of a calcium channel blocker. RSC Advances 6: 105350-105362.
- Bidsorkhi HC, Adelnia H, Pour RH, Soheilmoghaddam M (2015) Preparation and characterization of ethylene-vinyl acetate/halloysite nanotube nanocomposites. J Mater Sci 50: 3237-3245.
- Ganguly S, Das NC (2015) Synthesis of a novel pH responsive phyllosilicate loaded polymeric hydrogel based on poly (acrylic acid-co-N-vinylpyrrolidone) and polyethylene glycol for drug delivery: modelling and kinetics study for the sustained release of an antibiotic drug. RSC Advances 5: 18312-18327.
- Yalçınkaya, E.E., (2014) Polynorbornene/MMT nanocomposites via surface-initiated ROMP: synthesis, characterization, and dielectric and thermal properties. J Mater Sci 49: 749-757.
- Chivrac F, Pollet E, Schmutz M, Averous L (2010) Starch nano-biocomposites based on needle-like sepiolite clays. Carbohyd Polym 80(1):145-153.
- Huang N, Chen ZJ, Yi CH, Wang JQ (2010) Synergistic flame retardant effects between sepiolite and magnesium hydroxide in ethylene-vinyl acetate (EVA) matrix. Express Polymer Letters 4: 227-233.
- Bhagabati P, Chaki TK, Khastgir D (2015) Chlorinated polyethylene (CPE)/ethylene methacrylate copolymer (EMA)/sepiolite nanocomposite via a facile one-step covalent modification technique. RSC Advances 5: 60294-60306.
- Tartaglione G, Tabuani D, Camino G, Moisio M. (2008) PP and PBT composites filled with sepiolite: Morphology and thermal behaviour. Compos Sci Technol 68:451-460.
- Mondal S, ganguly S, Das P, Das NC (2017) Low percolation threshold and electromagnetic shielding effectiveness of nano-structured carbon based ethylene methyl acrylate nanocomposites. Compos Part B-Eng 119: 41-56.
- Bhawal P, Ganguly S, Chaki TK, Das NC (2016) Synthesis and characterization of graphene oxide filled ethylene methyl acrylate hybrid nanocomposites. RSC Advances 6: 20781-20790.
- Qiu ZC, Zhang JJ, Niu Y, Huang CL, Yang KK et al. (2011) Preparation of poly (p-dioxanone)/sepiolite nanocomposites with excellent strength/toughness balance via surface-initiated polymerization. Industrial & Engineering Chemistry Research 50: 10006-10016.
- Sridhar V, Gupta B, Tripathy D (2006) Bound rubber in chlorobutyl compounds: influence of filler type and storage time. J Appl Polym Sci 102: 715-720.
- Bhagabati P, Chaki T(2014) Compatibility study of chlorinated polyethylene/ethylene methacrylate copolymer blends using thermal, mechanical, and chemical analysis. J Appl Polym Sci 131.
- Fukushima K, Tabuani Dand G. Camino G (2009) Nanocomposites of PLA and PCL based on montmorillonite and sepiolite. Mater Sci Eng: C 29:1433-1441.
- Urresti O, González, Fernández-Berridi, MJ, Iruin, JJ (2011) A Oxygen permeability through poly (ethylene-co-vinyl acetate)/clay nanocomposites prepared by microwave irradiation. J Membrane Sci 373: 173-177.
- Gavgani JN, Adelnia H, Gudarzi MM (2014) Intumescent flame retardant polyurethane/reduced graphene oxide composites with improved mechanical, thermal, and barrier properties. Journal of Materials Science 49: 243-254.
- Swain SK, Dash S, Behera C, Behera L (2013) Cellulose nanobiocomposites with reinforcement of boron nitride: study of thermal, oxygen barrier and chemical resistant properties. Carbohyd Polym 95: 728-732.
- Van Chau D (2012) A study on water absorption and its effects on strength of nano organoclay-epoxy composites. Journal of Applied Sciences 12: 1939.
- Soheilmoghaddam M, Mat U, Wahit MU, Whye (2014) Characterization of bio regenerated cellulose/sepiolite nanocomposite films prepared via ionic liquid. Polymer Testing 33: 121-130.
- Ladhari A, Daly HB, Hedi B, Denault J (2010) Investigation of water absorption in clay-reinforced polypropylene nanocomposites. Polym Degrad Stabil 95: 429-439.