Spanish
  Chinese
  Russian
  German
  French
  Japanese
  Portuguese
  Hindi
Hindi Research Article, J Liver Disease Transplant Vol: 6 Issue: 2
Performance of International Standard Formulae in Predicting Liver Volume in Living Liver Donors
Zakareya T1*, Abbasy M1, Abdel-Razek W1, Deif M2 and Zakaria H3
1Department of Hepatology, National Liver Institute, Menoufiya University, Shebeen El-Kom, Egypt
2Department of Radiology, National Liver Institute, Menoufiya University, Shebeen El-Kom, Egypt
3Department of Hepatopancreaticobiliary Surgery, National Liver Institute, Menoufiya University, Shebeen El-Kom, Egypt
*Corresponding Author : Talaat Zakareya, MD
Department of Hepatology, National Liver Institute, Menoufiya University, Shebeen El-Kom, Menoufiya, 32511, Egypt
Tel: +201111815877
E-mail: talaatzakareya@gmail.com
Received: June 23, 2017 Accepted: July 01, 2017 Published: July 08, 2017
Citation: Zakareya T, Abbasy M, Razek WA, Deif M, Zakaria H (2017) Performance of International Standard Formulae in Predicting Liver Volume in Living Liver Donors. J Liver Disease Transplant 6:2 doi: 10.4172/2325-9612.1000151
Abstract
Background: Accurate estimation of liver volume before living donor liver transplantation is crucial to guarantee adequate metabolic demands for both graft and remaining liver. Multiple international formulae based on donor biometrics were developed to predict the total liver volume. However, their accuracy still needs validation.
Aim: Aim to assess the accuracy of 13 international standard formulae based on donor biometric data in predicting total liver volume as assessed by CT (CT-LV) among Egyptian population.
Methods: Data of 253 consecutive living liver donors were reviewed. Biometric data including weight, height, body mass index (BMI), and surface area (BSA) as well as CT-LV were recorded for each donor.
Results: One hundred fifty-four donors had complete biometric and volumetric data. Most of them were males (64.3%). The mean age was 28.3 ± 6.8 years, weight 72.3 ± 10.9 kg, height 168.6 ± 8.9 cm, BMI 25.8 ± 3.2 kg/m2 and BSA 1.8 ± 0.2 m2. Mean CT-LV was 1566.7 ± 272.3 ml. Although calculated liver volumes by all formulae had significant linear relationships with CT-LV (P<0.0001), none of them was accurate in predicting CT-LV (R2=0.230-0.264)
Conclusion: None of the studied formulae was accurate in predicting total liver volume among the studied population. This limited accuracy could be due to inter-individual, inter-racial and/or inter-ethnic variations in biometric data.
Keywords: Total liver volume; CT volumetry; Standard liver volume formulae; Living donor liver transplantation
Introduction
Living donor liver transplantation (LDLT) has been established as a treatment for end-stage liver disease to overcome organ shortage and to expand the donor pool. Moreover, cultural, religious and historical beliefs still represent a major obstacle making deceased donor liver transplantation a prohibited practice in some countries. Accurate estimation of total liver volume, graft volume and remaining liver volume is essential to guarantee adequate metabolic demands for both recipient and donor and to avoid catastrophic drawbacks of both small for size graft and small remaining liver [1-5].
Multidetector computed tomography (MDCT) is the current gold standard modality for assessing the liver volume with a high rate of accuracy and a strong correlation with the actual liver volume [6,7]. However, the use of biometric data can accurately predict liver volume and is potentially considered a non-invasive, cheaper and quicker method and therefore could be more widely applicable [8].
Many formulae dependent on donor biometrics had emerged to predict total liver volume. Based on the studied population, there was some inter-racial and inter-ethnic variation in biometrics referred to variability in total body water, extracellular water, body surface area (BSA), body mass index (BMI) and prevalence of steatosis. This resulted in development of many international formulae with variable degrees of accuracy in predicting liver volume when applied on different groups of population [9-21].
In the current study, we studied the relationship between the calculated standard liver volume (SLV) using each of 13 reported international formulae and CT estimated liver volume (CT-LV) to evaluate the accuracy of these formulae in the prediction of liver volume among our population of living liver donors.
Methods
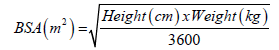
Data of 253 potential living liver donors who underwent laboratory and radiological pre-transplant evaluation in the liver transplantation center at the National Liver Institute, Shebeen El-Kom, Egypt were reviewed. Biometric data including weight, height, body mass index (BMI), and body surface area (BSA) were recorded for each one at the same day of CT volumetric study. Donors with missed biometric or CT volumetric data were excluded. We calculated BMI as weight in kilograms divided by height in meters squared and BSA using Mosteller’s formula [22]:
CT scans were recorded at 5-mm intervals using the 20-slice multidetector CT (Somatom Definition AS, Siemens, Germany). Liver outlinings were performed by a single operator who is well trained to recognize the relevant organ boundaries. Hepatic veins and intra-parenchymal portal venous system and the fissures that did not open into the abdominal cavity were included in the outlining. Whereas inferior vena cava, extra-parenchymal portal vein and the gall bladder were excluded [23]. Total liver volume was determined in milliliters using the automatic volumetry tool of Intellispace Portal (Philips Healthcare, Best, The Netherlands).
The SLV was calculated for each donor using the listed 13 international formulae in Table 1 then correlated with CT-LV.
| Investigators | Formula | Country |
|---|---|---|
| Urata et al. [9] | 705.2 × BSA + 2.4 | Japan |
| Hashimoto et al. [10] | 961.3 × BSA – 404.8 | Japan |
| Vauthey et al. [11] | 1267.28 × BSA – 794.41 | USA |
| Fu-Gui et al. [12] | 11.508 × BW + 334.024 | China |
| Chandramohan et al. [13] | 874.461 × BSA – 204.09 | India |
| Chan et al. [14] | 1.19 × [12.29 x× BW + 218.32 (+ 50.74 if male)] | Hong Kong |
| Poovathumkadavil et al. [15] | 12.255 × BW + 555.65 | Saudi Arabia |
| Yoshizumi et al. [16] | 772 × BSA (– 38 for BSA <1) | USA |
| Heinemann et al. [17] | 1072.8 × BSA – 345.7 | Germany |
| Chouker et al. [18] | Age 16-50 y: 452 + 16.34 x BW +11.85 × Age (– 166 if female) Age 51-70 y: 1390 + 15.94 × BW – 12.86 × Age |
Germany |
| Yu et al, 2004 [19] | 21.85 × BW 0.73 × BH0.23 | Korea |
| DeLand and North 1968 [20] | 1020 x BSA – 220 | USA |
| Yuan et al, 2008 [21] | 949.7 × BSA – 48.3 × Age - 247.4 (Age = 1 if < 40 y; 2 if 41-60 y; 3 if >60 y) | China |
Table 1: The studied standard international formulae.
Statistical Methods
Data were analyzed with SPSS version 22 for Mac (IBM Corp., Armonk, NY, USA). Scatter plots with best-fit lines were used to illustrate the correlation between the calculated liver volume by each of the studied formulae and CT-LV. Accuracy of these formulae was compared by estimation of correlation coefficient (r) and coefficient of determination (R2). Calculated SLV by each studied formula was also compared with CT-LV using paired-samples t-test for each donor. For each formula, the error in liver volume estimation was calculated as: SLV – CT-LV, and error ratio (%) as: (SLV – CT-LV) / CT-LV × 100. All analyses were two-sided and the statistical significance was set at P-value less than 0.05.
Results
One hundred fifty-four patients were included in the analyses, as they had complete biometric and volumetric data. Most of the patients were males (n=99, 64.3%). The mean age was 28.3 ± 6.8 years; weight 72.3 ± 10.9 kg, height 168.6 ± 8.9 cm, BMI 25.8 ± 3.2 kg/m2 and BSA 1.8 ± 0.2 m2. The mean CT-LV was 1566.7 ± 272.3 ml (Table 2). Although all 13 formulae had significant linear relationships with CT-LV (P<0.0001), none of them was accurate in predicting CT-LV (R2=0.230-0.264) (Figure 1). Age did not show significant correlation with CT-LV (P=0.634). The weight, height, BMI and BSA had positive significant correlations with CT-LV. BSA has the highest R2 (0.264) (Table 3). The difference between SLV as estimated by all formulae and CT-LV was significant except for the Vauthey formula which had the least mean error ratio (-0.3 ± 17.6, P=0.090). Most of the formulae underestimated the total liver volume except that of Heinemann, Chouker, Yu, DeLand and Yuan. The highest and lowest significant liver volume underestimation was by the Fu-Gui (-400.2 ± 239 ml) and Poovathumkadavil (-124.5 ± 238.9 ml) formula respectively (P<0.0001). The significant total liver volume overestimation was highest by the Chouker formula (48.3 ± 242.4 ml, P<0.0001) and lowest by that of Yu (343.6 ± 258.9 ml, P=0.014) (Table 4).

Figure 1: Scatter plots of total liver volume (ml) as measured by CT (on the x-axis) against calculated liver volume using each of the studied formulae (y-axis) with the line of best fit. R2, coefficient of determination.
| Mean ± SD | Range | |
|---|---|---|
| Age (years) | 28.3 ± 6.8 | 18-47 |
| Weight (kg) | 72.3 ± 10.9 | 45-96 |
| Height (cm) | 168.6 ± 8.9 | 146-190 |
| BMI (kg/m2) | 25.5 ± 3.4 | 16.7-32.5 |
| BSA (m2) | 1.8 ± 0.2 | 1.4-2.2 |
| Total liver volume (ml) as assessed by: | ||
| CT | 1566.7 ± 272.3 | 899-2227 |
| Standard liver volume formulae | ||
| Urata | 1297.6 ± 118 | 1012.1-1556.3 |
| Hashimoto | 1360.7 ± 160.9 | 971.6-1713.5 |
| Vauthey | 1533.1 ± 212.1 | 1020.1-1998.1 |
| Fu-Gui | 1166.5 ± 125.1 | 851.9-1438.8 |
| Chandramohan | 1401.9 ± 146.3 | 1047.9-1722.8 |
| Chan | 1356.6 ± 171.4 | 917.9-1724.2 |
| Poovathumkadavil | 1442.1 ± 133.3 | 1107.1-1732.1 |
| Yoshizumi | 1326.0 ± 120.8 | 1033.7-1591 |
| Heinemann | 1624.6 ± 179.5 | 1190.3-2018.2 |
| Chouker | 1910.3 ± 236.4 | 1328.2-2436.6 |
| Yu | 1615 ± 187.9 | 1136.9-2014.2 |
| DeLand and North | 1653.3 ± 170.7 | 1240.4-2027.6 |
| Yuan | 1694.0 ± 159.0 | 1311.5-2044.4 |
Table 2: Characteristics of the studied donors.
| r | R2 | P | |
|---|---|---|---|
| Age (years) | 0.039 | 0.002 | 0.634 |
| Weight (kg) | 0.480 | 0.230 | <0.0001 |
| Height (cm) | 0.400 | 0.160 | <0.0001 |
| BMI (kg/m2) | 0.207 | 0.043 | 0.010 |
| BSA (m2) | 0.514 | 0.264 | <0.0001 |
| Standard liver volume formulae | |||
| Urata | 0.514 | 0.264 | <0.0001 |
| Hashimoto | 0.514 | 0.264 | <0.0001 |
| Vauthey | 0.514 | 0.264 | <0.0001 |
| Fu-Gui | 0.480 | 0.230 | <0.0001 |
| Chandramohan | 0.514 | 0.264 | <0.0001 |
| Chan | 0.503 | 0.253 | <0.0001 |
| Poovathumkadavil | 0.480 | 0.230 | <0.0001 |
| Yoshizumi | 0.514 | 0.264 | <0.0001 |
| Heinemann | 0.514 | 0.264 | <0.0001 |
| Chouker | 0.489 | 0.239 | <0.0001 |
| Yu | 0.495 | 0.245 | <0.0001 |
| DeLand and North | 0.514 | 0.264 | <0.0001 |
| Yuan | 0.512 | 0.262 | <0.0001 |
Table 3: Correlation to total liver volume (ml) as assessed by CT.
| Formulae | Error (Mean ± SD) |
Error ratio, % (Mean ± SD) |
P |
|---|---|---|---|
| Urata | -269.1 ± 234.7 | -15.3 ± 13.9 | <0.0001 |
| Hashimoto | -206.0 ± 234.6 | -11.3 ± 15 | <0.0001 |
| Vauthey | -33.6 ± 244.6 | -0.3 ± 17.6 | 0.090 |
| Fu-Gui | -400.2 ± 239 | -23.9±12.9 | <0.0001 |
| Chandramohan | -164.7 ± 233.8 | -8.5 ± 15.2 | <0.0001 |
| Chan | -210.1 ± 237.9 | -11.6 ± 15.3 | <0.0001 |
| Poovathumkadavil | -124.5 ± 238.9 | -5.8 ± 15.7 | <0.0001 |
| Yoshizumi | -240.7 ± 234.4 | -13.4 ± 14.2 | <0.0001 |
| Heinemann | 57.9 ± 237 | 5.9 ± 17.7 | 0.003 |
| Chouker | 343.6 ± 258.9 | 24.5 ± 22 | <0.0001 |
| Yu | 48.3 ± 242.4 | 5.3 ± 17.9 | 0.014 |
| DeLand and North | 86.6 ± 235.7 | 7.9 ± 17.9 | <0.0001 |
| Yuan | 127.3 ± 234.7 | 10.6 ± 18.2 | <0.0001 |
Table 4: Comparison between liver volume as estimated by each of the standard formulae and as measured at CT.
Discussion
Living donor liver transplantation has become an accepted alternative to deceased donor liver transplantation in many countries. Calculation of liver volume is crucial to ensure adequate liver mass for both recipient and donor. There are many internationally reported formulae to predict total liver volume based on biometric data. These formulae were derived from different populations [9-21].
In the current study, we studied the accuracy of thirteen reported international formulae in prediction of total liver volume among 154 living liver donors.
Eight of the used formulae are based on BSA, 4 on body weight, and the remaining one on both body weight and height. The mean CT-LV was 1566.7 ± 272.3 ml. BSA, BMI and their components were significantly and positively correlated with CT-LV.
Although all the studied formulae had significant linear relationships with CT-LV (P<0.0001), their accuracy in prediction of liver volume was limited (R2=0.230-0.264).
It is noteworthy that eight of the thirteen studied formulae had comparable estimates of liver volume with the highest recorded R2 (0.264). All of them are based on BSA, implying that it might be better than the other biometric parameters in prediction of liver volume.
The calculated SLV was underestimated by 8 formulae and overestimated by the remaining 5 formulae. It is to be noted that the formula of Vauthey had the best agreement to CT-LV with the least and non-significant error ratio (-0.3 %, P=0.090). However, it’s low R2 (0.264) still denotes its poor accuracy in predicting liver volume.
The limited accuracy of the studied formulae could be referred to inter-ethnic and inter-racial variability in body indices and heterogeneity of the populations from whom these formulae were derived.
The perplexing finding in the current study was the low coefficient of determination of the basically studied biometric parameters including weight, height, BMI and BSA (R2 was 0.23, 0.16, 0.04 and 0.26 respectively) reflecting their limited accuracy in spite of their linear relationships with the CT-LV. This embarrassing finding represented a limitation to derive a new formula with a better accuracy.
In our perspective, studying the correlation between donor biometrics and the actual liver volume in the back table would be of paramount value and could complement and worth this work. We are planning to be our project in the near future.
Finally we can conclude that, all the studied formulae seem to be highly specific to race and ethnicity and none of them can fit our population. Until further notice, CT volumetry remains the gold standard method for pre-transplantation liver volume assessment among our population.
References
- Shoup M, Gonen M, D’Angelica M, Jarnagin WR, DeMatteo RP, et al. (2003) Volumetric analysis predicts hepatic dysfunction in patients undergoing major liver resection. J Gastrointest Surg 7: 325-330.
- Emond JC, Leib M (1996) The living-related liver transplant evaluation: linking risk factors and outcome. Liver Transpl Surg 2: 57-63.
- Kawasaki S, Makuuchi M, Matsunami H, Hashikura Y, Ikegami T, et al. (1993) Preoperative measurement of segmental liver volume of donors for living related liver transplantation. Hepatology 18: 1115-1120.
- Kiuchi T, Kasahara M, Uryuhara K, Inomata Y, Uemoto S, et al. (1999) Impact of graft size mismatching on graft prognosis in liver transplantation from living donors. Transplantation 67: 321–327.
- De Villa VH, Lo CM, Chen CL (2003) Ethics and rationale of living-donor liver transplantation in Asia. Transplantation 75: S2-S5.
- Schiano TD, Bodian C, Schwartz ME, Glajchen N, Min AD (2000) Accuracy and significance of computed tomographic scan assessment of hepatic volume in patients undergoing liver transplantation. Transplantation 69: 545-550.
- Tanpowpong N, Yimpraphan S, Vajragupta L, Sirijindakul B, Nunthasoot B (2007) Accuracy of liver volume measurement using multidetector computed tomography. Asian Biomed 1: 415-20.
- Lui SA, Bonney GK, Kow WCA, et al. (2016) Standard Formulae in Predicting Liver Volumes: A South East Asian Series of Adult Living Donors. J Transplant Technol Res 6: 153.
- Urata K, Kawasaki S, Matsunami H, Hashikura Y, Ikegami T, et al. (1995) Calculation of child and adult standard liver volume for liver transplantation. Hepatology 21: 1317-1321.
- Hashimoto T, Sugawara Y, Tamura S, Hasegawa K, Kishi Y, et al. (2006) Estimation of standard liver volume in Japanese living liver donors. J Gastroentero Hepatol 21: 1710-1713.
- Vauthey JN, Abdalla EK, Doherty DA, Gertsch P, Fenstermacher MJ, et al. (2002) Body surface area and body weight predict total liver volume in Western adults. Liver Transpl 8: 233-240.
- Fu-Gui L, Lu-Nan Y, Bo L, Yong Z, Tian-Fu W, et al. (2009) Estimation of standard liver volume in Chinese adult living donors. Transplant Proc 41: 4052-4056.
- Chandramohan A, Eapen A, Govil S, Govil S, Jeyaseelan V, et al. (2007) Determining standard liver volumes: assessment of existing formulae in Indian population. Indian J Gastroenterol 26: 22-25.
- Chan SC, Liu CL, Lo CM, Lam BK, Lee EW, et al. (2006) Estimating liver weight of adults by body weight and gender. World J Gastroenterol 14: 2217-2222.
- Poovathumkadavil A, Leung KF, A Ghamdi HM, Othman Iel H, Meshikhes AW, et al. (2010) Standard formula for liver volume in Middle Eastern Arabic adults. Transplant Proc. 42: 3600-3605.
- Yoshizumi T, Gondolesi GE, Bodian CA, et al (2003) Donor and recipient transplant evaluation. Transplant Proc 35:1415.
- Heinemann A, Wischhusen F, Puschel K, Rogiers X (1999) Standard liver volume in the Caucasian population. Liver Transpl Surg 5: 366-368.
- Chouker A, Martignoni A, Dugas M, Eisenmenger W, Schauer R, et al (2004) Estimation of liver size for liver transplantation: the impact of age and gender. Liver Transpl 10: 678-685.
- Yu HC, You H, Lee H, Jin ZW, Moon JI, et al. (2004) Estimation of standard liver volume for liver transplantation in the Korean population. Liver Transpl 10: 779-783.
- DeLand FH, North WA (1968) Relationship between liver size and body size. Radiology 91:1195-1198.
- Yuan D, Lu T, Wei YG, Li B, Yan LN, et al (2008) Estimation of standard liver volume for liver transplantation in the Chinese population. Transplant Proc 40: 3536-3540.
- Mosteller RD (1987) Simplified calculation of body surface area. N Engl J Med 317: 1098.
- Geraghty EM, Boone JM, McGahan JP, Jain K (2004) Normal organ volume assessment from abdominal CT. Abd Imaging 29: 482-490.