Research Article, J Clin Exp Oncol Vol: 7 Issue: 2
Prognostic Model of Stage II/III Colon Cancer Constructed using Gene Expression Subtypes and KRAS Mutation Status
Kengo Gotoh1#, Eiji Shinto2#, Yuichiro Yoshida1*, Hideki Ueno2, Yoshiki Kajiwara2, Masato Yamadera2, Ken Nagata2, Hitoshi Tsuda3, Junji Yamamoto2 and Kazuo Hase2
1Central Research Laboratories, Sysmex Corporation, Kobe, Japan
2Surgery, National Defense Medical College, Saitama, Japan
3Pathology, National Defense Medical College, Saitama, Japan
#These authors contributed equally to this work
*Corresponding Author : Yuichiro Yoshida
Central Research Laboratories, Sysmex Corporation, 4-4-4 Takatsukadai, Nishi-ku, Kobe 651-2271, Japan
Tel: 81-78-991-2367
Fax: 81-78-992-7065
E-mail: Yoshida.Yuichiro@sysmex.co.jp
Received: March 06, 2018 Accepted: March 19, 2018 Published: March 26, 2018
Citation: Gotoh K, Shinto E, Yoshida Y, Ueno H, Kajiwara Y, et al. (2018) Prognostic Model of Stage II/III Colon Cancer Constructed using Gene Expression Subtypes and KRAS Mutation Status. J Clin Exp Oncol 7:2. doi: 10.4172/2324-9110.1000214
Abstract
Objectives: Cancer subtypes classified according to DNA microarray data predict prognosis with high accuracy. Here we constructed a new colon cancer (CC) subtype classification based on only of genes with known biological functions with the aim of establishing a new prognostic model for clinical use.
Methods: We performed an expression correlation analysis using data for 73 primary CC cases in the public dataset (learning set), focusing on genes located on the long arms of chromosomes 18 and 20 and stromal-related genes. We determined the representation of each gene in the modules with closely correlated expression levels in the same module. Mutations in KRAS, BRAF and TP53 were assessed using direct sequencing. Microsatellite instability (MSI) was analyzed using the Bethesda reference panel.
Results: We constructed a discriminant model with a view to classifying CC into three subtypes (“stromal”, “chromosomal instability [CIN]-like”, “MSI-like”) based on the expression levels of 55 genes of the Learning set. When we applied this predictor to microarray data from other patients with stage II/III colon cancer (n=258, test set), we discovered a significant difference in diseasefree survival between the stromal subtype and the other subtypes (p=1.25e-03). Accordingly, we created an integrated prognostic model for classifying the patients into high- and low-risk groups according to the expression levels of the 55 genes and KRAS mutations (p=1.56e-06). Analysis of independent specimens from patients with stage II/III colon cancer who underwent radical resection (n=59, validation set) confirmed the prognostic value of our model (p=4.75e-02).
Conclusion: The model produced a biologically discriminatory classifier that associated MSI status with the risk of recurrence that may be clinically applicable to the selection of patients with Stage II/ III CC for adjuvant therapy.
Keywords: Colon cancer; Prognosis; DNA microarray; Chromosomal instability; Microsatellite instability; Stroma
Introduction
Colorectal cancer (CRC) is the second and third most common cancer of women and men, with nearly 1.4 million new cases diagnosed worldwide in 2012 [1]. In the same year, there were 693,933 CRC-related deaths (8.5% of all cancer deaths) [1]. The postoperative recurrence rate of Stage II CRC is 10%-20% [2]. Postoperative adjuvant chemotherapy is recommended for patients with Stage II CRC with high-risk pathological factors [3]. Nevertheless, risk factors have not been determined with precision, and this recommendation is not justified through randomized control trials. Large-scale studies of patients with stage III CRC show that postoperative adjuvant chemotherapy effectively prolongs survival [4]. However, prognosis is better for patients with Stage IIIA compared with Stage IIB/IIC disease [2]. Therefore, precise prediction of prognosis is urgently required for patients with Stage III CRC as well. CRC subtypes classified according to DNA microarray data predict prognosis with high accuracy [5-9]. However, there is little consistency among reports regarding the genes selected for subtype classification. This diversity is explained by the employment of different methodologies. For example, some researchers determine the expression levels of genes with known functions (candidate-gene approach), while others select genes through unbiased microarray analysis (data-driven approach) [10]. The former strategy risks missing potentially important but poorly annotated genes, while the latter is associated with a serious risk of over fitting to the training set.
Most colon cancers (CCs) can be separated into at least two types, the Chromosomal instability (CIN) type or the Microsatellite instability (MSI) type [11]. The prognosis of MSI-type patients with CC is more favorable compared with that of those with CIN-type [12-15]. Chromosomal abnormalities in CC frequently occur on the long arms of chromosomes 18 and 20 [16,17]. Therefore, we hypothesized that we could distinguish CIN-type from MSI-type by analyzing the expression levels of genes located in these chromosomal regions. Otherwise, the rate of the MSI-type would be higher than the rates of the other subtypes. Moreover, convincing evidence reveals an association between the number of infiltrating stroma cells in tumor tissue and the prognosis of CC [5,18-20]. We therefore reasoned that the analysis of expression levels of stroma-related genes might aid in the definition of cancer subtypes.
Here we developed a new model of classifying CC subtypes using a methodology that combines candidate-gene and data-driven approaches to overcome the disadvantages of each. The method involves analysis of the unique combination of genes (referred to as modules) located on 18q and 20q as well as those expressed by the tumor stroma. First, we extracted these gene modules through correlating gene expression levels and selected representative genes from each module. Using a 55 gene-expression signature, we subtyped CCs into CIN-like, MSI-like, and stromal subtypes and assessed their prognostic significance. Moreover, we evaluated the relationship between common gene mutations in CC and clinical outcomes of patients with each CC subtype. This allowed us to establish a new prognostic model based on the assessment of a novel combination of the three gene modules and KRAS mutations. The clinical significance of the proposed prognostic model was tested using an independent public dataset, and its clinical utility was demonstrated using an inhouse dataset and clinical data.
Materials and Methods
Public microarray datasets
We used two public datasets to construct the model. Gene expression data from the H. Lee Moffitt Cancer Center [21], which is part of the GSE14333 (learning set; n=73, Dukes stages A, B and C CC, without adjuvant chemotherapy), were used for gene cluster discovery. Gene expression data from The French Cartes d’Identite´ des Tumeurs (CIT) program, which is a part of GSE39582 [9] (test set; n=258, Stages II and III CC, without adjuvant chemotherapy), were used to construct our prognostic model. The datasets are available from the National Center for Biotechnology Information Gene Expression Omnibus database (http://www.ncbi.nlm.nih.gov/geo).
Tissue samples
We collected tumor tissue specimens from patients with Stage II/III CC who underwent curative surgery at the National Defense Medical College (validation set; n=60, without adjuvant chemotherapy, 2002- 2003) according to a protocol approved by the Institutional Review Board. Archived primary tumor and adjacent non-neoplastic colon tissues were collected during surgery. Frozen sections with a tumor component >60% were prepared from each specimen and subjected to DNA microarray and gene mutation analyses. Patients and tumor characteristics of the three datasets are presented in Table 1.
| Characteristics | Learning set | Test set | Validation set | P value | |
|---|---|---|---|---|---|
| (n=73) | (n=258) | (n=59) | |||
| Age at diagnosis | Mean, years (SD) | 68.9(12.0) | 70.9(12.8) | 69.4(8.3) | 0.308 |
| <40, n (%) | 1(1.4%) | 6(2.3%) | 0(0%) | ||
| 40-49, n (%) | 2(2.7%) | 13(5.0%) | 1(1.7%) | ||
| 50-59, n (%) | 11(15.1%) | 22(8.5%) | 7(11.9%) | ||
| 60-69, n (%) | 22(30.1%) | 61(23.6%) | 20(33.9%) | ||
| >70, n (%) | 37(50.7%) | 156(60.5%) | 31(52.5%) | ||
| Sex, n (%) | Male | 37(50.7%) | 147(57.0%) | 32(54.2%) | 6.00e-03 |
| Female | 36(49.3%) | 111(43.0%) | 27(45.8%) | ||
| Stage, n (%) | I | 21(28.8%) | 0 (0%) | 0 (0%) | 2.42E-22 |
| II | 37(50.7%) | 203(78.7%) | 43(72.9%) | ||
| III | 15(20.5%) | 55(21.3%) | 16(27.1%) | ||
| Location, n (%) | Right | 35(47.9%) | 118(45.7%) | 25(42.4%) | 0.814 |
| Left | 38(52.1%) | 140(54.3%) | 34(57.6%) | ||
| Follow up, n (%) | Mean | 4.02(0.08-11.9) | 4.41(0-16.8) | 5.92(0.05-11.5) | 2.00e-03 |
| Relapse, n (%) | + | 11(15.1%) | 62(24.0%) | 6(10.2%) | 0.027 |
| - | 62(84.9%) | 196(76.0%) | 53(89.8%) | ||
| KRAS mutant, n (%) | + | - | 86(34.5%) | 23(39.0%) | 0.624 |
| - | - | 163(65.5%) | 36(61.0%) | ||
| N/A | 73 | 9 | 0 | ||
| BRAF mutant, n (%) | + | - | 33(13.8%) | 2(3.4%) | 0.046 |
| - | - | 206(86.2%) | 57(96.6%) | ||
| N/A | 73 | 19 | 0 | ||
| TP53 mutant, n (%) | + | - | 79(49.7%) | 35(59.3%) | 0.266 |
| - | - | 80(50.3%) | 24(40.7%) | ||
| N/A | 73 | 99 | 0 | ||
| MSI, n (%) | + | - | 47(20.7%) | 5(8.6%) | 0.053 |
| - | - | 180(79.3%) | 53(91.4%) | ||
| N/A | 73 | 31 | 1 | ||
| Recurrence, n (%) | + | 11(15.1%) | 62(24.0%) | 6(10.2%) | 0.272 |
| - | 62(84.9%) | 196(76.0%) | 53(89.8%) | ||
| 5-year survival rate, % | 83.9% | 72.5% | 89.5% | - | |
Table 1: Patient characteristics.
Construction of a molecular subtype predictor using a learning set
To discover functional gene modules, we performed co-expression analysis using R software. We filtered out low intensity probes (average signal intensity<350) and low deviation probes (CV<0.18) from all probes in GSE14333 microarray data. Then we calculated Pearson’s correlation coefficient of gene expression between the remaining 10,449 genes, and we extracted gene modules from gene clusters. After we identified three gene modules representing the long arms of chromosomes 18 and 20 and stromal-related genes, representative genes were selected according to the significant associations of their expression levels within each module as well as to information about their biological functions. We were limited to 73 samples because of our relatively narrow selection criteria.
Accordingly, we next constructed a subtype predictor with reference to Hu et al. [22]. First, we performed hierarchical clustering of the learning dataset using the expression profiles. We next averaged the gene expression profiles (centroid) for samples assigned to each subtype using the hierarchical clustering dendrogram as a guide. New samples were assigned to the nearest subtype/centroid as determined using the Spearman correlation. This predictor was then used to classify tumors into subtypes within the test and validation datasets.
Gene expression analysis
Total RNA and DNA were extracted using an RNeasy Mini Kit and a QIAamp DNA Mini Kit (Qiagen Valencia, CA). The RNA quality of samples was then assessed using a 2100 Bio analyzer (Agilent Technologies, Palo Alto, CA). The preparations were of optimal quality for oligonucleotide microarray analysis, as shown by the integrity of the 18S and 28S ribosomal RNA bands. Gene expression data were generated using an Affymetrix Human Genome U133 Plus 2.0 Gene Chip Array (Affymetrix, Santa Clara, CA). Each dataset was normalized using the Microarray Suite (MAS) 5.0 in the Expression console (Affymetrix). Data are available from the NCBI Gene Expression Omnibus (http://www.ncbi.nlm.nih.gov/geo/; accession number GSE 92921).
Gene mutation and MSI analysis
The mutations in exon 2 and 3 of KRAS [23], exon 15 of BRAF [24] and exons 5 to 9 of TP53 [25] were assessed using direct sequencing as previously described. MSI was analyzed using a panel of five microsatellite loci of the Bethesda reference panel [26]. MSIhigh tumors were classified as deficient in DNA mismatch repair (dMMR), and MSI-low and microsatellite-stable (MSS) tumors as proficient MMR (pMMR).
Survival analysis
We used Kaplan-Meier analysis and the log-rank test to estimate prognosis. Recurrence-free survival (RFS) was defined as the time from surgery until primary tumor recurrence. P<0.05 indicates statistical significance, and all statistical tests were two-tailed. All statistical analyses were conducted using the statistical software EZR [27].
Results
Identification of three CC subtypes and development of a subtype predictor
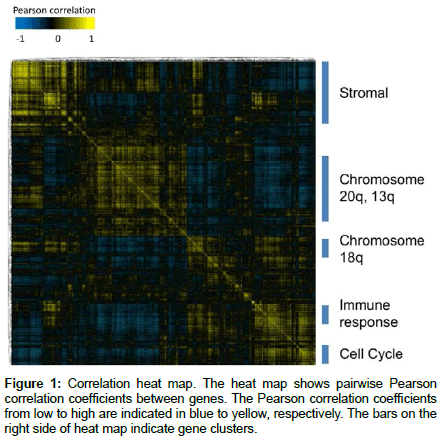
We performed an expression correlation analysis using data for 73 primary CC cases in GSE14333 (learning set, Dukes Stage A/B/C CC). We identified several gene clusters, which included gene groups located on chromosomes 18q, 20q, and 13q as well as the gene groups associated with the immune response, cell proliferation, and stromal related genes (Figure 1).
Among these gene groups, we focused on genes located on the long arms of chromosomes 18 and 20 and stromal-related genes. We determined the representation of each gene in the modules with closely correlated expression levels in the same module. Finally, we extracted 55 genes according to their representation among the three gene groups and information about their biological functions (Table 2).
| Affymetrix Probe Set ID | Representative Public ID | UniGene ID | Gene Symbol | Gene Title | Chromosomal Location |
|---|---|---|---|---|---|
| 200027_at | NM_004539 | Hs.465224 | NARS | asparaginyl-tRNA synthetase | chr18q21.31 |
| 201588_at | NM_004786 | Hs.114412 | TXNL1 | thioredoxin-like 1 | chr18q21.31 |
| 202484_s_at | AF072242 | Hs.25674 | MBD2 | methyl-CpG binding domain protein 2 | chr18q21 |
| 202836_s_at | NM_006701 | Hs.465498 | TXNL4A | thioredoxin-like 4A | chr18q23 |
| 209366_x_at | M22865 | Hs.465413 | CYB5A | cytochrome b5 type A (microsomal) | chr18q23 |
| 217752_s_at | NM_018235 | Hs.149185 | CNDP2 | CNDP dipeptidase 2 (metallopeptidase M20 family) | chr18q22.3 |
| 218171_at | AF195514 | Hs.126550 | VPS4B | vacuolar protein sorting 4 homolog B (S. cerevisiae) | chr18q21.33 |
| 218208_at | NM_025078 | Hs.288284 | PQLC1 | PQ loop repeat containing 1 | chr18q23 |
| 219419_at | NM_024805 | Hs.593610 | RBFA | ribosome binding factor A (putative) | chr18q23 |
| 220180_at | NM_025214 | Hs.120790 | CCDC68 | coiled-coil domain containing 68 | chr18q21 |
| 223180_s_at | BC000892 | Hs.532835 | C18orf55 | chromosome 18 open reading frame 55 | chr18q22.3 |
| 223299_at | AF212233 | Hs.45107 | SEC11C | SEC11 homolog C (S. cerevisiae) | chr18q21.32 |
| 225301_s_at | AI991160 | Hs.720076 | MYO5B | myosin VB | chr18q21 |
| 225407_at | N37023 | Hs.551713 | MBP | myelin basic protein | chr18q23 |
| 226924_at | AI016355 | Hs.61508 | LOC400657 | hypothetical LOC400657 | chr18q22.3 |
| 227072_at | BG167480 | Hs.654809 | RTTN | Rotatin | chr18q22.2 |
| 227542_at | AU157543 | Hs.44439 | SOCS6 | suppressor of cytokine signaling 6 | chr18q22.2 |
| 227768_at | AB051490 | Hs.536490 | ZNF407 | zinc finger protein 407 | chr18q23 |
| 232594_at | AK001829 | Hs.191582 | HSBP1L1 | heat shock factor binding protein 1-like 1 | chr18q23 |
| 238846_at | AW026379 | Hs.204044 | TNFRSF11A | tumor necrosis factor receptor superfamily, member 11a, NFKB activator | chr18q22.1 |
| 202716_at | NM_002827 | Hs.417549 | PTPN1 | protein tyrosine phosphatase, non-receptor type 1 | chr20q13.1-q13.2 |
| 202925_s_at | NM_002657 | Hs.154104 | PLAGL2 | pleomorphic adenoma gene-like 2 | chr20q11.21 |
| 203943_at | NM_004798 | Hs.369670 | KIF3B | kinesin family member 3B | chr20q11.21 |
| 204554_at | AL109928 | Hs.42215 | PPP1R3D | protein phosphatase 1, regulatory (inhibitor) subunit 3D | chr20q13.3 |
| 204849_at | NM_006602 | Hs.126248 | TCFL5 | transcription factor-like 5 (basic helix-loop-helix) | chr20q13.3-qter |
| 206918_s_at | NM_003915 | Hs.246413 | CPNE1 | copine I | chr20q11.22 |
| 207941_s_at | NM_004902 | Hs.282901 | RBM39 | RNA binding motif protein 39 | chr20q11.22 |
| 208979_at | AF128458 | Hs.368971 | NCOA6 | nuclear receptor coactivator 6 | chr20q11 |
| 209422_at | AL109965 | Hs.517044 | PHF20 | PHD finger protein 20 | chr20q11.22-q11.23 |
| 212237_at | N64780 | Hs.374043 | ASXL1 | additional sex combs like 1 (Drosophila) | chr20q11.1 |
| 212349_at | AL045513 | Hs.472409 | POFUT1 | protein O-fucosyltransferase 1 | chr20q11 |
| 213090_s_at | AI744029 | Hs.18857 | TAF4 | TAF4 RNA polymerase II, TATA box binding protein (TBP)-associated factor, 135kDa | chr20q13.33 |
| 218325_s_at | NM_022105 | Hs.517172 | DIDO1 | death inducer-obliterator 1 | chr20q13.33 |
| 224611_s_at | AL118506 | Hs.164419 | DNAJC5 | DnaJ (Hsp40) homolog, subfamily C, member 5 | chr20q13.33 |
| 224815_at | AA148301 | Hs.408427 | COMMD7 | COMM domain containing 7 | chr20q11.21 |
| 225224_at | AL034550 | Hs.516978 | C20orf112 | chromosome 20 open reading frame 112 | chr20q11.1-q11.23 |
| 225313_at | AI627538 | Hs.504920 | C20orf177 | chromosome 20 open reading frame 177 | chr20q13.2-q13.33 |
| 225498_at | AV713673 | Hs.472471 | CHMP4B | chromatin modifying protein 4B | chr20q11.22 |
| 225903_at | AL118520 | Hs.253319 | PIGU | phosphatidylinositol glycan anchor biosynthesis, class U | chr20q11.22 |
| 1555630_a_at | AF327350 | Hs.301853 | RAB34 | RAB34, member RAS oncogene family | chr17q11.2 |
| 201069_at | NM_004530 | Hs.513617 | MMP2 | matrix metallopeptidase 2 (gelatinase A, 72kDa gelatinase, 72kDa type IV collagenase) | chr16q13-q21 |
| 201426_s_at | AI922599 | Hs.455493 | VIM | Vimentin | chr10p13 |
| 201893_x_at | AF138300 | Hs.156316 | DCN | Decorin | chr12q21.33 |
| 202351_at | AI093579 | Hs.436873 | ITGAV | integrin, alpha V (vitronectin receptor, alpha polypeptide, antigen CD51) | chr2q31-q32 |
| 202450_s_at | NM_000396 | Hs.632466 | CTSK | cathepsin K | chr1q21 |
| 202686_s_at | NM_021913 | Hs.590970 | AXL | AXL receptor tyrosine kinase | chr19q13.1 |
| 203729_at | NM_001425 | Hs.9999 | EMP3 | epithelial membrane protein 3 | chr19q13.3 |
| 208747_s_at | M18767 | Hs.458355 | C1S | complement component 1, s subcomponent | chr12p13 |
| 212067_s_at | AL573058 | Hs.524224 | C1R | complement component 1, r subcomponent | chr12p13 |
| 213001_at | AF007150 | Hs.653262 | ANGPTL2 | angiopoietin-like 2 | chr9q34 |
| 218469_at | NM_013372 | Hs.40098 | GREM1 | gremlin 1 | chr15q13.3 |
| 226001_at | AK002174 | Hs.272251 | KLHL5 | kelch-like 5 (Drosophila) | chr4p14 |
| 226051_at | BF973568 | Hs.55940 | SELM | selenoprotein M | chr22q12.2 |
| 229067_at | BF977829 | Hs.523529 | SRGAP2P1 | SLIT-ROBO Rho GTPases activating protein 2 pseudo gene 1 | chr1p11.2 |
| 57715_at | W72694 | Hs.241545 | CALHM2 | calcium homeostasis modulator 2 | chr10pter-q26.12 |
Table 2: Reference genes.
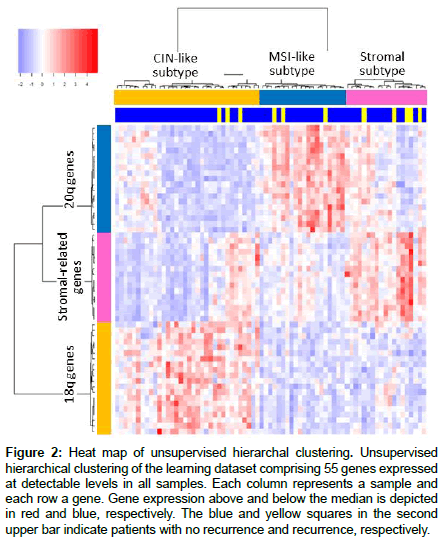
Unsupervised clustering using the 55 genes revealed that patients with CC (learning set) could be classified into the subtypes as follows: Subtype 1 (n=32; 43.2%), characterized by high expression of stromal genes; Subtype 2 (N=24; 33.8%), associated with the 18q-lower/20qhigher expression than average; and Subtype 3 (n=17; 23.0%), associated with the 18q-higher/20q-lower expression than average (Figure 2).
Figure 2: Heat map of unsupervised hierarchal clustering. Unsupervised hierarchical clustering of the learning dataset comprising 55 genes expressed at detectable levels in all samples. Each column represents a sample and each row a gene. Gene expression above and below the median is depicted in red and blue, respectively. The blue and yellow squares in the second upper bar indicate patients with no recurrence and recurrence, respectively.
Subtype 1 was named the ‘stromal subtype’ because of the high expression of stroma-related genes.
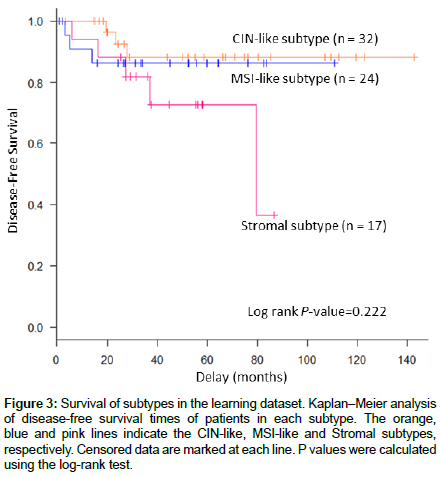
Subtype 2 was named the ‘CIN-like subtype’, because CIN cancers frequently express the 18q-low/20q-high pattern [16,17]. Subtype 3 was named the ‘MSI-like subtype’, because we suspect that MSI cases are infrequently categorized as Subtype 2. Thus, Subtype 3 is enriched with MSI cases. The 5-year disease free survival (DFS) rates in the CIN-like, MSI-like, and stromal subtypes were 88.2%, 86.4%, and 72.8%, respectively. We found no statistically significant difference, though patients with the stromal subtype tended to have a higher risk of recurrence compared with the other subtypes (Figure 3 and Table 3). For general use, we developed a subtype classifier ‘55-gene centroid predictor’ to divide CCs into the three subtypes, according to a previous report [22].
| Characteristic | CIN-like subtype | MSI-like subtype | Stromal subtype | P value | |
|---|---|---|---|---|---|
| (n=32, 43.8%) | (n=24, 32.9%) | (n=17, 23.3%) | |||
| Age at diagnosis | Mean, Year (SD) | 72.9(10.5) | 67.2(12.7) | 63.8(11.9%) | 0.2856 |
| <40, n (%) | 0(0%) | 0(0%) | 1(5.9%) | ||
| 40-49, n (%) | 0(0%) | 2(8.3%) | 0(0%) | ||
| 50-59, n (%) | 4(12.5%) | 4(16.7%) | 3(17.6%) | ||
| 60-69, n (%) | 8(25.0%) | 8(33.3%) | 6(35.3%) | ||
| >70, n (%) | 20(62.5%) | 10(41.7%) | 7(41.2%) | ||
| Sex, n (%) | Male | 18(56.3%) | 11(45.8%) | 8(47.1%) | 0.724 |
| Female | 14(43.8%) | 13(54.2%) | 9(52.9%) | ||
| Stage at diagnosis, n (%) | Dukes A | 13(40.6%) | 5(20.8%) | 3(17.6%) | 0.315 |
| Dukes B | 13(40.6%) | 15(62.5%) | 9(52.9%) | ||
| Dukes C | 6(18.8%) | 4(16.7%) | 5(29.4%) | ||
| Location, n (%) | Right | 12(37.5%) | 16(66.7%) | 7(41.2%) | 9.19e-02 |
| Left | 20(62.5%) | 8(33.3%) | 10(58.8%) | ||
| Recurrence, n (%) | + | 3(9.4%) | 3(12.5%) | 5(29.4%) | 0.226 |
| - | 29(90.6%) | 21(87.5%) | 12(70.6%) | ||
| 5-year DFS,% | 88.2% | 86.4% | 72.8% | 0.222 | |
Table 3: Correlation of subtypes with clinical parameters of the learning set.
Figure 3: Survival of subtypes in the learning dataset. Kaplan–Meier analysis of disease-free survival times of patients in each subtype. The orange, blue and pink lines indicate the CIN-like, MSI-like and Stromal subtypes, respectively. Censored data are marked at each line. P values were calculated using the log-rank test.
Prognostic significance of the subtype model and its biological importance for the test set
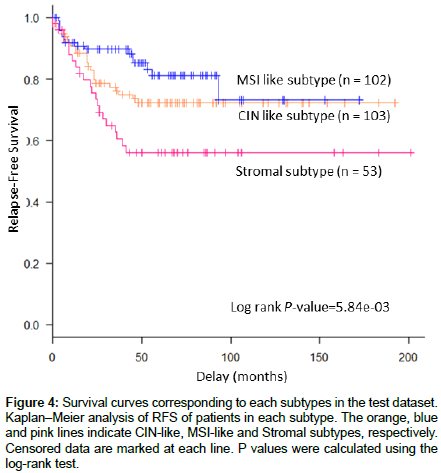
We applied the subtype predictor to an independent public data set of 258 stage II/III CC samples (GSE39582). The CIN-like, MSIlike, and stromal subtypes accounted for 39.9% (103 specimens), 39.5% (102 specimens), and 20.5% (53 specimens), respectively. The 5-year RFS of patients with the CIN-like, MSI-like, and stromal subtype cancers were 72.2%, 81.2%, and 56.0%, respectively (Figure 4). The log-rank test revealed that there was a significantly higher incidence of recurrent events in the stromal subtype (stromal subtype vs. other subtypes, p=3.62e−03).
Figure 4: Survival curves corresponding to each subtypes in the test dataset. Kaplan–Meier analysis of RFS of patients in each subtype. The orange, blue and pink lines indicate CIN-like, MSI-like and Stromal subtypes, respectively. Censored data are marked at each line. P values were calculated using the log-rank test.
The relationships between each subtype and factor in the test dataset are summarized in Table 4. The results supported our assumption that CIN was significantly enriched in CIN-like subtype cases (p=3.86e-15), MSI was significantly enriched in MSI-like subtype cases (p=2.20e-16), and CpG island methylated phenotype (CIMP) was significantly enriched in MSI-like subtype cases (p=2.38e-13). There was a high incidence of BRAF mutations (p=1.22e-10) in MSI-like subtype cases and a low incidence of TP53 mutations (p=1.09e-06).
| Characteristic | CIN-like subtype | MSI-like subtype | Stromal subtype | P value | |
|---|---|---|---|---|---|
| (n=103, 39.9%) | (n=102, 39.5%) | (n=53, 20.5%) | |||
| Age at diagnosis | Mean, Year (SD) | 70.5(11.9) | 71.3(14.0) | 71(12.3) | 0.198 |
| <40, n (%) | 1(1.0%) | 4(3.9%) | 1(1.9%) | ||
| 40-49, n (%) | 4(3.9%) | 7(6.9%) | 2(3.8%) | ||
| 50-59, n (%) | 13(12.6%) | 3(2.9%) | 6(11.3%) | ||
| 60-69, n (%) | 25(24.3%) | 21(20.6%) | 15(28.3%) | ||
| >70, n (%) | 60(58.3%) | 67(65.7%) | 29(54.7%) | ||
| Sex, n (%) | Male | 63(61.2%) | 56(54.9%) | 28(52.8%) | 0.525 |
| Female | 40(38.8%) | 46(45.1%) | 25(47.2%) | ||
| Stage at diagnosis, n (%) | II | 87(84.5%) | 79(77.5%) | 37(69.8%) | 0.096 |
| III | 48(46.6%) | 23(22.5%) | 16(30.2%) | ||
| Location, n (%) | distal | 80(77.7%) | 30(29.4%) | 30(56.6%) | 3.35e-11 |
| proximal | 23(22.3%) | 72(70.6%) | 23(43.4%) | ||
| MSI status, n (%) | MSI | 0(0%) | 47(51.6%) | 0(0%) | <2.2e-16 |
| MSS | 93(100%) | 44(48.4%) | 43(100%) | ||
| N/A | 10 | 11 | 10 | ||
| CIN status, n (%) | + | 82(95.3%) | 39(41.9%) | 37(84.1%) | 3.86e-15 |
| - | 4(4.7%) | 54(58.1%) | 7(15.9%) | ||
| N/A | 17 | 9 | 9 | ||
| CIMP status, n (%) | + | 2(2.2%) | 45(47.4%) | 5(11.4%) | 2.38e-13 |
| - | 89(97.8%) | 50(52.6%) | 39(88.6%) | ||
| N/A | 12 | 7 | 9 | ||
| KRAS mutation status, n (%) | + | 24(24.7%) | 36(36.0%) | 26(50%) | 7.79e-03 |
| - | 73(75.3%) | 64(64.0%) | 26(50%) | ||
| N/A | 6 | 2 | 1 | ||
| BRAF mutation status, n (%) | + | 0(0%) | 31(32.0%) | 2(4.2%) | 1.22e-10 |
| - | 94(100%) | 66(68.0%) | 46(95.8%) | ||
| N/A | 9 | 5 | 5 | ||
| TP53 mutation status, n (%) | + | 47(67.1%) | 13(22.4%) | 19(61.3%) | 1.09e-06 |
| - | 23(32.9%) | 45(77.6%) | 12(38.7%) | ||
| N/A | 33 | 44 | 22 | ||
| Recurrence, n (%) | + | 25(24.3%) | 16(15.7%) | 21(39.6%) | 4.19e-03 |
| - | 78(75.7%) | 86(84.3%) | 32(60.4%) | ||
| 5-year RFS, % | 72.2% | 81.2% | 56.0% | 5.84e-03 | |
Table 4: Correlation of subtypes with clinical parameters in the test set.
Modification of the subtype model incorporating gene mutation status
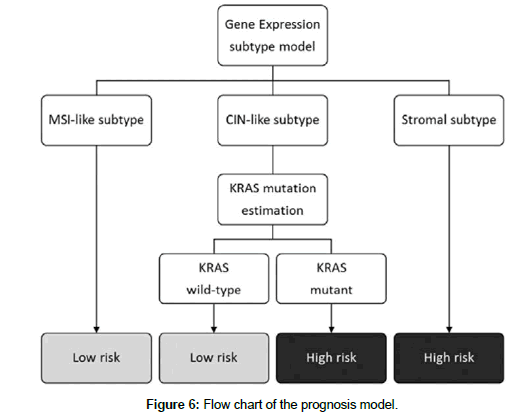
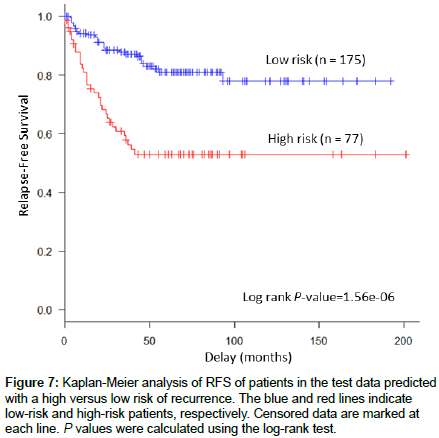
When we evaluated the prognostic values of common gene mutations in each subtype, we found that KRAS mutations represented a significant risk factor for recurrence (p=2.74e-04) in the CIN-like subtype cases (Figure 5), while BRAF and TP53 mutations did not have significant prognostic value. Accordingly, we created a prognostic model that classified patients with CC into the good or poor prognosis group according to the molecular subtype and KRAS mutation status (Figure 6). Our prognostic model classified patients with stage II/III CC into two groups with significantly different risks of recurrence (p=1.56e-06) in the test set GSE39582 (Figure 7).
The results of these analyses are summarized in Figure 6. The relative risks of the subtypes associated with 5-year RFS are as follows: MSI-like, 81.2%; CIN-like, wild-type KRAS, 78.9%; CIN-like, mutant KRAS, 46.6%; and stromal, 56.0%.
Validation of the prognostic model with in-house data set
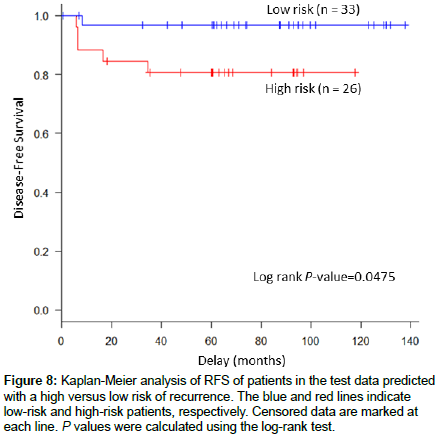
We next validated the prognostic model with the newly acquired microarray datasets of tissue specimens from 59 patients treated at the National Defense Medical College with resected stage II/III CC who had not received postoperative adjuvant chemotherapy (inhouse validation dataset). Patients were classified into the CIN-like (32.2%, 19 specimens), MSI-like (32.2%, 19 specimens), and stromal (35.6%, 21 specimens) subtypes using the 55-gene centroid predictor. Finally, we applied our prognostic model to the independent dataset and demonstrated that it identified high- and low-risk patient groups (p=0.0475) (Figure 8 and Table 5).
| Variable | CIN-like subtype | MSI-like subtype | Stromal subtype | P value | |
|---|---|---|---|---|---|
| (n=19, 32.2%) | (n=19, 32.2%) | (n=21, 35.6%) | |||
| Age at diagnosis | Mean, Year (SD) | 68.7 (8.3) | 71.3 (9.0) | 68.3 (7.8) | 0.220 |
| <40, n (%) | 0 (0%) | 0 (0%) | 0 (0%) | ||
| 40-49, n (%) | 0 (0%) | 1 (5.3%) | 0 (0%) | ||
| 50-59, n (%) | 3 (15.8%) | 1 (5.3%) | 3 (14.3%) | ||
| 60-69, n (%) | 8 (42.1%) | 3 (15.8%) | 9 (42.9%) | ||
| >70, n (%) | 8 (42.1%) | 14 (73.7%) | 9 (42.9%) | ||
| Sex, n (%) | Male | 9 (47.4%) | 12 (63.2%) | 11 (52.4%) | 0.648 |
| Female | 10 (52.6%) | 7 (36.8%) | 10 (47.6%) | ||
| Stage at diagnosis, n (%) | II | 12 (63.2%) | 16 (84.2%) | 15 (71.4%) | 0.356 |
| III | 7 (36.8%) | 3 (15.8%) | 6 (28.6%) | ||
| Location, n (%) | distal | 7 (36.8%) | 10 (52.6%) | 8 (38.1%) | 0.545 |
| proximal | 12 (63.2%) | 9 (47.4%) | 13 (61.9%) | ||
| MSI status, n (%) | dMMR | 0 (0%) | 5 (27.8%) | 0 (0%) | 1.87e-03 |
| pMMR | 19 (100%) | 13 (72.2%) | 21 (100%) | ||
| N/A | 0 | 1 | 0 | ||
| KRAS mutation status, n (%) | + | 5 (26.3%) | 12 (63.2%) | 6 (28.6%) | 0.0472 |
| - | 14 (73.7%) | 7 (36.8%) | 15 (71.4%) | ||
| N/A | 0 | 0 | 0 | ||
| BRAF mutation status, n (%) | + | 0 (0%) | 2 (10.5%) | 0 (0%) | 0.200 |
| - | 19 (100%) | 17 (89.5%) | 21 (100%) | ||
| N/A | 0 | 0 | 0 | ||
| TP53 mutation status, n (%) | + | 14 (73.7%) | 7 (36.8%) | 14 (66.7%) | 0.0561 |
| - | 5 (26.3%) | 12 (63.2%) | 7 (33.3) | ||
| N/A | 0 | 0 | 0 | ||
| Recurrence, n (%) | + | 1 (5.3%) | 1 (5.3%) | 4 (19.0%) | 0.346 |
| - | 18 (94.7%) | 18 (94.7%) | 17 (81.0%) | ||
| 5-year DFS,% | 94.4% | 94.4% | 80.7% | 0.267 | |
Table 5: Correlation of subtypes with clinical parameters of the validation set.
Discussion
To develop a commercially available prognostic test for patients with CC that offers unique advantages over existing assays [28-34], we focused on selecting genes with known biological functions that reside on specific chromosomal loci as well as those that are expressed by the tumor stroma known to influence tumor phenotypes (i.e. “rational” vs. “shotgun” approach”). Here we describe such a test that importantly does not infringe on patents for others designed to predict prognosis of patients with CC (Our model described in this paper is patent pending). In particular, selection of differentially expressed genes using bioinformatics without considering function may diminish the test’s specificity and sensitivity to levels that might disqualify it for routine clinical use. Specifically, we estimated the performance of the prognostic model using 4,818 genes in three gene clusters (Stromal/Chromosome 20q, 13q/Chromosome 18q (Figure 1 and Table 6). The prognostic performance of this model was diminished in the test and validation sets. This result indicates that our gene selection methods effectively help to construct a highly reproducible discriminative model comprising multiple genes.
| Learning set | Test set | Validation set | |||||
|---|---|---|---|---|---|---|---|
| n | 5 year DFS | n | 5 year RFS | n | 5 year DFS | ||
| 55 genes | CIN | 32 | 88.2% | 103 | 72.2% | 19 | 94.4% |
| MSI | 24 | 86.4% | 102 | 81.2% | 19 | 94.4% | |
| Stromal | 17 | 72.8% | 53 | 56.0% | 21 | 80.7% | |
| P value | 0.222 | 5.84e-03 | 0.267 | ||||
| High risk | - | - | 77 | 52.9% | 26 | 80.6% | |
| Low risk | - | - | 181 | 81.0% | 33 | 96.8% | |
| P value | ��? | 1.56e-06 | 4.75e-02 | ||||
| 4,818 genes | CIN | 35 | 82.9% | 110 | 68.7% | 20 | 90.0% |
| MSI | 27 | 96.0% | 100 | 80.8% | 33 | 87.3% | |
| Stromal | 11 | 56.0% | 48 | 63.3% | 6 | 100.0% | |
| P value | 3.23e-03 | 2.00e-02 | 0.666 | ||||
| High risk | - | - | 80 | 57.6% | 9 | 100.0% | |
| Low risk | - | - | 171 | 78.7% | 50 | 87.5% | |
| P value | ��? | 7.64e-05 | 0.276 | ||||
Table 6: Comparison of 5-year survival rates of subtypes using 55 and 4,818 genes.
For this purpose, here we performed unsupervised clustering of gene expression in CC samples, focusing on genes located on the long arms of chromosomes 18 and 20 as well as stroma-related genes. We selected the gene modules “Chromosomal 18q Loss”, “Chromosomal 20q Amplification,” and “Stromal” to construct a classifier comprising 55 genes. This strategy enabled us to categorize CCs into the subtypes “Stromal,” “CIN-like,” and “MSI-like.” Next, we discovered that KRAS mutations were associated with shorter RFS of patients with the CIN-subtype but not those with the MSI- and Stromal-types. We incorporated these findings to construct a new prognostic model that incorporated the combination of subtype classifications and KRAS mutations.
Adjuvant chemotherapy is frequently considered as the treatment option of choice for high-risk patients with stage II CC. The National Comprehensive Cancer Network [3] and the European Society for Medical Oncology [35] recommend considering adjuvant treatment for patients with stage II CC if specific features are present as follows: clinical obstruction, perforation, T4 tumor, suboptimal lymph node sampling (<12 lymph nodes), presence of lymphovascular or perineural invasion, or poor differentiation. Kumar et al. [36] determined the effectiveness of adjuvant chemotherapy for high-risk patients with these features. Further, ≥ 76% of Stage II patients are categorized as high-risk [36], although the recurrence rate of Stage II patients ranges from 10% to 20% [2].
Patients with stage III CC are generally advised to undergo adjuvant chemotherapy; however, we doubt that patients with Stage IIIA CC require this type of therapy, because their prognosis is better compared with those with Stage IIB/IIC. Further investigations are therefore necessary to develop a robust standard to select candidate adjuvant chemotherapeutic strategies according to cancer stage and subtyping performed using gene-expression profiles.
The RFS of low-risk patients with Stage II/III CC judged using our prognostic model was 81.0% in the test set and 96.8% in the validation set, indicating that adjuvant therapy is not required for such patients. Thus, we used our model to assign 77% and 50% of the test and validation sets, respectively, to the low-risk category. These frequencies are significantly higher compared with the proportion of patients classified as low-risk [36]. Thus, the developed model was designed to identify CC patients with good and poor prognosis, if used clinically, would spare numerous patients from unnecessary and potentially harmful adjuvant therapy and reduce medical costs.
MSI status is a key feature of CC, and evidence [37,38] indicates that the benefits of adjuvant chemotherapy differ between patients with MSI and MSS. In the present study, all MSI cancers were included in MSI-like subtype, not only in the test set, but in the validation set as well. Consequently, all CIN-like and stromal subtypes exhibited the MSS phenotype, indicating that additional screening for MSI screening of patients with CIN-like and stromal subtype cancers is not required. The 55-gene centroid predictor was significant for predicting prognosis and was biologically significant by its ability to identify MSI subtypes.
Gene expression profiling is increasingly utilized for cancer diagnosis, prognosis, and treatment decisions. The Mamma Print assay [39-41], introduced by Agendia in 2007, and was the first FDAapproved molecular test that profiles gene expression levels to predict the risk of early-stage breast cancer to guide treatment decisions. The OncotypeDX Colon Cancer Assay manufactured by Genomic Health improves prediction of recurrence risk for patients with stage II CC [28-30,32,33,36]. The ColoPrint, produced by Agendia, significantly improves prognostic accuracy in predicting the survival of patients with stages II and III colorectal cancer [31,34]. Subsequently, several clinical trials [28-30] validated the performance of these two classifiers. However, the OncotypeDX Colon Cancer Assay categorized 26%– 31% of these patients as “intermediate risk” [33]. This high incidence of “intermediate risk” patients complicates clinical decision-making. Moreover, these assays required an MSI test to improve their quality, because a good prognosis was predicted for patients with MSI-type cancer regardless of the results of the OncotypeDX Colon Cancer Assay. Thus, our prognostic model has a distinct advantage, because it divides patients with CC into two risk groups without performing the MSI test.
Although these findings seem promising, the present study has some limitations. First, our models were structured using data acquired from frozen specimens. For practical use, the quality of our model must be confirmed using formalin-fixed paraffin-embedded specimens. Second, we were unable to obtain statistically significant data for Stage II or Stage III patients because few patient samples were available. We believe that a larger study will aid in determining the potential of the subtype classifier and the prognostic model described here.
Conclusion
We developed a new prognostic model for patients with CC based on analysis of the expression of 55 genes and KRAS mutations status. This novel model was developed by analyzing a combination of 18q, 20q, and stromal gene modules. The model produced a biologically discriminatory classifier that associated MSI status with the risk of recurrence. Finally, we demonstrated the prognostic significance of the proposed model that may be clinically applicable for the selection of patients with Stage II/III CC for adjuvant therapy.
Acknowledgments
We thank Dr. Igor Kurochkin for his helpful comments on earlier drafts of this manuscript and Aya Matsuoka and Mayuko Sueoka for their technical assistance. We thank Steven R. Tronick, PhD of DMC Corp. (www.dmed.co.jp <http://www.dmed.co.jp/>) for editing drafts of this manuscript.
Grant Numbers and Source of Support
K.G. and Y.Y. are employees of Sysmex Corporation. The other authors have no conflicts of interest to declare. The microarray measurement, gene mutation, MSI, and statistical analyses were funded by the research and development fund of Sysmex Corporation. The funder did not have a role in the study design, data collection and analysis, decision to publish, or preparation of the manuscript.
References
- Ferlay J, Soerjomataram I, Dikshit R, Eser S, Mathers C, et al. (2015) Cancer incidence and mortality worldwide: sources, methods and major patterns in GLOBOCAN 2012. Int J Cancer 136: E359-386.
- Gunderson LL, Jessup JM, Sargent DJ, Greene FL, Stewart AK (2010) Revised TN categorization for colon cancer based on national survival outcomes data. J Clin Oncol 28: 264-271.
- Douglas Scherr, Peter W Swindle, Peter T Scardino (2003) National Comprehensive Cancer Network Guidelines for the management of prostate cancer. Urology 61: 14-24.
- Moertel CG, Fleming TR, Macdonald JS, Haller DG, Laurie JA, et al. (1995) Fluorouracil plus levamisole as effective adjuvant therapy after resection of stage III colon carcinoma: a final report. Ann Intern Med 122: 321-326.
- Perez VB, Romera LA, Hernandez PS, Lopez CG, Calles A, et al. (2012) Colon cancer molecular subtypes identified by expression profiling and associated to stroma, mucinous type and different clinical behavior. BMC Cancer 12: 260.
- Oh SC, Park YY, Park ES, Lim JY, Kim SM, et al. (2012) Prognostic gene expression signature associated with two molecularly distinct subtypes of colorectal cancer. Gut 61: 1291-1298.
- Sadanandam A, Lyssiotis CA, Homicsko K, Collisson EA, Gibb WJ, et al. (2013) A colorectal cancer classification system that associates cellular phenotype and responses to therapy. Nat Med. 19: 619-625.
- De Sousa EMF, Wang X, Jansen M, Fessler E, Trinh A, et al. (2013) Poor-prognosis colon cancer is defined by a molecularly distinct subtype and develops from serrated precursor lesions. Nat Med 19: 614-618.
- Marisa L, de Reynies A, Duval A, Selves J, Gaub MP, et al. (2013) Gene expression classification of colon cancer into molecular subtypes: characterization, validation, and prognostic value. PLoS Med 10: e1001453.
- Sotiriou C, Pusztai L (2009) Gene-expression signatures in breast cancer. N Engl J Med 360: 790-800.
- Walther A, Johnstone E, Swanton C, Midgley R, Tomlinson I, et al. (2009) Genetic prognostic and predictive markers in colorectal cancer. Nat Rev Cancer 9: 489-499.
- Ribic CM, Sargent DJ, Moore MJ, Thibodeau SN, French AJ, et al. (2003) Tumor microsatellite-instability status as a predictor of benefit from fluorouracil-based adjuvant chemotherapy for colon cancer. N Engl J Med 349: 247-257.
- Sinicrope FA, Foster NR, Thibodeau SN, Marsoni S, Monges G, et al. (2011) DNA mismatch repair status and colon cancer recurrence and survival in clinical trials of 5-fluorouracil-based adjuvant therapy. J Natl Cancer Inst 103: 863-875.
- Hutchins G, Southward K, Handley K, Magill L, Beaumont C, et al. (2011) Value of mismatch repair, KRAS, and BRAF mutations in predicting recurrence and benefits from chemotherapy in colorectal cancer. J Clin Oncol 29: 1261-1270.
- Sinicrope FA, Mahoney MR, Smyrk TC, Thibodeau SN, Warren RS, et al. (2013) Prognostic impact of deficient DNA mismatch repair in patients with stage III colon cancer from a randomized trial of FOLFOX-based adjuvant chemotherapy. J Clin Oncol 31: 3664-3672.
- Goel A, Arnold CN, Niedzwiecki D, Chang D.K, Ricciardiello L, et al. (2003) Characterization of sporadic colon cancer by patterns of genomic instability. Cancer Res 63: 1608-1614.
- Nicolet C, Guerin E, Neuville A, Kerckaert JP, Wicker N, et al. (2009) Evidence for various 20q status using allelotyping, CGH arrays, and quantitative PCR in distal CIN colon cancers. Cancer Lett 282: 195-204.
- Mesker WE, Liefers GJ, Junggeburt JM, van Pelt GW, Alberici P, et al. (2009) Presence of a high amount of stroma and downregulation of SMAD4 predict for worse survival for stage I-II colon cancer patients. Cell Oncol 31: 169-178.
- Huijbers A, Tollenaar RA, Pelt v GW, Zeestraten EC, Dutton S, et al. (2013) The proportion of tumor-stroma as a strong prognosticator for stage II and III colon cancer patients: validation in the VICTOR trial. Ann Oncol 24: 179-185.
- Ngan CY, Yamamoto H, Seshimo I, Tsujino T, Man-iM, et al. (2007) Quantitative evaluation of vimentin expression in tumour stroma of colorectal cancer. Br J Cancer 96: 986-992.
- Jorissen RN, Gibbs P, Christie M, Prakash S, Lipton L, et al. (2009) Metastasis-Associated Gene Expression Changes Predict Poor Outcomes in Patients with Dukes Stage B and C Colorectal Cancer. Clin Cancer Res 15: 7642-7651.
- Hu Z, Fan C, Oh DS, Marron JS, He X, et al. (2006) The molecular portraits of breast tumors are conserved across microarray platforms. BMC Genomics 7: 96.
- Vasko V, Ferrand M, Cristofaro DJ, Carayon P, Henry JF, et al. (2003) Specific pattern of RAS oncogene mutations in follicular thyroid tumors. J Clin Endocrinol Metab 88: 2745-2752.
- Schmid K, Oehl N, Wrba F, Pirker R, Pirker C, et al. (2009) EGFR/KRAS/BRAF mutations in primary lung adenocarcinomas and corresponding locoregional lymph node metastases. Clin Cancer Res 15: 4554-4560.
- Lehman TA, Bennett WP, Metcalf RA, Welsh JA, Ecker J, et al. (1991) p53 mutations, ras mutations, and p53-heat shock 70 protein complexes in human lung carcinoma cell lines. Cancer Res 51: 4090-4096.
- Odenthal M, Barta N, Lohfink D, Drebber U, Schulze F, et al. (2009) Analysis of microsatellite instability in colorectal carcinoma by microfluidic-based chip electrophoresis. J Clin Pathol 62: 850-852.
- Kand Y. (2013) Investigation of the freely available easy-to-use software 'EZR' for medical statistics. Bone Marrow Transplant 48: 452-458.
- O'Connell MJ, Lavery I, Yothers G, Paik S, Clark-Langone KM, et al. (2010) Relationship between tumor gene expression and recurrence in four independent studies of patients with stage II/III colon cancer treated with surgery alone or surgery plus adjuvant fluorouracil plus leucovorin. J Clin Oncol 28: 3937-3944.
- Gray RG, Quirke P, Handley K, Lopatin M, Magill L, et al. (2011) Validation study of a quantitative multigene reverse transcriptase-polymerase chain reaction assay for assessment of recurrence risk in patients with stage II colon cancer. J Clin Oncol 29: 4611-4619.
- Venook AP, Niedzwiecki D, Lopatin M, Ye X, Lee M, et al. (2013) Biologic determinants of tumor recurrence in stage II colon cancer: validation study of the 12-gene recurrence score in cancer and leukemia group B (CALGB) 9581. J Clin Oncol 31: 1775-1781.
- Maak M, Simon I, Nitsche U, Roepman P, Snel M, et al. (2013) Independent validation of a prognostic genomic signature (ColoPrint) for patients with stage II colon cancer. Ann Surg 257: 1053-1058.
- Yamanaka T, Oki E, Yamazaki K, Yamaguchi K, Muro K, et al. (2016) 12-Gene Recurrence Score Assay Stratifies the Recurrence Risk in Stage II/III Colon Cancer With Surgery Alone: The SUNRISE Study. J Clin Oncol 34: 2906-2913.
- Yothers G, O'Connell MJ, Lee M, Lopatin M, Clark-Langone KM, et al. (2013) Validation of the 12-gene colon cancer recurrence score in NSABP C-07 as a predictor of recurrence in patients with stage II and III colon cancer treated with fluorouracil and leucovorin (FU/LV) and FU/LV plus oxaliplatin. J Clin Oncol 31: 4512-4519.
- Salazar R, Roepman P, Capella G, Moreno V, Simon I, et al. (2011) Gene expression signature to improve prognosis prediction of stage II and III colorectal cancer. J Clin Oncol 29: 17-24.
- Schmoll HJ, Van CE, Stein A, Valentini V, Glimelius B, et al. (2012) ESMO Consensus Guidelines for management of patients with colon and rectal cancer. a personalized approach to clinical decision making. Ann Oncol 23: 2479-2516.
- Kumar A, Kennecke HF, Renouf DJ, Lim HJ, Gill S, et al. (2015) Adjuvant chemotherapy use and outcomes of patients with high-risk versus low-risk stage II colon cancer. Cancer 121: 527-534.
- Sargent DJ, Marsoni S, Monges G, Thibodeau SN, Labianca R, et al. (2010) Defective mismatch repair as a predictive marker for lack of efficacy of fluorouracil-based adjuvant therapy in colon cancer. J Clin Oncol 28: 3219-3226.
- Vilar E, Gruber SB (2010) Microsatellite instability in colorectal cancer-the stable evidence. Nat Rev Clin Oncol 7: 153-162.
- De van MJ, He YD, van't Veer LJ, Dai H, Hart AA, et al. (2002) A gene-expression signature as a predictor of survival in breast cancer. N Engl J Med 347: 1999-2009.
- Buyse M, Loi S, van't VL, Viale G, Delorenzi M, et al. (2006) Validation and clinical utility of a 70-gene prognostic signature for women with node-negative breast cancer. J Natl Cancer Inst 98: 1183-1192.
- Wittner BS, Sgroi DC, Ryan PD, Bruinsma TJ, Glas AM, et al. (2008) Analysis of the MammaPrint breast cancer assay in a predominantly postmenopausal cohort. Clin Cancer Res 14: 2988-2993.
 Spanish
  Chinese
  Russian
  German
  French
  Japanese
  Portuguese
  Hindi
Hindi 