Research Article, J Vet Sci Med Diagn Vol: 6 Issue: 4
Short-Term Comparison of Magnetic Resonance Imaging and Spectroscopy in Persistent Canine Hepatic Encephalopathy Before and After Treatment
Mario Dolera1*, Luca Malfassi1, Cristina Bianchi1, Nancy Carrara1, Sara Finesso1, Silvia Marcarini1, Giovanni Mazza1, Simone Pavesi1, Massimo Sala1 and Gaetano Urso2
1La Cittadina Fondazione Studi e Ricerche Veterinarie, Cascina Cittadina, Romanengo, Italy
2Azienda ospedaliera della provincia di Lodi, Lodi, Italy
*Corresponding Author : Mario Dolera, PhD, DVM
La Cittadina Fondazione Studi e Ricerche Veterinarie, Cascina Cittadina, Romanengo, Italy
Tel: +39 3393516653
Fax: 037372227
E-mail: lacittadina@alice.it; lacittadinafondazione@gmail.com
Received: September 15, 2015 Accepted: August 19, 2017 Published: August 23, 2017
Citation: Dolera M, Malfassi L, Bianchi C, Carrara N, Finesso S, et al. (2017) Short-Term Comparison of Magnetic Resonance Imaging and Spectroscopy in Persistent Canine Hepatic Encephalopathy Before and After Treatment. J Vet Sci Med Diagn 6:4. doi: 10.4172/2325-9590.1000240
Abstract
Objective: To compare magnetic resonance imaging (MRI) and spectroscopy (MRS) findings in dogs affected by persistent hepatic encephalopathy (HE) before and after treatment and assess any correlation between plasma ammonia levels and metabolite concentrations.
Methods: In dogs with persistent HE, plasma ammonia measurement, brain MRI and single voxel MRS were performed before and 4 months after treatment. The concentrations of N-acetyl aspartate, (NAA) glutamate-glutamine complex (Glx), creatine (Cr), choline (Cho) and myo-inositol (mI) as well as the MRI findings were
compared and the correlation with plasma ammonia concentration was evaluated. Statistical analysis included Shapiro Wilk test, Student t-test and linear-fit regression.
Results: Twenty dogs were enrolled. Initial MRI and MRS showed alterations in 18/20 and 20/20 dogs respectively. The MRI findings were normalized in dogs aged less than 3 years. Comparing post-treatment metabolite concentrations with the control group, no statistically significant differences were evident for dogs aged less than 3 years, whereas dogs aged more than 5 years showed a persistent but not significant reduction in NAA and mI, with a statistically significant increase in Glx. In dogs younger than 3 years, but not in dogs older than 5 years, a positive correlation was detected between plasma ammonia levels and Glx (r=0.80, p=0.041) and a negative correlation between ammonia level and NAA (r=-0.96, p=0.03) and between NAA and Glx (r=-0.87, p=0.037). No correlation was observed for Cr, Cho and mI.
Conclusion: In young dogs MRI and MRS findings of persistent HE can normalize after effective treatment whereas abnormalities are still detected in older dogs. MRI and MRS could therefore be useful in the short-term treatment response evaluation of persistent canine HE.
Keywords: Magnetic resonance imaging; MRI; Magnetic resonance spectroscopy; MRS; Brain; Hepatic encephalopathy; Liver; Dog
Introduction
Hepatic encephalopathy (HE) is a neuropsychiatric syndrome determined by liver dysfunction or by portosystemic shunt [1]. In human patients, HE is classified into 3 types on the basis of etiology. Type A HE is caused by acute liver failure, type B HE is associated with Porto systemic shunts, and type C HE is associated with cirrhosis, portal hypertension or acquired vascular abnormalities and is subcategorized as episodic, persistent and subclinical [1]. In dogs, chronic HE is mostly due to congenital Porto systemic vascular abnormalities (type B), but it is also reported in acquired hepatopathies, such as cirrhosis and chronic hepatitis (type C); acute HE (type A) is much more rare and is usually caused by acute fulminant hepatic failure, such as a consequence of ingesting toxic agents (Amanita phalloides etc) [2].
The pathophysiology of this metabolic syndrome is multifactorial and still partly unknown. Nevertheless, there is general consensus that ammonia plays the main role [3-5] followed by abnormal serum levels of neurotoxic substances of intestinal derivation such asmercaptans, phenols and short-chain fatty acids, electrolyte imbalances, abnormal gluconeogenesis and inflammatory cytokines [6,7]. An abnormally elevated ammonia level, crossing the blood-brain barrier, causes neurotoxicosis and eventually damage to brain neurons and glia cells [8,9].
In Human Medicine magnetic resonance imaging (MRI) and spectroscopy (MRS) are considered useful tools to diagnose HE, providing a broad range of structural and functional findings associated with this syndrome [10].
Morphological MRI findings of HE have also been described in Veterinary Medicine [11,12] consisting of a characteristic diffuse cortical brain oedema that can be seen on T2-weighted and fluidattenuated inversion recovery (FLAIR) sequences. Recently, MRS has also been proposed to be a valuable diagnostic technique in dogs to detect abnormal ammonia metabolism within neuronal cells while noninvasively confirming the presence of the disease [12,13].
The aim of this study was to compare, respectively, MRI and MRS features in dogs affected by persistent HE (type B and type C) before and after treatment and assess any correlation between plasma ammonia levels, MRI and MRS findings.
Methodology Applied
We performed a prospective observational clinical study on client-owned dogs referred for neurological and imaging consultation between January 2008 and April 2013.
The enrollment criteria were: a) diagnosis of persistent HE (type B and type C) posed in dogs naive of any dietary restriction or therapeutic treatment, with clinical signs lasting at least 15 days on the basis of clinical-neurological criteria [6,14], graded at the time of hospital admission in accordance with a previously described 5-point scale [15]; b)12-hour fasting plasma ammonia concentration >50 nmol/L in venous blood samples [16-18] measured by the micro diffusion method (Menarini Arkray PocketChem BA PA-4130, Arkray, Universal Healthware, Inc., Kyoto 601-8045, Japan, measurement range 10-300 nmol/L); c) blood cell count and biochemical panel; d) pre-treatment MRI of the brain and of the abdomen ruling out other diseases, pre-treatment MRS of the brain; e) optional liver histopathology. All the procedures mentioned above were performed on the same day within 2 hours of admission. Twenty normal dogs, examined by MRI for other reasons, were included as controls for brain MRS examination. Even though MRS represents a non-invasive procedure, informed consent was obtained from the owners prior to MRS evaluation.
Four months after initiation of the appropriate therapy (surgical attenuation or medical treatment), repeat clinical examination, ammonia measurement and MRI-MRS were performed. In all cases we offered the best treatment for each dog. The choice of medical versus surgical treatment was done on the basis of the severity of the clinical signs, the risk connected with the surgical intervention and the financial considerations of the owner. Surgical treatment of extra-hepatic portosystemic shunts consisted of placing an ameroid constrictor (Research Instruments NW Inc., Sweethome Oregon, 97386. 541-367-1855) of adequate diameter around the abnormal vessel for gradual shunt attenuation. The conservative medical treatment of portosystemic shunt as well as for other chronic hepatopathies consisted of a hepatic-specific commercial diet containing protein from egg and soybean (Prescription Diet l/d, Hill’s Pet Nutrition Inc, Topeca, Kan). Owners were instructed to feed their dogs according to feeding instructions stated on the label. The amounts to feed were calculated according to the equation 132 kcal/kg metabolic body weight (kg0.75). Medical treatment also consisted of daily oral lactulose administration (0.5 mL/kg, q 8 h) and daily oral neomycin and bacitracin administration (Bimixin: neomycin 25000 U.I + bacitracin 2500 U.I tablet R, Sanophy, Milano; both active principles were given at a dosage of 5 mg/kg, q 12 h).
Regarding MRI and MRS examination, each dog, pre-medicated with dexmedetomidine (Dexdomitor 0,5mg/ml; Orion Pharma), was examined in lateral recumbency using a quadrature knee coil for the brain and a body quadrature coil for the abdomen. At the time of the first MRI and MRS examination, each dog was naive from any dietary restriction or medication.
MRI examination was performed with a total body 1.5T MRI scanner with a 5-channel receive-transmit head coil (Philips Intera 1.5T, Eindhoven, Netherland). Conventional MRI sequences were obtained before MRS and included for the brain, at a minimum, standard sequences obtained at a slice thickness of 3.0 mm with a 0.3-mm slice gap, field of view of 180 mm, and matrix of 356 X 260. Sequences included axial, dorsal and sagittal TSE T2-weighted (recovery time, 5,775 milliseconds; echo time, 100 milliseconds; number of signal averages, 3), transverse and dorsal FLAIR T2-weighted (recovery time, 1,100 milliseconds; echo time, 16 milliseconds; number of signal averages, 3), pre-contrast and postcontrast TE T1-weighted (recovery time, 14 milliseconds; echo time, 6.25 milliseconds; number of signal averages, 3). Gadoteridole (Magnevist EV 1FL 15 ml 469 mg/ml EV; Bayer Spa) was used as a contrast medium. Examination of the abdomen was performed by MRI and CT.
To guide MRS single-voxel placement, dorsal, transverse, and sagittal T2-weighted MRI images were used. The MRS data were acquired using single-voxel point-resolved spectroscopy with two different sections/timing: a first pulse sequence with an echo time of 35 milliseconds; recovery time, 2,000 milliseconds; number of signal averages, 240; spectral bandwidth, 2,000 Hz, and a second pulse sequence with an echo time of 144 milliseconds; recovery time, 2,000 milliseconds; number of signal averages, 240; spectral bandwidth, 2,000 Hz. Both sequences were performed with a voxel including the thalami and the piriform lobes. The orientation of each voxel was adjusted to match the size and shape of the targeted anatomic area, carefully avoiding the CSF and skull as much as possible. The slices and voxel geometry was same in the pre- and post-treatment examinations. The MRS images were obtained prior to contrast administration. As a control group, 20 dogs examined for other reasons underwent the same brain MRS protocol.
Concentrations of N-acetyl aspartate (NAA, considered a neuronal marker); glutamate and glutamine (Glx, substrate and precursor of the aminoacid involved in excitatory neurotransmission); creatine (Cr, metabolite of the energetic reservoir); choline derivates (Cho, cell membrane components); and myo-inositol (mI, putative glia marker, considered to be a more sensitive marker under HE [19,20] were estimated by ‘LCModel’ software using the brain water signal as an internal reference.
Statistical analysis was performed by the coordinator of our laboratory of Medical Physics (GU). The performed tests were the Shapiro Wilk test, applied to verify the normality of distribution of the data, the Student t-test to verify any difference in the distribution of the metabolites pre- and post-treatment with a p-value<0.05, and a linear-fit regression to evaluate the correlation between plasma ammonia concentration and metabolites, expressed as Pearson correlation coefficients (r).
Results
Twenty dogs, 13 females and 7 males, mean age 4.2 years (range: 7 months–12 years), met the enrolment criteria of this study. Breeds included 4 Dachshund, 4 Maltese Dog, 3 Jack Russell Terrier, 2 Miniature Pinscher, 1 Border Collie, 1 Maremma Sheepdog, 1 German Shepherd and 3 large-sized mixed breed dogs. As a control group 20 dogs examined for orthopaedic diseases were included.
Selected relevant clinical data on affected dogs was reported in Table 1.
| Case | Disease | Duration Of Liver Disease | Age | Treatment | Pre-Treatment He Score | Post-Treatment He Score | Pre-Treatment Ammonia |
Post-Treatment Ammonia | Pre-Treatment Mri |
Post-Treatment Mri | NAA pre Glx Cr Cho mI |
NAA post Glx Cr Cho mI |
|---|---|---|---|---|---|---|---|---|---|---|---|---|
| 1 | cpss | 12 y | 12 y | medical | 1 | 0 | 252 | 87 | m, s | m, s | 6.02, 20.33, 8.07, 3.45, 3.97 | 6.21, 10.11, 8.12, 3.67, 5.12 |
| 2 | cpss | 3 y | 3 y | medical | 1 | 0 | 185 | 57 | s | n | 5.56, 19.45, 8.23, 3.79, 3.64 | 7.23, 9.46, 8.00, 4.16, 5.78 |
| 3 | cpss | 1 y | 1 y | surgical | 2 | 0 | > HL | 45 | s | n | 7.23, 22.20, 7.59, 2.59, 2.88 | 8.12, 9.03, 8.08, 3.23, 6.57 |
| 4 | cpss | 6 m | 6 m | surgical | 3 | 0 | 280 | 54 | s | n | 7.56, 19.23, 7.45, 2.67, 3.26 | 8.45, 9.23, 8.22, 3.49, 6.28 |
| 5 | cirrhosis | 1 y | 9 y | medical | 1 | 0 | 146 | 100 | s | s | 5.32, 18.21, 7.18, 2.95, 4.17 | 6.26, 10.10, 7.92, 2.87, 5.32 |
| 6 | cpss | 8 m | 8 m | surgical | 1 | 0 | 190 | 34 | s | n | 6.23, 21.20, 7.59, 2.59, 2.88 | 7.37, 9.79, 8.01, 3.03, 6.47 |
| 7 | cpss | 16 m | 16 m | surgical | 2 | 0 | 221 | 29 | s | n | 5.93, 23.10, 7.41, 2.34, 3.64 | 8.22, 9.13, 7.58, 3.33, 6.22 |
| 8 | cpss | 7 y | 7 y | medical | 1 | 0 | 145 | 59 | m, s | m, s | 6.88, 21.53, 8.19, 3.10, 3.06 | 6.86, 14.41, 8.22, 3.22, 5.59 |
| 9 | cpss | 8 m | 8 m | surgical | 2 | 0 | 167 | 43 | s | n | 8.03, 17.20, 7.59, 2.59, 2.79 | 8.45, 11.18, 8.22, 4.19, 6.01 |
| 10 | microangio displasia |
3 y | 3 y | medical | 1 | 0 | 240 | 118 | s | s | 4.76, 23.15, 7.01, 3.29, 2.44 | 6.12, 13.03, 7.58, 3.23, 5.27 |
| 11 | apss | 6 m | 10 y | medical | 1 | 0 | 168 | 79 | n | n | 7.33, 22.10, 7.53, 2.19, 2.38 | 7.86, 13.45, 7.32, 3.02, 5.09 |
| 12 | cpss | 8 y | 8 y | medical | 1 | 0 | 248 | 170 | m, s | m, s | 4.08, 22.93, 7.79, 3.19, 3.02 | 4.96, 12.41, 8.12, 3.42, 5.39 |
| 13 | micro hepatia |
7 m | 7 m | medical | 2 | 0 | 112 | 67 | n | n | 6.96, 16.39, 8.15, 3.12, 4.27 | 8.45, 10.23, 8.12, 3.41, 6.78 |
| 14 | cpss | 13 m | 13 m | medical | 2 | 0 | > HL | 123 | s | n | 4.03, 23.17, 7.19, 2.25, 2.29 | 6.13, 12.37, 7.18, 3.22, 5.24 |
| 15 | cpss | 12 m | 12 m | surgical | 2 | 0 | 245 | 43 | s | n | 7.83, 17.14, 7.29, 2.44, 3.45 | 9.26, 8.75, 7.48, 4.33, 7.02 |
| 16 | cpss | 5 y | 5 y | medical | 1 | 0 | 134 | 56 | m, s | m, s | 7.08, 17.23, 8.79, 4.10, 4.06 | 6.86, 13.11, 8.72, 4.21, 5.79 |
| 17 | micro hepatia |
9 y | 9 y | medical | 1 | 0 | 119 | 58 | s | s | 8.16, 16.89, 8.15, 3.12, 4.17 | 8.85, 12.34, 8.22, 3.19, 6.21 |
| 18 | cpss | 8 y | 8 y | medical | 1 | 0 | 115 | 47 | m, s | m, s | 4.08, 18.73, 7.69, 3.24, 4.02 | 5.16, 13.33, 7.58, 3.17, 5.13 |
| 19 | cpss | 16 m | 16 m | medical | 2 | 0 | 184 | 98 | s | n | 7.13, 19.23, 8.17, 3.05, 4.17 | 7.21, 11.64, 8.12, 3.47, 5.33 |
| 20 | cpss | 2 y | 2 y | medical | 1 | 0 | > HL | 165 | s | n | 5.02, 22.16, 1.48, 2.75, 3.62 | 6.31, 12.01, 7.32, 3.01, 5.32 |
apss = acquired portosystemic shunt
>HL= Over the highest level detected by the micro diffusion method
s = altered signal
m = altered morphology
n = normal or reduced alteration compared to pre-treatment MRI
Table 1: Relevant clinical data on affected dogs.
Dogs had clinical signs for a minimum of 16 days to a maximum of 12 years (mean clinical signs duration, 3.3 years). Historical complaints described by the owners were: disorientation and lethargy in 20/20 dogs, inappropriate behaviour in 15/20, seizures in 12/20, pacing or circling in 7/20, amaurosis in 5/20, head pressing in 3/20. At the time of hospital admission the severity of HE was of grade 1 in 12 dogs, grade 2 in 7 dogs, and grade 3 in 1 dog. No correlation was observed between HE score and plasma ammonia concentration (p=0.21). Among the considered dogs, 15 suffered from a congenital portosystemic shunt (CPSS) and one had an acquired portosystemic shunt determined by neoplastic thrombosis of the portal vein (APSS). PSS were diagnosed by MRI and CT. Two dogs had microhepatia as evidenced by abdominal MRI. One dog suffered from hepatic angiodysplasia and one from liver cirrhosis, in both cases confirmed by liver biopsy. Six surgical corrections were done. All patients had an ammonia value higher than 100 nmol/L, mean 206 nmol/L, range: 112–280 nmol/L. After initiation of the treatment, the mean ammonia value observed was 76.6 nmol/L, range 29–165 nmol/L. In 14/20 dogs, the post-treatment plasma ammonia level was higher than the upper reference limit.
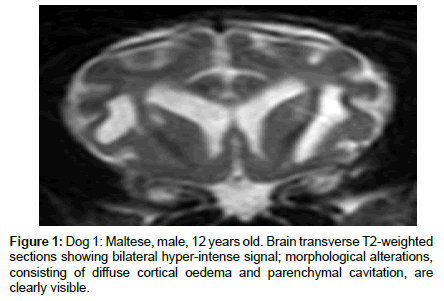
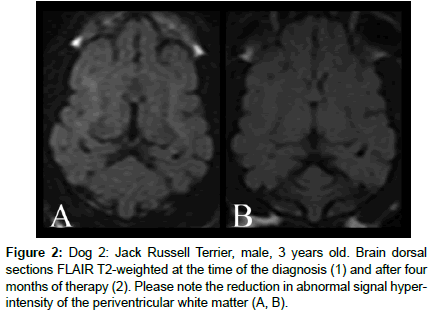
MRI brain exam ruled out other brain diseases in all dogs. At the first MRI examination, 18 dogs showed signal alteration in the brain on TSE and FLAIR T2-weighted pulse sequences, consisting of diffuse white matter hyper-intensity involving predominantly the hemispheric corticospinal tracts and the periventricular white matter (Figure 1). Additionally, 15 patients exhibited diffuse hyper-intensity of the brain stem on the same sequence. On the T1-weighted pulse sequence, slight hypo-intensity of the cerebral white matter was detected in 5 dogs, with no variations after contrast administration. In 5 dogs, all affected by HE lasting more than 5 years, widening of the cortical cerebral sulci and lateral ventricular enlargement were detected, and in two cases an overt parenchymal cavitation involving basal ganglia and frontal white matter was evident in T2-weighted and T1-weighted pulse sequences (Figure 2).
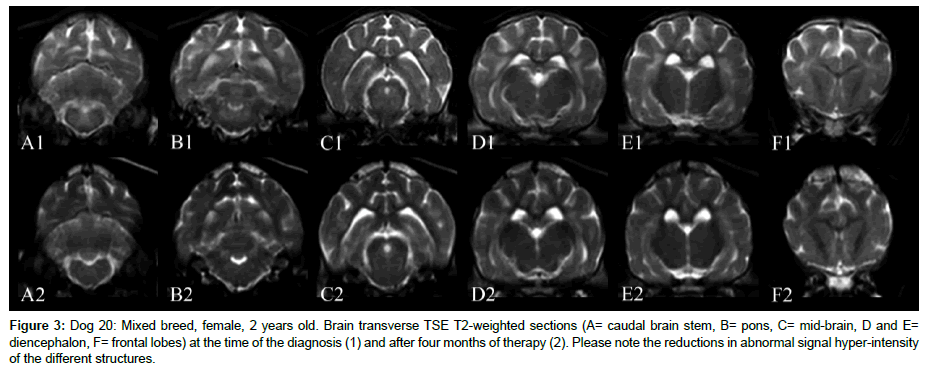
At the second MRI examination, in dogs with duration of disease of less than 3 years, a consistent reduction or normalization of the altered signal intensity in the brain was observed (Figure 3).
Figure 3: Dog 20: Mixed breed, female, 2 years old. Brain transverse TSE T2-weighted sections (A= caudal brain stem, B= pons, C= mid-brain, D and E= diencephalon, F= frontal lobes) at the time of the diagnosis (1) and after four months of therapy (2). Please note the reductions in abnormal signal hyper-intensity of the different structures.
In contrast, in dogs suffering from hepatic disease lasting more than 5 years, persistent signal and morphological alterations were detected.
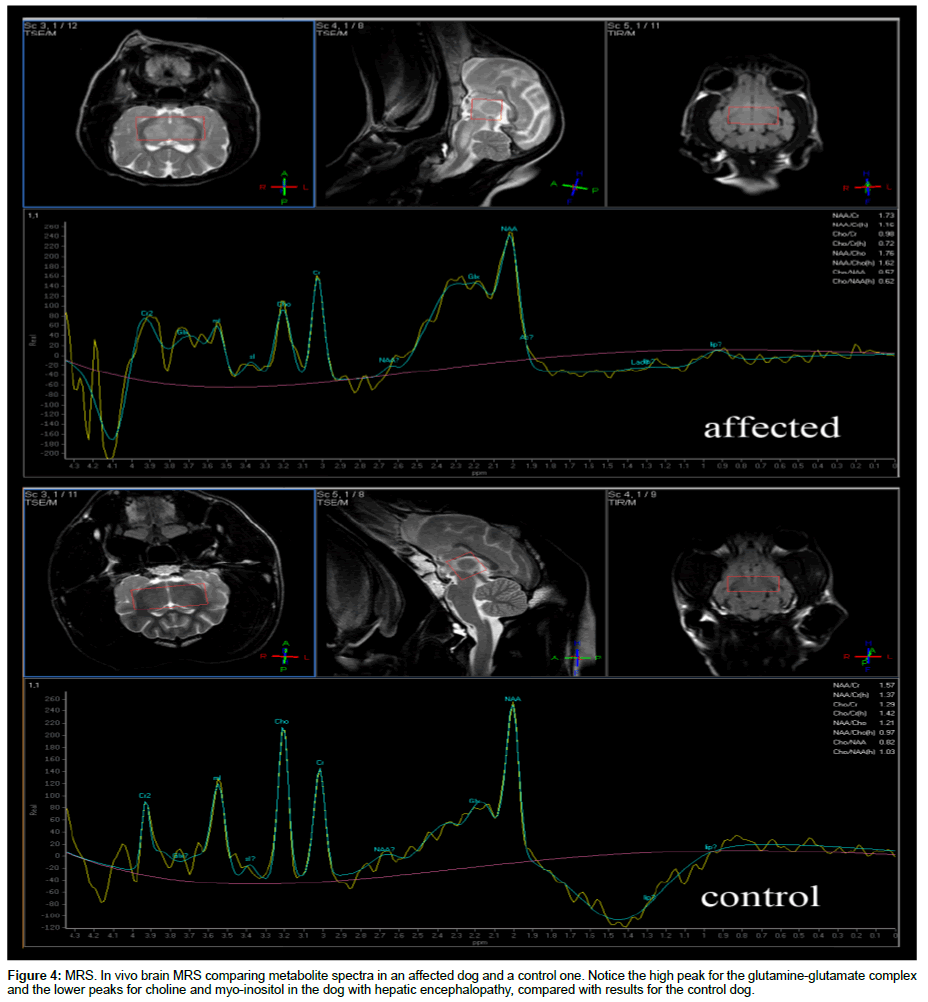
MRS spectra of the dogs with hepatic encephalopathy and control dogs were evaluated (Figure 4).
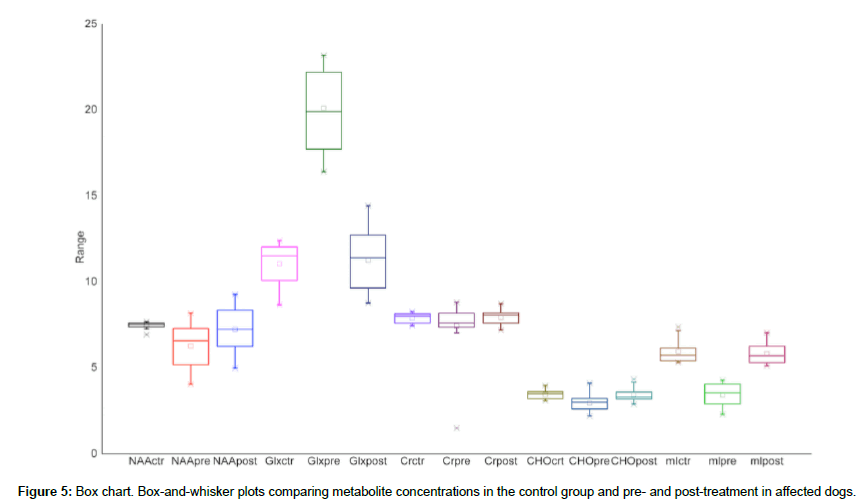
At the first MRS examination of affected dogs, the mean pretreatment NAA value was 6.26 mmol/L (range 4.03–8.16 mmol/L); the mean Glx pre-treatment concentration was 20.08 mmol/L (range 16.39–23.15 mmol/L); Cr had a mean pre-treatment value of 7.43 mmol/L (range 1.48–8.79 mmol/L); the mean Cho value was 2.94 mmol/L (range 2.19–4.01 mmol/L) and the mean mI pre-treatment concentration was 3.41 mmol/L (range 2.29–4.17 mmol/L).
In the control group, the mean NAA value was 7.45 mmol/L (range 6.91–7.67 mmol/L); the mean Glx concentration was 11.05 mmol/L (range 8.64–12.39 mmol/L); the mean Cr value was measured at 7.87 mmol/L (range 7.44–8.26 mmol/L); the mean Cho concentration was 3.44 mmol/L (range 3.08–3.96 mmol/L) and the mean mI value was 5.92 mmol/L (range 5.31–7.37 mmol/L).
Dogs with hepatic encephalopathy consistently showed statistically significant abnormalities compared with the control group (NAA affected pre-treatment ≠ NAA control, p=0.00119; Glx affected pre-treatment ≠ Glx control, p=0.00145088; Cho affected pre-treatment ≠ Cho control, p= 0.00263621; mI affected pretreatment ≠ mI control, p=0.00145088) with the exception of Cr concentration (Cr affected pre-treatment ≠ Cr control, p=0.26744).
At the second MRS examination of affected dogs, the mean NAA post-treatment value was 7.21 mmol/L (range 4.96–9.26 mmol/L); the mean Glx concentration was 11.25 mmol/L (range 8.75–14.41 mmol/L); mean Cr post-treatment value was measured as 7.91 mmol/L (range 7.32-8.72 mmol/L); the mean Cho post-treatment value was 3.44 mmol/L (range 2.87-4.33 mmol/L) and the mean mI value was 5.80 mmol/L (range 5.12-7.02 mmol/L).
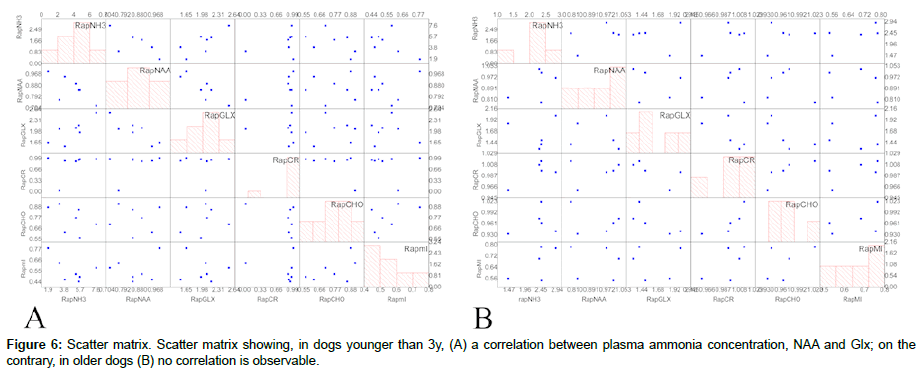
Comparisons of pre- and post-treatment metabolite concentrations were reported in Figure 5 and Table 2. Comparing post-treatment metabolite values of affected dogs with control group dogs, no statistically significant differences were evident for dogs aged less than 3 years (NAA3y affected post-treatment ≠ NAA control, p=0.78706; Cr3y affected post-treatment ≠ Cr control, p=0.78727; Glx3y affected post-treatment ≠ Glx control, p= 0.34736; Cho3y affected post-treatment ≠ Cho control, p= 0.8096; mI3y affected post-treatment ≠ mI control, p=0.85442), whereas dogs aged more than 5 years showed persistent but not significant reductionsin NAA and mI, with a persistent statistically significant increase in Glx (NAA5y affected post-treatment ≠ NAA control, p=0.09883; Cr5y affected post-treatment ≠ Cr control, p=0.36581; Glx5y affected posttreatment ≠ Glx control, p=0.04988; Cho5y affected post-treatment ≠ Cho control, p=0.4418; mI5y affected post-treatment ≠ mI control, p=0.11096). Correlations between brain metabolites and plasma ammonia level are shown in Figure 6. In dogs younger than 3 years a positive correlation was detected between plasma ammonia levels and Glx (r=0.80, p=0.041) and a negative correlation between ammonia level and NAA (r=-0.96, p=0.03) and between NAA and Glx (r=- 0.87, p=0.037). No correlation was observed for any of the other metabolites. In dogs older than 5 years the same statistical analysis failed to identify a correlation between any of the metabolites.
| Case | Age | % Difference NAA pre e posttreatment | % Difference Glx pre e posttreatment | % Difference Cr pre e posttreatment | % Difference Cho pre e posttreatment | % Difference ml pre e posttreatment | % Differenc eammonia pre epost treatment |
|---|---|---|---|---|---|---|---|
| 1 | 12 y | 3.1 | -101.1 | 0.6 | 6.0 | 22.5 | -189.7 |
| 2 | 3 y | 23.1 | -105.6 | -2.9 | 8.9 | 37.0 | -224.6 |
| 3 | 1 y | 11.0 | -145.8 | 6.1 | 19.8 | 56.2 | - |
| 4 | 6 m | 10.5 | -108.3 | 9.4 | 23.5 | 48.1 | -418.5 |
| 5 | 9 y | 15.0 | -80.3 | 9.3 | -2.8 | 21.6 | -46.0 |
| 6 | 8 m | 15.5 | -116.5 | 5.2 | 14.5 | 55.5 | -458.8 |
| 7 | 16 m | 27.9 | -153.0 | 2.2 | 29.7 | 41.5 | -662.1 |
| 8 | 7 y | -0.3 | -49.4 | 0.4 | 3.7 | 45.3 | -145.8 |
| 9 | 8 m | 5.0 | -53.8 | 7.7 | 38.2 | 53.6 | -288.4 |
| 10 | 3 y | 22.2 | -77.7 | 7.5 | -1.9 | 53.7 | -103.4 |
| 11 | 10 y | 6.7 | -64.3 | -2.9 | 27.5 | 53.2 | -112.7 |
| 12 | 8 y | 17.7 | -84.8 | 4.1 | 6.7 | 44.0 | -45.9 |
| 13 | 7 m | 17.6 | -60.2 | -0.4 | 8.5 | 37.0 | 67.2 |
| 14 | 13 m | 34.3 | -87.3 | -0.1 | 30.1 | 56.3 | - |
| 15 | 12 m | 15.4 | -95.9 | 2.5 | 43.6 | 50.9 | -469.8 |
| 16 | 5 y | -3.2 | -31.4 | -0.8 | 2.6 | 29.9 | -139.3 |
| 17 | 9 y | 7.8 | -36.9 | 0.9 | 2.2 | 32.9 | -105.2 |
| 18 | 8 y | 20.9 | -40.5 | -1.5 | -2.2 | 21.6 | -144.7 |
| 19 | 16 m | 1.1 | -65.2 | -0.6 | 12.1 | 21.8 | -87.8 |
| 20 | 2 y | 20.4 | -84.5 | 79.8 | 8.6 | 32.0 | - |
| Mean | 13.6 | -82.1 | 6.3 | 14.0 | 40.7 | -218.2 | |
| Deviation | 9.9 | 33.6 | 17.7 | 13.9 | 12.7 | 179.8 |
Table 2: Differences in pre- and post-treatment metabolites concentrations.
Discussion
To the authors’ knowledge, this is the first in vivo longitudinal study conducted in dogs suffering from persistent HE comparing preand post-treatment brain MRI and MRS findings.
In our study, pre-treatment MRS findings were consistent with those of human patients diagnosed with overt persistent HE [21], whereas post-treatment MRS findings resembled those of minimal paediatric HE [22]. Specifically, pre-treatment proton spectroscopy showed, compared to the control group, an increased Glx concentration, reductions in Cho and mI and a normal to reduced concentration of NAA. At the same time, the MRI exhibited modifications in 18 patients consisting of signal alterations, such as hyper-intensity in T2-weighted pulse sequences and morphological lesion of the brain; only 2 patients, a 7-month-old female Border Collie with congenital micro-hepatia and a 10-year-old Dachshund suffering from a newly acquired portosystemic shunt secondary to a neoplastic thrombus, did not present any MRI modification.
Comparing post-treatment metabolite concentrations with those in the control group, no statistically significant differences were evident in dogs aged less than 3 years, whereas dogs aged more than 5 years showed persistent but not significant reductions in NAA and mI, with a statistically significant increase in Glx. In dogs younger than 3 years, but not in dogs older than 5 years, a positive correlation was detected between plasma ammonia level and Glx (r=0.80, p=0.041) and a negative correlation between ammonia level and NAA (r=- 0.96, p=0.03) as well as between NAA and Glx (r=-0.87, p=0.037). No correlation was observed for Cr, Cho and mI.
Regarding post-treatment MRI findings, morphological and signal alterations on T2-weighted images remained stable in patients who had long lasting hepatic disease; in contrast, cortical and white matter hyper-intensity, typical of the early phases of hepatic encephalopathy, tended to disappear in younger patients. We hypothesized, according to these results, that permanent lesions in dogs older than 3 years old are likely to represent gliosis, as their morphological lesions showing in MRI did not improve after therapy, suggesting a neural cell loss. These data are in agreement with the different variations in pre- and post-treatment NAA values detected in young and older dogs. In contrast, the pathogenesis of the younger dogs’ findings is more reasonably a representation of cerebral swelling, which effectively disappears, showing post-treatment sequences consistent with those of healthy dogs from the control group. In this context, MRS examination could be more sensitive than MRI in evaluating the treatment response in long lasting chronic hepatic encephalopathy.
Linear-fit analysis highlighted a linear correlation between plasma ammonia level, NAA and Glx concentrations. These results corroborate the assumption that ammonia plays a major role in the pathogenesis of hepatic encephalopathy. However, the severity of HE graded at hospital admission did not correlate with fasting plasma ammonia. These results, in accordance with published data, must be interpreted cautiously. In fact, it is possible that the severity of HE could be influenced by the historical plasma ammonia level. In this scenario, our data could suggest a possible role for MRI and MRS in monitoring HE treatment response.
Ammonia is a by-product of nitrogen metabolism. It is derived from the gut and is absorbed into the hepatic portal circulation and transported to the liver. Under normal physiological conditions, it enters the urea cycle and is metabolized. Ammonia that bypasses this primary fate is subsequently picked up and detoxified by glutamine synthetase (GS), an enzyme found in the hepatocytes surrounding the hepatic vein (as well as in muscle and astroglial cells) that catalyses the conversion of ammonia and glutamate to glutamine.
Astrocytes are the only cells in the central nervous system capable of detoxifying ammonia via glutamine synthetase [23]; therefore, their uptake of glutamate is an important pathway since ammonia removal in the brain relies entirely on the amidation of glutamate to glutamine [24,25]. Consequently, hyper-ammonemia leads to an excess of glutamine [23,26], which contributes, according to the osmotic gliopathy theory [27], to increase the intracellular osmotic pressure with subsequent astrocyte swelling and oxidative stress due to NO and ROS production in the mitochondria that creates a secondary oedema [28]. The Trojan horse theory proposes, instead, that glutamine acts as a carrier able to transfer ammonia across the mitochondrial membranes, interfering with their function and leading to abnormal membrane permeability causing energy failure and cellular oedema. Furthermore, a number of structural and functional abnormalities occur in cultured astrocytes after their exposure to ammonia, prompting the suggestion that HE may represent a “primary gliopathy”, i.e., that functional derangements of astrocytes leading to neuronal abnormalities are at the core of the pathogenesis of HE [29,30].
In the last decades, MRI and MRS have become powerful and reliable diagnostic tools, due to the fact that they are applicable in vivo, non-invasively and consequently longitudinally; these aspects enable clinicians to monitor disease progression and treatment effectiveness. Therefore, MRI combined with MRS might provide a method to assess the pathogenesis, diagnosis and monitoring of HE as well as treatment evaluation.
MRS provides information about the metabolic statue of tissues. It consists of evaluating the proton relaxation of a small volume of tissue to obtain a spectrum of signals depending on frequency in which each metabolite has a specific position along the spectrum. Recently, it has been stated that MRS is also a quantitative and qualitative tool for the in vivo assessment of metabolic derangements, such as HE, in dogs [13] and can be used to support a diagnosis of hepatic encephalopathy, playing a decisive role in detecting abnormal ammonia metabolism within neural cells.
MRI and MRS findings at pre- and post-treatment could be explained taking into count the above reported theory regarding the pathogenesis of hepatic encephalopathy. In younger dogs, the slight hyper-intensity of the white matter, cortex and brain stem on TSE T2-weighted and FLAIR T2-weighted pulse sequences could also be connected to thiamine deficiency [31,32], together with glucose (altered gluconeogenesis) and electrolyte imbalances (hypernatremia) and increased ammonia, that cause astrocyte swelling and a mild diffuse cerebral oedema. On the other hand, with the disease’s progression more marked and non-reversible alterations could be noticed, such as cortical thinning and slight ventricular enlargement from white matter atrophy, probably due to gliosis and neuron loss.
This data is consistent with the MRS results. In particular, the normalization of the MRS spectra and reduction/normalization of MRI findings in younger dogs suggest a “healing capability” of the brain whereas the persistence of MRI and MRS alterations in older dogs suggests a partial resolution of the syndrome.
Also, some studies report a better long-term outcome in surgically corrected dogs, but randomized controlled clinical trials, experiments or cohort studies of high evidentiary value are lacking [33]. Interestingly, in our group we obtained no statistically different results in terms of MRI and MRS findings in medically managed and surgically corrected dogs. These are short-term results and further longitudinal studies with a longer follow up are needed. Interestingly, we obtained a grade 0 score for HE even in dogs with slightly elevated post-treatment plasma ammonia. These results highlight the need to determinate the sensitivity and specificity of clinical examination and, moreover, of MRI and MRS in the diagnosis of persistent minimal HE in dogs.
This study has some limitations which include: the small numbers of enrolled dogs, the short follow up, the different number of cases of each disease and the over-representation of vascular malformations. Moreover, histopathological confirmation of hepatic disease was not available in all cases and histopathological brain analysis was not performed.
To conclude, high field MRI combined with brain MRS could support a non-invasive diagnosis of persistent canine HE. Characteristic spectra correlate with plasma ammonia levels but don’t correlate with HE grade. MRI and MRS findings could be useful in assessing the short-term treatment response either in younger dogs or in older ones. Such results could be interesting per se but also from a translational perspective in order to monitor the disease progression in human patients. MRS can add an objective measure of cerebral involvement in dogs with symptoms suggestive of HE. The dog could serve as a model to study HE in humans.
References
- Ferenci P, Lockwood A, Mullen K, Tartar R, Weissenborn K, et al. (2002) Hepatic encephalopathy: definition, nomenclature, diagnosis, and quantification: final report of the working party at the 11th World Congresses of Gastroenterology, Vienna, 1998. Hepatology 35: 716-721.
- Ettinger SJ, Fieldman EC (2010) Textbook of veterinary internal medicine. (7th edtn), Elsevier, Netherlandds.
- Aldridge DR, Tranah EJ, Shaw DL (2015) Pathogenesis of Hepatic Encephalopathy: Role of ammonia and systemic inflammation. J Clin Exp Hepatol 5: S7-S20.
- Butterworth RF, Giguère JF, Michaud J, Lavoie J, Layrargues GP (1987) Ammonia: key factor in the pathogenesis of hepatic encephalopathy. Neurochemical Pathology 6: 1-12.
- Felipo V, Butterworth RF (2002) Neurobiology of ammonia. Prog Neurobiol 67: 259-279.
- Vilstrup H, Amodio P, Bajaj J, Cordoba J, Ferenci P, et al. American association for the study of liver diseases; european association for the study of the liver. Hepatic encephalopathy in chronic liver disease: 2014 practice guideline by the european association for the study of the liver and the american association for the study of liver diseases. j Hepatol 61: 642-659.
- Tivers MS, Handel I, Gow AG, Lipscomb VJ, Jalan R, et al. (2015) Attenuation of congenital portosystemic shunt reduces inflammation in dogs. Plos One 10: e0117557.
- Lockwood AH (2004) Blood ammonia levels and hepatic encephalopathy. Metab Brain Dis 19: 345-349.
- Van Straten G, Spee B, Rothuizen J, Van Straten M, Favier RP (2015) Diagnostic value of the rectal ammonia tolerance test, fasting plasma ammonia and fasting plasma bile acids for canine portosystemic shunting. Vet J 204: 282-286.
- Zhang XD, Zhang LJ, Wu SY, Lu GM (2014) Multimodality magnetic resonance imaging in hepatic encephalopathy: an update. World J Gastroenterol 20: 11262-11272.
- Moon SJ, Kim JW, Kang BT, Lim CY, Park HM (2012) Magnetic resonance imaging findings of hepatic encephalopathy in a dog with a portosystemic shunt. J Vet Med Sci 74: 361-366.
- Dolera M, Malfassi L, Marcarini S (2013) Hepatic Encephalopathy in the dog: magnetic resonance spectroscopy. Proceedings of the 2013 EVDI Annual Scientific Meeting.
- Carrera I, Kircher PR, Meier D, Richter H, Beckman K, et al. (2014) In vivo proton magnetic resonance spectroscopy for the evaluation of hepatic encephalopathy in dogs. Am J Vet Res 75: 818-827.
- Conn HO, Lieberthal MM (1979) The Hepatic coma syndromes and lactulose. Lippincott Williams & Wilkins, Baltimore, US.
- Proot S, Biourge V, Teske E, Rothuizen J (2009) Soy protein isolate versus meat-based low-protein diet for dogs with congenital portosystemic shunts. J Vet Intern Med 23: 794-800.
- Gerritzen-Bruning MJ, Van den Ingh TS, Rothuizen J (2006) Diagnostic value of fasting plasma ammonia and bile acid concentrations in the identification of portosystemic shunting in dogs. J Vet Intern Med 20: 13-19.
- Tivers MS, Handel I, Gow AG, Lipscomb VJ et al. (2014) Hyperammonemia and systemic inflammatory responsesyndrome predicts presence of hepatic encephalopathy in dogs with congenital portosystemic shunts. PLoS One 9: e82303.
- Lidbury JA, Ivanek R, Suchodolski JS, Steiner JM (2015) Putative precipitating factors for hepatic encephalopathy in dogs: 118 cases (1991-2014). J Am Vet Med Assoc 247: 176-183.
- Mardini H, Smith FE, Record CO, Blamire AM (2011) Magnetic resonance quantification of water and metabolites in thebrain of cirrhotics following induced hyperammonaemia. J Hepatol 54: 1154-1160.
- Zhang LJ, Lu GM, Yin JZ, Qi J (2010) Metabolic changes of anterior cingulate cortex in patients with hepatic cirrhosis: A magnetic resonance spectroscopy study. Hepatol Res 40: 777-785.
- Chavarria L, Cordoba J (2015) Magnetic resonance imaging and spectroscopy in hepatic encephalopathy. J Clin Exp Hepatol 5 (Suppl.1): S69-S74.
- Foerster B, Conklin C, Petrou M, Barker P, Schwarz K (2009) Minimal hepatic encephalopathy in children: evaluation with proton mr spectroscopy. Am J Neuroradiol 30(8): 1610-1613.
- Norenberg MD (1979) Distribution of glutamine synthetase in the rat central nervous system. J Histochem Cytochem 27: 756-762.
- Van Straten G, Van Steenbeek FG, Grinwis GCM, Favier RP, Kummeling A, et al. (2014) Aberrant expression and distribution of enzymes of the urea cycle and other ammonia metabolizing pathways in dogs with congenital portosystemic shunts. PLoS One 9: e100077.
- Rose C (2006) Effect of ammonia on astrocytic glutamate uptake/release mechanisms. J Neurochem 97: 11-15.
- Albrecht J, Norenberg MD (2006) Glutamine: A Trojan horse in ammonia neurotoxicity. Hepatology 44: 788-794.
- Brusilow SW, Koehler RC, Traystman RJ, Cooper AJL (2010) Astrocyte glutamine synthetase: importance in hyperammonemic syndromes and potential target for therapy. Neurotherapeutics 7: 452-470.
- Seyan AS, Hughes RD, Shawcross DL (2010) Changing face of hepatic encephalopathy: Role of inflammation and oxidative stress. World J Gastroenterol 16: 3347-3357.
- Norenberg MD (2001) Astrocytes and ammonia in hepatic encephalopathy: Astrocytes in the aging brain. Humana Press, New Jork.
- Norenberg MD (1998) Astroglial dysfunction in hepatic encephalopathy. Metab Brain Dis 13: 319-335.
- Moon SJ, Kang MH, Park HM (2013) Clinical signs, MRI features, and outcomes of two cats with thiamine deficiency secondary to diet change. J Vet Sci 14: 499-502.
- Garosi LS, Dennis R, Platt SR, Corletto F, de Lahunta A, et al. (2003) Thiamine deficiency in a dog: clinical, clinicopathologic, and magnetic resonance findings. J Vet Intern Med 17: 719-723.
- Owen SL, Parnell NK (2011) What is the evidence? Portosystemic shunt in a dog. J Am Vet Med Assoc 238: 859-861.
 Spanish
  Chinese
  Russian
  German
  French
  Japanese
  Portuguese
  Hindi
Hindi 