Research Article, Soil Erodibility Permeability Structure Gis Gilgel Ghibei Vol: 6 Issue: 1
Soil Erodibility Analysis and Mapping in Gilgel Ghibe-1 Catchment, Omo Ghibe River Basin, Ethiopia.
Gizaw Tesfaye1*, Tolesa Ameyu2
1Department of Agriculture, Ethiopian Institute of Agricultural Research, Melkasa Agricultural Research Centre, Ethiopia
2Department of Agriculture, Ethiopian Institute of Agricultural Research; Jima Agricultural Research Centre, Ethiopia
*Corresponding Author: Gizaw Tesfaye
Department of Agriculture, Ethiopian Institute of Agricultural Research, Melkasa Agricultural Research Centre, Ethiopia
Tel no: 251912803173;
E-mail: gzwtesfaye@gmail.com
Received date: 07 December, 2021, Manuscript No. JSPH-21-39104;
Editor assigned date: 09 December, 2021, PreQC No. JSPH-21-39104 (PQ);
Reviewed date: 23 December, 2021, QC No JSPH-21-39104;
Revised date: 28 December, 2021, Manuscript No. JSPH-21-39104 (R);
Published date: 07 January, 2022, DOI:10.4172/jsph.1000121
Citation: Tesfaye G and Ameyu T (2022) Soil Erodibility Analysis and Mapping in Gilgel Ghibe-1 Catchment, Omo Ghibe River Basin, Ethiopia. J Soil Sci Plant Health 6:1.
Abstract
Soil erodibility factor measures the susceptibility of soil particles to transportation and detachment by erosive agents. Soil erosion and sedimentation models use soil characteristics and erodibility as major input. However, in developing country like Ethiopia including the catchment soil erodibility and soil related properties data is limited. Due to this different scholars use different data source which is adopted from large scale and come up with very varying result. Because of this the study was designed to avail soil erodibility data of the catchment from primary data. A total of 80 composite soil samples were collected from the catchment with a GPS coordinate and analyzed for soil textural class (hydrometer method) and soil organic matter (walkley-black method) at Jima Agricultural Research Centre soil, water and plant tissue laboratory.
Keywords: Soil erodibility; Permeability; Structure; GIS; Gilgel ghibe-I
Keywords
Soil erodibility; Permeability; Structure; GIS; Gilgel ghibe-I
Introduction
Erodibility defines the resistance of the soil to both detachment and transport. Soil’s resistance to erosion depends in part on topography, land slope and soil disturbance (2003). It is an estimate of the ability of soil to resist erosion based on the physical characteristics of each soil (2017). Soil erodibility varies with soil texture, aggregate stability; shear strength, infiltration capacity and chemical soil content (1980). Water erosion is accentuated by soil properties like presence of clay and de-structured soils with low water permeability; which influences the hydrological characteristics, soil permeability to water and air, stability and configuration of porous space. Soil destruction is determined by natural limiting factors: unbalanced size composition, reduced amount of humus, continental climate, anthropogenic factors belonging mostly to conventional agriculture (2013).
Soil erodibility factor measures the susceptibility of soil particles to transportation and detachment by the amount of rainfall and runoff input (1997); and it is known that the most easily eroded soil particles are silt and very fine sand, and less erodible soil particles are aggregated soils because they are accrued together making it more resistible (2006).
Many publications consider soil erodibility as a year-around constant parameter for a given soil (1995) and indicate that soil erodibility can be determined from stable soil properties (1999). Other studies have indicated that soil erodibility varied for a given soil as a function of location, climate change, and human activity (2007). Therefore, soil erodibility should be considered as a non-constant term that varies in space and time; which may mislead the result of soil erosion rate and sedimentation rate. All soil erosion and sedimentation models use soil characteristics, soil erodibility, as a major input. Due to limited data availability regarding soil properties in developing countries, Gilgel Ghibe-1 catchment, and different scholars use different data sources that were adopted from a large scale. This may lead to very varying sedimentation and erosion rate in the catchment, like 1.1 ton ha-1year-1 (2006), 106.68 ton ha-1year-1 (2008), 0 to
127.73 ton ha-1year-1 (2013) and 0.43 to 132.08 ton ha-1year-1(2013) which may be due to lack of soil erodibility data source in the country as a whole, and specifically in the catchment. Because of these, the study mainly aimed to analyze some soil properties through detailed soil survey and map soil erodibility value of the catchment [1-3].
Materials and Methods
Description of the study area
Gilgel Ghibe-1 catchment is situated in Omo Ghibe basin, South West Ethiopia, with a total area of 4225 km2 at the dam site and located in between 7o19’07.15’’ to 8o12’09.49’’N latitudes and 36o31’42.60’’ to 37o25’16.05’’ E longitudes. The basin is generally characterized by high relief hills and mountains with an average elevation of about 1700 m above mean sea level (2013). The geology of the catchment is related to the uplifting of the East African Rift Valley in the Upper Eocene. The major soil types of the catchment are Nitisols, Fluvisols, Acrisols and vertisols (dominant) (2013).
The catchment is characterized by a wet climate with an average annual rainfall of about 1347 mm and an average temperature ranging from 19 ºC to 24.78 ºC. The seasonal rainfall distribution takes a Uni- modal pattern with its maximum during the summer and minimum during the winter, influenced by the inter-tropical convergence zone(ITCZ) (2013).
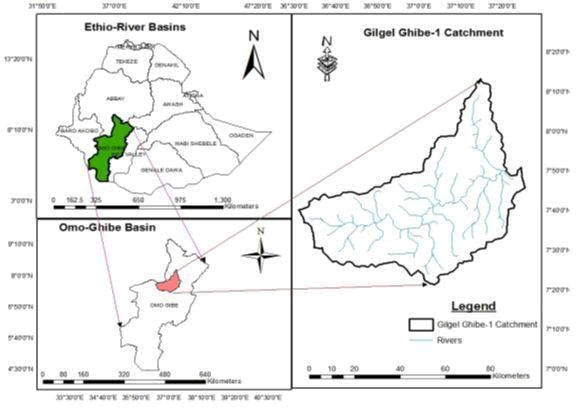
Figure 1: Wet climate with an average annual rainfall of about 1347 mm in seasonal rainfall distribution.
Soil survey and analysis
A total of 80 composite soil samples were systematically collected from 0cm-30 cm soil depth using auger on the bases topographic (slope steepness and aspect), land use land cover, soil color variability. Collected soil samples were taken to Jimma Agricultural Research Centre, soil and plant tissue analysis laboratory and analyzed for soil textural class (hydrometer method), and organic matter (Walkley black method). Soil structure was determined during soil sampling on the field using soil survey manual (2017) and soil permeability rate was derived from the relation between soil textural classes and permeability rate developed by (1971) [4].
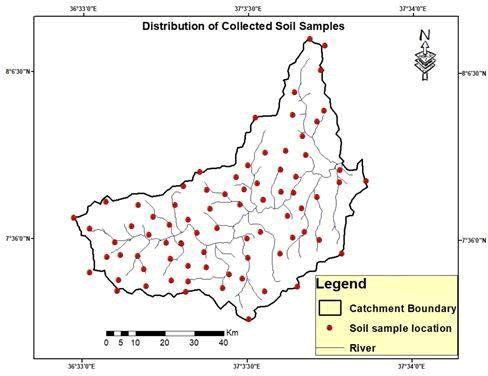
Figure 2: Distribution of the collected soil samples location in the catchment is shown.
Soil erodibility value for each soil sample locations was calculated with the NOMO model with the equation proposed by Wischmeier using the following formula and spatial soil erodibility map with generated through interpolation by “kriging” method in Arc GIS environment. Similarly, spatial maps of soil textural class, soil organic matter, soil structure and soil permeability rating of the catchment was also generated through interpolation in Arc GIS environment with 30m cell size resolution [5].
Where, K=Soil erodibility; M=Particle size parameter: (percent silt+percent very fine sand) (100−percent clay), a=Percent organic matter, b=Soil structure code used in soil classification: (very fine granular=1, Fine granular=2, medium or coarse granular=3, blocky, platy or massive=4) and c=Soil permeability class: (rapid=1, moderate to rapid=2, moderate=3, slow to moderate=4, slow=5, very slow =6)
Result and Discussion
Soil textural class
Soil texture (which refers to relative proportion of sand, silt and clay) is an important property contributing to soil’s erodibility. Soils with more sand particles are prone to erosion when compared to soils with more clay content. Sandy clay loam covers more than 65% of the catchment followed by sandy loam (32%) and sandy clay covers less than 3% of the total catchment.
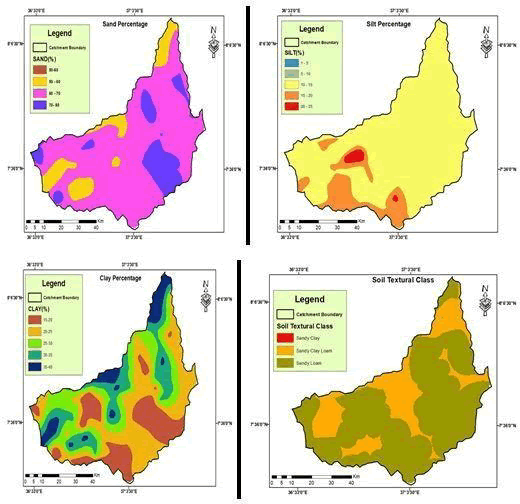
Figure 3: Sand, sandy loam and loam-textured soils tend to be less erodible than silt, very fine sand and certain clay-textured soils.
Soil erodibility is low for clay rich soils with a low shrink-swell capacity because clay particles mass together and form large aggregates that resist detachment and transport process (2006).
Soil organic matter
Soil Organic Matter (SOM) is an aggregating agent that binds mineral particles together to develop soil structure, and soils with high SOM are more resistant to erosion. Soil organic matter affects soil erodibility, infiltration, and water detention and shear strength of soil, which influenced soil erodibility.
Soil organic matter ranged from the lower of 2.487% (at upper part of the catchment) up to the highest of 5.15% (near the outlet of the catchment). Then mean SOM of the catchment was resulted 3.82 with
a standard deviation of 0.49. Soils with less than 2% organic matter can be considered erodible. Soils with higher levels of organic matter and improved structure have a greater resistance to erosion. Soils of the catchment are resistance to erosion since the minimum soil erodibility value of the catchment was resulted 2.46% which is greater than 2%. Spatial distribution of SOM of the catchment is shown in (Figure 4) and it is high on the hill parts covered with forest and coffee based agro forestry and, less at bottom valley of the catchment [6,7].
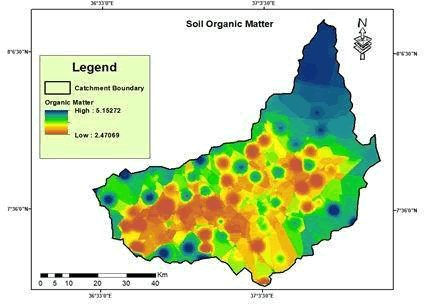
Figure 4: Spatial distribution of SOM of the catchment.
Soil structure and permeability
Soil structure refers to the arrangement of soil particles in the soil. Soil with poor soil structure near the soil surface has a high risk of generating runoff. Permeability describes the capacity of soil to transmit water which depends upon the pores in the soil and how they are connected.
Slow to moderate soil permeability covers 66% of the catchment area and 21% of the catchment area was covered by slow soil permeability. And only 12.7% of the catchment area has moderate soil permeability. Medium or coarse granular soil structure dominates most parts of the catchment area (at high elevation and around the bottom valleys) by covering more than 78%. Similarly, fine granular soil structure covers about 21% of the catchment mainly upper part of the catchment [8].
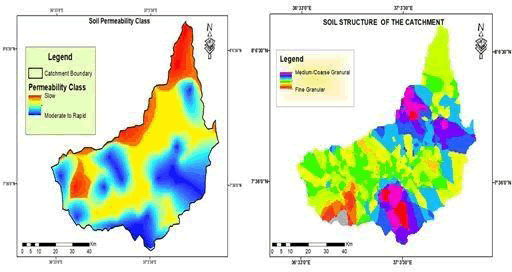
Figure 5: Slow to moderate soil permeability covers 66% of the catchment area and 21% of the catchment area was covered by slow soil permeability.
Soil erodibility
The soil erodibility expresses an inherent resistance to particle detachment (degradation) and transport by the rainfall. It is determined by the cohesive force between the soil particles; that may vary
depending on the presence or absence of plant cover, the soil water content and the development of its structure. Mean weighted soil erodibility value of Gilgel gibe-1 catchment was 0.35 ton hMJ-1mm- 1 with a range of 0.28 to 0.41 ton h MJ-1 mm-1.
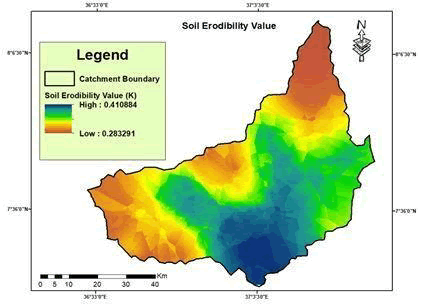
Figure 6: The soil erodibility factor ranges in value from 0.02 to
0.69 whenall factors remain constant.
Accordingly, Gilgel ghibe-1 catchment had moderate soil erodibility value with 0.35. Because they are moderately susceptible to detachment and they produce moderate runoff. Soils having high silt content are most erodible of all soils. They are easily detached; tend to crust and produce high rates of runoff. Values of soil erodibility for these soils tend to be greater than 0.4.
Conclusion and Recommendation
Soil erodibility is so complicated because many factors effects on spatial and temporal variability of soil losses. Soil texture, organic matter content, soil structure, and permeability were major soil properties that could influence the soil erodibility. The spatial soil erodibility map and value was an important contribution to the estimation of soil erosion from at Gilgel Ghibe-I catchment, as the K- factor was very crucial among the input factors used to estimate soil erosion. The effect of these factors in reducing erodibility of the soil is due to its role in creation of aggregates and their stability. Gilgel Ghibe-I catchment has shown Sandy clay loam (65%) dominating the catchment area followed by sandy loam (32%) which made soils of the catchment moderately erodible. Soil organic matter of the catchment was resulted greater than 2%. Permeability rate found slow to moderate covering 66% of the catchment area. And 78% of the catchment area was covered with medium or coarse granular soil structure. Gilgel Ghibe-I catchment has found K-values varying between 0.28 and 0.41 with a mean value of 0.35. It is therefore concluded that the soil of the catchment have poor permeability/ infiltration rate, high soil organic matter and high silt with coarse granular soil structure which leads to the occurrence of surface runoff during which fine soil particles are carried away; resulting with moderate soil erodibility of the catchment. Because of this, land management practice (bio-physical soil and water conservation measures and agronomic practices) is needed to reduce surface runoff and improve soil infiltration rate. Also secondary soil data adopted from large scale is needed to be validated with primary soil data before using it for further analysis [9,10].
References
- Goldman SJ, Jackson K, Bursztynsky TA (1986). Erosion and sediment control handbook. McGraw Hill Book Co, New York.
- Musa JJ, Anijofor SC, Obasa P JJ, Avwevuruvwe (2017). Effects of soil physical properties on erodibility and infiltration parameters of selected areas in Gidan kwano. Nigerian J Tech Res 12: 1-5.
[Crossref], [Google Scholar]
- Boardman J (2006) Soil Erosion Science: Reflection on the Limitations of Approach. Catena 68: 73-86.
[Crossref], [Google Scholar]
- Leonard J, Ancelin O, Ludwig B, G Richard (2006). Analysis of the dynamics of soil infiltrability of agricultural soils from continuous rainfall-runoff measurements on small plots. J of Hydrol 326: 122-134.
[Crossref], [Google Scholar]
- Lal R (1991) Soil Structure and Sustainability. J of Sustain Agri 1: 67-92.
[Crossref], [Google Scholar]
- Liu BY, Zhang KL, Jiao JY (1999) Soil erodibility and its use in soil erosion prediction model. J of Natl Res 14: 345-350.
[Crossref], [Google Scholar]
- Torri D, Poesen J, Borselli L, Knapen A (2006) Channel width flow discharge relationships for rills and gullies. Geomorphology 76: 273-279.
[Crossref], [Google Scholar]
- Salvador Sanchis MP, Torri D, Borselli L, Poesen J (2007) Climate effects on soil erodibility. Earth Surf Process Landf 33: 1082-1097.
[Crossref], [Google Scholar]
- Devi R, Subalewu T, Worku L, Bishaw L, Abebe B (2008) Assessment of siltation and nutrient enrichment of Gilgel Gibe dam, Southwest Ethiopia. Bio Res Tech 99: 975-979.
[Crossref], [Google Scholar]
- Adugna T, Saathoff F, Seleshi Y, Gebissa A (2013) Evaluating the Effectiveness of Best Management Practices in Gilgel Gibe Basin Watershed-Ethiopia. J Civil Eng Archite 7: 1240-1252.
[Crossref], [Google Scholar]
 Spanish
  Chinese
  Russian
  German
  French
  Japanese
  Portuguese
  Hindi
Hindi 