Spanish
  Chinese
  Russian
  German
  French
  Japanese
  Portuguese
  Hindi
Hindi Research Article, J Electr Eng Electron Technol Vol: 9 Issue: 4
Study of Reliability of Power Distribution System and Improvement Options at Awash7 kilo Substation, Ethiopia
Jemal Mohammed Amin1 and Getachew Biru Worku21 Department of Electrical and Computer Engineering, Samara University, Ethiopia
2 Department of Electrical and Computer Engineering, Adama Science and Technology University, Ethiopia
*Corresponding Author : Getachew Biru Worku (PhD)
Department of Electrical and
Computer Engineering, Adama Science and Technology University, Ethiopia
Received: 27 July, 2020 Accepted: 24 Aug, 2020 Published: 10 September, 2020
Citation: Jemal Mohammed Amin et al. (2020) Study of Reliability of Power Distribution System and Improvement Options at Awash7 kilo Substation, Ethiopia. J Electr Eng Electron Technol, 9:4
Abstract
This paper presents a study of reliability of power distribution system and improvement options at Awash7 kilo substation in Ethiopia. Basically, power distribution reliability has been a major challenge in Awash7 kilo city. The existing substation has encountered frequent and long power interruptions problems. The interruptions are caused mainly by the short circuit (SC) and earth fault (EF). There are also planned outages for operation and maintenance purpose. Thus, the objective of the study is to assess the reliability of the existing distribution system and suggest solutions for reliability improvement in heuristic techniques. To limit the scope of the study, 15 kV Awash7 kilo city feeder of the substation has been chosen for the reliability improvement measures. In the study, four different mitigation scenarios have been assessed using the heuristic method to improve the system reliability. From the mitigation scenarios with the lowest SAIDI, SAIFI and Expected Energy Not Supplied (EENS) has been selected as an optimal one. The simulation results have been done with the help of Electrical Transient Analysis Program (ETAP 16.0) software. The result of this study reveals that the overall reliability of Awash7 kilo city feeder has been improved by 86%, 85.4% and 92.94% for SAIFI, SAIDI, and EENS respectively as compared with the existing system by incorporating a mitigation technology in to the network model. The economic analysis shows that the selected solution results in a cost saving of 20,229.47 USD per year from the unsold energy of one feeder only with three years payback period investment for the implementation of the reliability mitigation technology.
Keywords: Distribution System, Power Reliability, Reliability Indices, ETAP Software, SAIFI, SAIDI
Introduction
The electric power system is basically set up to supply electricity with little or no interruptions to its customers. Nowadays, Ethiopian Electric Utility (EEU) Power system has 400 kV, 230 kV, 132 kV primary transmission systems and 66 kV, 45 kV as sub-transmission system and 33 kV and 15 kV as a distribution system. Awash7 kilo substation receives electric power from Koka power plant at 132 kV from the interconnected system (ICS). The 132 kV transmission line is stepped dawn to 66 kV/15 kV with two parallel connected transformers as shown in Figure1. The distribution system in the city has a primary voltage of 15 kV and stepped down further to 400/220V to supply the various consumer loads [1]. The network topology of Awash7 kilo substation is radial. Awash7 kilo substation consists of five outgoing feeders. The nominal voltages of the three feeders are 15 kV and the remaining two feeders are 66 kV. As per the data found from the south-east region billing office, the south-east region has a total of 9,823 customers and out of which, 4,819 customers are living in Awash7. From the outgoing feeders, 15 kV feeder city line is serving customers found in the center of the city and is extended to Argoba Wereda and Awash Park, which are located at 35 km away from the Awash7 kilo substation. Commercial businesses like hotels, small and micro industries, banks, most administrative offices, telecommunication center, schools and a large number of residential customers get electricity from this feeder. City line is represented by L1 as depicted in Figure 1.
Substation Collected Data and Analysis
This part briefly deals with the methodologies used for data collection and data analysis for the existing system. Reliability analysis needs data on interruption duration, interruption frequency, a total number of customers served, customers interrupted, loads connected and so on. So, under this section, the collected failure data and basic electrical data of power system equipment which are necessary for reliability analysis are presented. These data are used to analyze the current reliability status of the substation and to distinguish the main problems of interruption. Primary data have been collected from the Ethiopia Electric Utility (EEU) of Awash7 kilo.
Table 1. Shows the basic data for the 15 KV feeders (bus bar 2) and 66 KV feeders (bus bar 3). L1, L2 and L3 represent the outgoing feeder lines from 15 KV bus bar and K1 and K2 represent the outgoing feeder lines from 66 KV bus bar. The total number of distribution transformers connected to the substation is 76 with a total rating of 16.36 MVA. Out of this, Awash7 kilo city has a total of 34 distribution transformers with a total capacity 9.9 MVA connected to feeder L1 and L2.
| Feeder Name | Total No of Distribution Transformer | No of Customers | Total capacities of Distribution Transformer (KVA) | Total Length of Feeders (km) |
|---|---|---|---|---|
| Awash7 city L1 | 26 | 4,819 | 4555 | 35 |
| Awash7 Factory L2 | 8 | 8 | 5345 | 0.6 |
| Awash 40 L3 | 22 | 2,242 | 3450 | 10 |
| Amibara K1 | 10 | 1,405 | 1680 | 18 |
| Nurara K2 | 12 | 1,349 | 1330 | 16 |
| Total | 76 | 9,823 | 16360 | 79.6 |
Table 1:Summarized data for Awash7 kilo substation feeders [4]
Table 2, shows the frequency interruption due to non-momentary (unplanned) and planned interruptions in the existing Awash7 substation system from 2015/2016 G.C to 2017/2018 G.C. [4]
| Feeder | 2015/2016 G.C |
2016/2017 G.C | 2017/2018 G.C | ||||||
|---|---|---|---|---|---|---|---|---|---|
| Unplanned | Planned | Total | Unplanned | Planned | Total | Unplanned | Planned | Total | |
| L1 | 198 | 183 | 381 | 245 | 165 | 410 | 288 | 163 | 451 |
| L2 | 125 | 78 | 203 | 98 | 128 | 226 | 130 | 95 | 225 |
| L3 | 285 | 165 | 450 | 191 | 108 | 299 | 270 | 115 | 385 |
| K1 | 213 | 155 | 368 | 245 | 125 | 370 | 188 | 175 | 363 |
| K2 | 182 | 155 | 337 | 141 | 128 | 269 | 158 | 112 | 270 |
| Total | 1,003 | 736 | 1,739 | 920 | 654 | 1,574 | 1,034 | 660 | 1,694 |
Table 2: Frequency Interruptions from 2015/16 G.C to 2017/18 G.C. [4]
Table 3 shows the dur ation of interruptions due to non-momentary (unplanned) and planned interruptions in the existing Awash7 substation system from 2015/2016 G.C to 2017/2018 G.C. [4]
| Feeder | 2015/2016 G.C |
2016/2017 G.C | 2017/2018 G.C | ||||||
|---|---|---|---|---|---|---|---|---|---|
| Unplanned | Planned | Total | Unplanned | Planned | Total | Unplanned | Planned | Total | |
| L1 | 171 | 141 | 312 | 181 | 127 | 308 | 187 | 152 | 339 |
| L2 | 18 | 65 | 83 | 62 | 73 | 135 | 31 | 84 | 115 |
| L3 | 168 | 82 | 250 | 132 | 112 | 244 | 128 | 110 | 238 |
| K1 | 105 | 110 | 215 | 176 | 79 | 255 | 105 | 89 | 194 |
| K2 | 128 | 145 | 273 | 87 | 168 | 255 | 153 | 102 | 255 |
| Total | 590 | 543 | 1,133 | 638 | 559 | 1,197 | 604 | 535 | 1,141 |
Table 3: Duration Interruptions from 2015/16 G.C to 2017/18 G.C
Table 4 shows annual av erage frequency and duration of interruptions from 2015/2016 G.C to 2017/2018 G.C.
| Feeder | Frequency Interruption (Int/year) 2015/16 to 2017/18 G.C |
Duration Interruption (Hour/year) 2015/16 to 2017/18 G.C |
||||
|---|---|---|---|---|---|---|
| Unplanned | Planned | Total | Unplanned | Planned | Total | |
| L1 | 243.67 | 170.3 | 413.97 | 179.67 | 140 | 319.67 |
| L2 | 117.67 | 100.3 | 217.97 | 37 | 74 | 111 |
| L3 | 248.7 | 129.3 | 378 | 142.7 | 101.3 | 244 |
| K1 | 215.33 | 151.67 | 367 | 128.7 | 92.67 | 221.37 |
| K2 | 160.33 | 131.67 | 292 | 122.7 | 138.3 | 261 |
| Total | 985.7 | 683.24 | 1,668.94 | 610.77 | 546.27 | 1,157.04 |
Table 4: Average frequency of interruptions and average duration of interruptions
According to the da ta collected from Awash7 kilo substation, the causes of faults include Distribution Permanent Earth Fault (DPEF), Distribution Permanent Short Circuit (DPSC), Distribution Temporary Earth Fault (DTEF) and Distribution Temporary Short Circuit (DTSC). Table 5 and Table 6 shows percentage ratings of the fault types in terms of interruption duration and interruption frequency; whereas o Other faults includes overload, blackout (total loss of power to an area), under frequency, transmission line fault etc
| Causes | DPEF | DPSC | DTEF | DTSC | Operational | Others |
|---|---|---|---|---|---|---|
| Percentage of interruption types | 10% | 17% | 9% | 10% | 47% | 7% |
Table 5: Percentage average interruption duration of each type of fault
| Causes | DPEF | DPSC | DTEF | DTSC | Operational | Others |
|---|---|---|---|---|---|---|
| Percentage of interruption types | 13% | 15% | 19% | 6% | 41% | 6% |
Table 6: Percentage of each type of fault in terms of interruption frequency
Table 5 shows that 4 7% (Hr.) of the interruption duration of the overall system are due the operation and maintenance, 17% is due to distribution permanent short circuit, 10% is due to a distribution permanent earth fault, and the remaining other faults account for around 7% (power transformer overloading, transmission line fault, etc.).
Table 6 shows that 41% of the interruption frequency is due the operation and maintenance, and 19% are due to a distribution temporary earth fault, 15% is due to distribution permanent short circuit, 6% is due to others (power transformer overload, transmission line fault, etc).
Table 7 shows the annual average energy and power consumption of each feeder bus bar. The annual average energy is calculated using the recorded data from 2015/16 -2017/18 G.C.
| Feeder Name | Average apparent power consum. (MVA) | Average Power Consumption | Average Energy Consumption | ||
|---|---|---|---|---|---|
| Average Active Power (MW) | Average Reactive Power (MVAr) | Average Active Energy (kWh) | Average Reactive Energy (kVArh) | ||
| Awash7 city L1 |
3.06 | 2.448 | 1.7748 | 21,444,480 | 15,547,248 |
| Awash7 Factory L2 | 3.42 | 2.736 | 1.9836 | 23,967,360 | 17,376,336 |
| Awash40 L3 |
1.48 | 1.184 | 0.8584 | 10,371,840 | 7,519,584 |
| Amibara K1 | 0.58 | 0.464 | 0.3364 | 4,064,640 | 2,946,864 |
| Nurara K2 | 0.42 | 0.336 | 0.2436 | 2,943,360 | 2,133,936 |
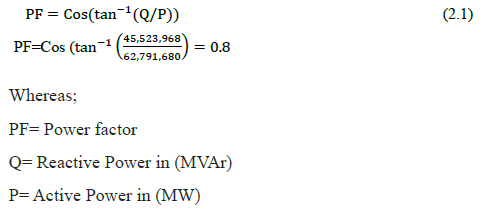
| Total | 8.96 | 7.168 | 5.1968 | 62,791,680 | 45,523,968 |
Table 7: Annual average energy and power consumption of each feeder [4]
Based on Table 7, the average power factor (PF) of the substation can be calculated as;
Distribution Reliability Indices Calculation
Most reliability indices are average values of a specific reliability characteristic of an entire system, operating region, or feeder. The indices for the power distribution system analysis include customeroriented indices and energy-oriented indices as defined in IEEE standard 1366-2012 [2].
Customer Oriented Indices
1. System Average Interruption Frequency Index (SAIFI): The index represents the average number of sustained interruptions experienced by a customer in a unit time (generally one year) [2].
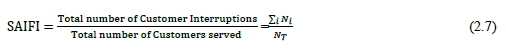
Where Ni is the number of interrupted customers for each interruption event, i during the reporting period, NT is the total number of customers served in the area or on the feeder.
2. System Average Interruption Duration Index (SAIDI): The index indicates the average time a customer has an interruption during a time cycle (one year) [2].
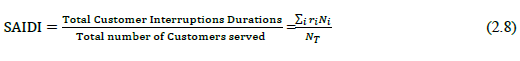
Where ri is the outage time.
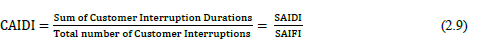
3. Customer Average Interruption Duration Index (CAIDI): It is determined by dividing the sum of all customer interruption duration by the number of customers experiencing one or more interruptions over a one year period. The index is the ratio of SAIDI to SAIFI as given in Equations (2.9). It represents the average time taken to restore service to the customers [2].
4. Customer Average Interruption Frequency Index (CAIFI): Customer average interruption frequency index (CAIFI) gives the average frequency of sustained interruptions for those customers experiencing interruptions as given in equation (2.10) [2].

Where Ni is the total number of customer interruption, Cn is the total number of customers facing an interruption during the reporting period.
5. Average Service Availability Index (ASAI): The average service availability index (ASAI) gives the fraction of time the customer has power during the reporting time. Higher ASAI values reflect higher levels of reliability. Equation (2.11) is used to calculate the value of ASAI for a given service area [2].

Where Ni is the total number of customer interruption, Nt is the total number of customers served and ri is the restoration time for each interruption event i.
6. Average Service Unavailability Index (ASUI): This index is the complementary value of the average service availability index (ASAI) [2].
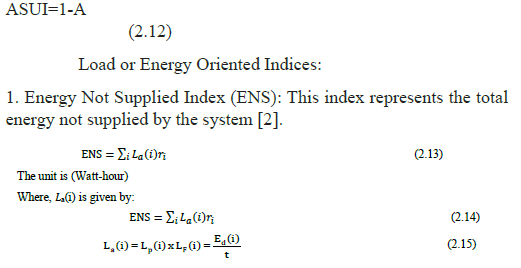
W here, Lp(i) is a peak load demand,
Lf(i) is the load factor and
Ed(i) is the total energy demanded in the period of interest t.
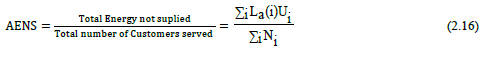
2. Average Energy is Not Supplied (AENS): This index represents the average energy not supplied by the system [2].
T he reliability indices of the Awash7 kilo city feeder can be calculated using equations (2.7) to (2.15). The following substation input data’s are taken in order to calculate the existing reliability indices.
The utility cost for the utility during the outage is calculated as:
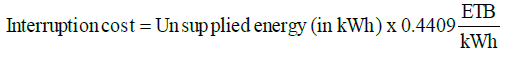
Table 8: Calculated reliability indices of Awash7 kilo city feeder for year 2015/16-2017/18 G.C
| Feeder Name | Reliability Indices | 2015/16 G.C | 2016/17 G.C | 2017/18 G.C | Average |
|---|---|---|---|---|---|
| Awash7 kilo City Feeder line, L1 | SAIFI | 381 | 410 | 451 | 414.0 |
| SAIDI | 312 | 308 | 339 | 319.67 | |
| CAIDI | 0.819 | 0.751 | 0.752 | 0.772 | |
| ASAI | 0.964 | 0.965 | 0.961 | 0.963 | |
| ASUI | 0.036 | 0.035 | 0.039 | 0.037 | |
| EENS | 763.776 | 753.984 | 829.872 | 782.552 | |
| AENS | 0.158 | 0.156 | 0.172 | 0.162 |
Table 8: Calculated reliability indices of Awash7 kilo city feeder for year 2015/16-2017/18 G.C
T he utility cost for the utility during the outage is calculated as:

Whereas, the tariff 0.4409 is taken from the average of the first block tariffs of residential and commercial customers, which most Ethiopian electricity customers are assumed to be grouped [3]. For Awash7 kilo city feeder (L1), 763.8 MWh energy was unsupplied in the year 2015/16 as indicated in Table 6. Thus, the interruption cost is =763.8 kWh x1000 x0.4409 ETB/ kWh=336,748.8 ETB. Based on the exchange rate of the Commercial Bank of Ethiopia (CBE) on 05-May-2018, (l $= 27.5151 ETB), the interruption cost in USD becomes 12,238.69. By the same procedure the interruption cost for the 3 years, that is, from 2015/16 to 2017/18 G.C is calculated and summarized in Table 9.
| Years | EENS (MWh) | Interruption Cost (ETB) | Interruption Cost (USD) |
|---|---|---|---|
| 2015/2016 G.C | 763.776 | 336,748.83 | 12,238.69 |
| 2016/2017 G.C | 753.984 | 332,431.54 | 12,081.79 |
| 2017/2018 G.C | 1358 | 598,742.2 | 21,760.5 |
| Max. | 1358 | 598,742.2 | 21,760.5 |
Table 9: Summary of estimated interruption cost from 2015/16 to 2017/18 G.C
Based on the data analysis, the following conclusion can be drawn.
• The power reliability of the Awash7 kilo city feeder line, L1 does not meet the requirements set by the Ethiopian Electric Agency (EEA) and the international reliability indices of other benchmarked countries.
Evaluation of Reliability Improvement Techniques
This part presents the explanation of the modeling and simulation of the existing system with different mitigation alternative scenarios to improve the system reliability of the Awash7 kilo city feeder line at a reasonable cost. The simulation focuses on evaluating the impact of using reclosers and reconfiguration of the feeder on the reliability of the system.
Scenario- 1: Using one Recloser: A Recloser R1 has been placed on the major feeder (SL19) as shown in figure 2. Input quantities like power rating of the load, number of customers, feeder length, failure rate and repair rate are entered in the ETAP software as input. The interruption data of years from 2015/16 to 2017/18 G.C are used as a base year.
Table 10 is the screenshot for the simulation with one Recloser in the feeder. As can be seen from the result of the simulation, the expected number of outages per year has been reduced from 414.0 to 234.0 (43.47% reduction), the annual outage duration has been reduced from 319.7 to 229.6 hours (28.2% reduction) as compared with the existing system through the additional Recloser in the main feeder. In this case, the reliability of Awash7 city feeder is improved by 43.47%, 28.2% and 59.2% for SAIFI, SAIDI and EENS respectively.

Table 10: Legend
Scenario- 2: Using two Reclosers on the feeders: In this particular Scenario, the effect of using two Reclosers on the feeders has been presented in figure 3. One of the two Reclosers has been placed on the major feeder (SL19) as revealed in Scenario-1, and second Recloser (R2) has been placed in the existing Awash7 kilo city to Argoba Wereda line (SL30) which is 15 Km far away from the substation and with serious power reliability problem.
Table 11 shows the reliability improvement of using two Reclosers in the feeders. As can be seen from Table 11, the two Reclosers significantly improve the reliability of the system. The expected number of outages per year has been reduced from 414 to 187.0951 (54.81% SAIFI has been improved), and the annual outage duration has been reduced from 319.67 to 170.8294 hours (46.56% SAIDI and 69.6% EENS) has been improved as compared to base years’ average.

Table 11: Legend
Scenario-3, System Reconfiguration using Tie-switch: In this Scenario, Awash7 kilo city feeder is reconfigured with diesel generator using normally open tie-switch as shown in figure 4. The tie-switch paves the way to transfer the load from the Awash7 city feeder to the existing diesel generator in case of power outage on the supply of the city. The diesel generator is intended for emergency cases (in case of the power outage of Awash7 city feeder line). The capacity of Awash7 diesel generator substation is assumed to be 15% (5.3/35*100%=15%) of the peak demand of the Awash7 city.
In Scenario-3, as shown clearly in Table 12, the expected number of outages per year is reduced from 414.00 to 115.32 (72.14% SAIFI improvement). And also the annual outage duration has been reduced from 319.67 hours to 87.5822 hours (72.6% SAIDI) and EENS has been improved by 84.35% compared to base-data.

Table 12: Legend
Scenario-4, Using two Recloser, Tie-Switch and Isolated Argoba Woreda line In Scenario-4, two Recloser and a normally open tie switch, that connects the diesel generator to the load during power outage are included in the model. Recloser (Rec-1) is placed at Awash7 kilo substation city feeder line side and Recloser (Rec2) is placed at the Awash7 diesel generator substation. In this scenario, as clearly shown in Figure 5, the long line running to Argoba woreda has been permanently isolated from the existing city feeder at the exit of the Awash7 kilo city. The two substation circuit breakers of Awash7 kilo substation (CB-0) and Awash7 kilo diesel substation (CB-01) and the normally open tie switch have been coordinated and interlocked together.
In scenario-4, the 15 kV power line which goes to Argoba woreda is isolated from the existing system of Awash7 city feeder line and being replaced with separate 66 kV power line. Isolating Argoba line from Awash7 city feeder line has a significant advantage on increasing the reliability of the feeder on Awash7 city. With the emergence of small villages around and increment of electricity demand, replacing the 15 kV by 66 kV may help to solve the reliability problems in the Argoba woreda. For long distances, the power transfer capability of the 66 kV power line is better than 15 KV power lines. Argoba woreda Line, which consists of currently four transformers (2 with 315 kVA and 2 with 200 kVA ratings) and covers about 15 km outside of Awash7 city, should connect to the Amibara 66 kV feeder line. The Amibara 66 KV line is one of the two outgoing 66 kV lines from Awash7 Kilo substation. Its capacity is 4.0 MW, but the actual peak load of the feeder is 2.0 MW, which is only about 50% of its capacity.
As can be seen from Table 13, the two Reclosers together with the tie switch helped to enhance significantly the reliability of the system. The expected number of outages per year per customer has been reduced from 414.0 to 58.0 (86% SAIFI has been improved), and the annual outage duration has been reduced from 319.67 to 46.68 hours (86.4% SAIDI and 92.94% EENS) have been improved as compared with the selected base years.

Table 13: Legend
F rom Table 14, it can be concluded that from the scenarios studied, the most optimal alternative for improving the power reliability of the study area was installing two Reclosers with tie switch at critically selected locations and permanently isolating the long which goes to Argoba woreda from the Awash7 city feeder (Scenario-4). Table 15, indicate that the summary of the result of energy oriented reliability indices.
| Customer Oriented Reliability Indices | Scenarios | ||||
|---|---|---|---|---|---|
| Existing System | Scenario-1 | Scenario-2 | Scenario-3 | Scenario-4 | |
| SAIFI (f/customer/yr) | 414.0 | 234.00 | 187.1 | 115.32 | 58.00 |
| SAIDI (hr/customer/yr) | 319.67 | 229.61 | 170.8 | 87.58 | 46.68 |
| CAIDI (hr/customer/Int.) | 0.772 | 0.98 | 0.913 | 0.759 | 0.805 |
| ASAI (Pu) | 0.963 | 0.9738 | 0.9805 | 0.9900 | 0.994 |
| ASUI (Pu) | 0.037 | 0.02621 | 0.01950 | 0.0100 | 0.00533 |
| % Reduction in SAIFI | 0 | 43.47% | 54.81% | 72.14% | 86.0% |
| % Reduction in SAIDI | 0 | 28.2% | 46.56% | 72.6% | 86.4% |
Table 14: Summary of the results of reliability improvement for all Scenarios
| Energy-Oriented Reliability Indices | Scenarios | ||||
|---|---|---|---|---|---|
| Existing System | Scenario-1 | Scenario-2 | Scenario-3 | Scenario-4 | |
| EENS (MWhr/yr) | 1358.4 | 554.470 | 412.657 | 212.657 | 95.946 |
| ECOST (USD/yr) | 21,766.9 | 8,884.788 | 6,612.386 | 3,407.601 | 1,537.432 |
| % Reduction in EENS | 0 | 59.18% | 69.62% | 84.35% | 92.94% |
| % Reduction in ECOST | 0 | 59.18% | 69.62% | 84.35% | 92.94% |
Table 15: Summary of the result of energy oriented reliability indices
Conclusions
The study clearly has shown that the reliability of Awash7 kilo city feeder does not meet the requirements set by the Ethiopia Electric Agency (EEA). The average frequency of interruptions is 414.0 interruptions per customer per year (SAIFI) and also the average duration of the interruption is 319.67 hours per customer per year (SAIDI) for the city. This shows that there is huge unsupplied energy due to planned and unplanned outages. The average unsupplied energy is 1,358.4 MWh per year. This results in a loss of around 21,766.89 USD per year due to the power outage of the distribution substation.
By implementing the reclosers and replacing the city line and Argoba line by two separate feeders (Scenario-4) the overall reliability of the Awash7 kilo city feeder is improved by 86%, 85.4% and 92.94% in terms of SAIFI, SAIDI and EENS respectively. The proposed solution has the potential to save around 20,229.47 USD per year only from the unsold energy of the city feeder. The payback period for the investment will become 3 years for the proposed technology for improve the reliability to that level.
Acknowledgement
The author’s great fully acknowledge the intake of the case study this research and the research park of Adama Science and Technology University of Ethiopia.
Conflict of interest
The authors declare that there is no conflict of interest for the publication of this article.
References
- G.C Dumakude, AG Swanson and Stephen (2015) Evaluation of Smart Technology for the improvement of Reliability in a Power Distribution System,” Presented at South Africa Universities Power Engineering Conference (SAUPEC), Johannesburg, South Africa.
- IEEE Guide for Electric Power Distribution Reliability indices, IEEE Std. 1366TM-2012, 31 May, 2012.
- Tesfaye Gebreegziabher, “Study on Smart Grid system for improvement of Power Reliability of the Distribution system,” MSc Thesis, Submitted to Addis Ababa University, 173 pp, Addis Ababa, Ethiopia, October 2014.
- Facts in Brief.EEP. Retrieved4 April2018.
- ETAP Software Version 12.6. m