Spanish
  Chinese
  Russian
  German
  French
  Japanese
  Portuguese
  Hindi
Hindi Research Article, J Comput Eng Inf Technol Vol: 11 Issue: 5
A Data Analytics-based Approach for Quantitative Exploration of the Relationship between Engineering Programs Majors and Educational Objectives
Anwar Ali Yahya*
Department of Computer Science, University of Najran, Najran, Saudi Arabia
*Corresponding Author: Anwar Ali Yahya, Department of Computer Science, University of Najran, Najran, Saudi Arabia, E-mail: aaaesmail@nu.edu.sa
Received date: 28 April, 2022, Manuscript No. JCEIT-22-62100;
Editor assigned date: 30 April, 2022, PreQC No. JCEIT-22-62100(PQ);
Reviewed date: 10 May, 2022, QC No JCEIT-22-62100;
Revised date: 18 May, 2022, Manuscript No. JCEIT-22-62100(R);
Published date: 25 May, 2022, DOI:10.4172/jceit.1000224.
Citation: Ali Yahya A. (2022) A Data Analytics-based Approach for Quantitative Exploration of the Relationship between Engineering Programs’ Majors and Educational Objectives. J Comput Eng Inf Technol 11:5.
Abstract
In outcome-based education, Program Education Objects (PEOs) are essential components around which all program’s activities are centered. They represent graduates professional and career accomplishments within few years of graduation. In this paper, the relationship between the academic majors and PEOs of engineering programs is questioned and a data analytics-based approach to answer this question is proposed. More specifically, this paper applies three wellknown data correlation measures, namely pointwise mutual information, correlation coefficient and odds ratio, to a PEOs dataset extracted from the self-study reports of a set of engineering programs. The PEOs dataset has been linguistically pre-processed through cleaning, annotation using a set of PEOs labels and projection to break down each multi-PEOs label data instance into several single PEOs data instances. After that, the three measures are applied to measure the relationship between Programs’ Majors (PMs) and PEOs. The obtained results are then ranked based on PMsPEOs correlation strength and the agreement analysis among the three measures show a remarkable consistency among them in their evaluation of the relationship between PMs and PEOs. Finally, the overall ranking of PEOs within each PM, computed as a majority vote of the ranking of the three measures, show that each PM has a unique pattern of ranked PEOs. This suggests that the nature of PM plays a key role in determining the PM-PEOs relationship pattern. The obtained PMsPEOs quantitative correlations are very beneficial to the academicians particularly when designing new programs or reviewing existing ones.
Keywords: Educational data analytics; Learning analytics; Program educational objectives, Outcome-based education
Introduction
In the past century, the ability of education systems to prepare graduates with the necessary professional and career skills required for the new millennium was questioned. Consequently, a more effective system, that focus on the actual and potential abilities of the students after graduation, had become an imperious need. In response to this need, several reformation attempts to the conventional education systems have emerged since 1950, and the Outcome Based Education (OBE) is the most prominent among them. As mentioned by Spady, a prime mover in the OBD development, to have an OBE system, it is required to identify a clear set of learning outcomes, around which all the system components are centered, and establish the conditions and opportunities to enable all students to achieve those outcomes. Practically speaking, the OBE approach is realized in tertiary education through developing three types of outcomes: Program Educational Objectives (PEOs), Program Outcomes (POs), and Course Outcomes (COs). While PEOs describe, in a broad sense, the career and professional accomplishments that a program is preparing graduates to achieve, POs are narrower statements that describe the skills, knowledge and behaviours, those students are expected to know and be able to do by the time of graduation. Similarly, COs are statements that describe knowledge, skills, attitudes, and behavior, expected from student as they take the course [1]. (Figure 1) illustrates how these three main components are correlated. (Figure 1)

Figure 1: Correlation between PEOs, PLOs, and CLOs [5].
As depicted in (Figure 1) the pyramid structure of an academic program, PEOs represent the program’s broad vision that drives the overall processes. They form a connection point at which the programmatic issues curriculum, faculty, facilities are considered within the largest context of the needs of key constituencies and the mission of the institution [2]. Thus, providing a key connection point for assessing the program. In a broader sense, PEOs have an important role in encouraging the continuous improvement of a program and providing it an opportunity to define its continuous improvement means. Although the concept of PEOs plays a key role in guiding academic programs activities, the literature, however, has given it a very little consideration. This partially attributed to the fact that program faculty members are much more inclined to deal with familiar issues of faculty, facilities and financing than with institutional missions and needs of program constituencies. Furthermore, a little is provided by the accreditation bodies, such as ABET, as guidelines on what should be included in the PEO and the processes of generating and assessing them. Recently, educational data analytics has emerged as an effective tool for a wide range of purposes in tertiary education, to enhance the learning process, evaluate efficiency, improve feedback, enrich the learning experience, and support decision making. In fact, the vast amount of accumulated educational data has created a gold mine that can be leveraged to draw useful knowledge and insights by means of educational data analytics [3]. Given the aforementioned lack of knowledge and guidelines on the PEOs and the marked successful applications of educational data analytics in tackling educational problems, this paper proposes the application of data analytics to discover insights on a particular aspect of PEOs, that’s their relationship to the academic program’s major. As a case study, this paper investigates the relationship between the academic majors and PEOs of engineering programs and for this sake, a dataset of PEOs of a number of ABET accredited engineering programs has been collected, prepared and three data correlation measures are applied to measure the relationship between Programs’ Majors (PMs) and PEOs. The discovered relationships are valuable and actionable to the decision-makers while designing and reviewing their programs. The remainder of this paper reviews the related works, describes the methodology, presents and discusses the obtained results.
Related Works
In the current information technology age, the constant growth of information and communication operations has become the major driver of transformations in education. Every day, enormous data are generated from the daily operations of educational systems, e.g. learning management systems. Consequently, vast amount of data is becoming available for collecting and mining and, thus, a need for more robust and effective data analytics tools in the learning and teaching environments has heightened [4].
Over the previous few decades, the fast advances in data and analytics fields have contributed significantly to the increased interest in educational data analytics. This, in turn, has led to the emergence of new disciplines, namely, learning analytics, academic analytics and educational data mining. While the focus of LA is on the application of data analytics to understand and enhance learning and teaching, AA focuses on supporting institutional operations and decision making. EDM, on the other hand, aims to develop and evaluate data analytics methods for exploring educational data. In the literature, several attempts have been made to draw a distinction between LA, AA, and EDM. Based on the level or object of analytics and the beneficial stakeholders, a distinction between LA and AA is given in as follows: While LA targets the micro and macro levels of educational stakeholders, AA benefits the stakeholders placed higher in the hierarchy macro institution and mega governance levels. Similarly, a distinction between LA and EDM is given in as follows LA focuses more attention on the learning process and interactions within the learning environment, whereas EDM focuses on methods and approaches for the data pipeline [5].
Generally speaking, the data analytics can be applied at very different levels: course, departmental, institutional, regional, and national, international. As pointed out above, the first two levels are the usual focus of LA, while the remaining three are usually the focus of AA. Moreover, most of the previous LA research deal only with the first level and very little LA research on analyzing educational data at program level. Therefore, the literature is ample regarding the works of analyzing the behavior and interaction of students and faculty as part of a course yet scarce regarding the works of analyzing educational data at program level [6].
As the current work is concerned with the applications of educational data analytics at program level, the following is a brief survey of the previous works at this level. A combination of neural networks and experts’ prior knowledge is applied in to predict and evaluate student’s learning outcomes of an academic program and ultimately enhance teaching quality. K-means clustering algorithm is applied in to investigate the relationship between skills taught in business programs and the title of the program using a dataset extracted from the program catalogue. With very limited exceptions, the obtained results indicate a matching between the labels of programs and the taught skills. Data analytics methods are used in to identify the similarities between course content at a learning object, module, and program level. A graph mining methodology is used in to analyze the relationships among academic programs from the point of view of cooperative education. A dataset consisting of student–job interview pairs is used to build a weighted directed graph, on which many analyses are carried out finding communities, finding vertices connected to many communities and finding vertices strongly connected to their neighbours. The applications of data analytics to analyze academic program assessment data can be found in in which a data-driven course assessment and program assessment is applied to quantify the level to which program curriculum meets the program outcomes [7].
Moreover, as the domain of the current work is engineering academic programs, the following are reported works of applying educational data analytics to analyze engineering programs data. Text mining methods are applied in to analyze gender differences in engineering faculty of a large North American university. More specifically syntactic and semantic analysis methods are used to highlight differences in motivation, interests, and background. Three main findings are first, female demonstrate a wider breadth of experience, whereas male put a greater emphasis on technical depth. Second, more female demonstrate a greater desire to serve society. Third, females are more likely to mention personal influence for studying engineering. Regression and classification techniques are used in to investigate the effect of academic program type, between other like years of study and gender, on the mental health of students. The dataset, survey responses of undergraduate students of engineering programs at a large Canadian University, is analyzed. Interestingly, the results show that the more competitive a program, the lower mental health. Moreover, stronger classmate relationships and flexible curriculum lead to higher mental health scores. In a data analytic approach to analyze graduate attributes in Engineering is presented. More specifically, the additive factor model is applied to analyze the Q‐matrix corresponding to the assessment maps used in the graduate assessment process [8]. The results of 17 volunteering anonymous students completing 36 courses at the University de Moncton between 2010 and 2015 semesters were analyzed and the results obtained provided interesting and useful information regarding the assessment map and the overall assessment process. Classification and regression trees are used in to draw an educational roadmap to helps advisors and students in engineering programs to be aware of the turning points that decisively affect their overall cumulative grade point average. The classification and regression trees are applied to a dataset of 1,100 students already graduated from the electrical and computer and communication engineering, where nodes and branches denote the turning point courses and students performance, respectively, with the ultimate outcome being the overall student’s GPA upon graduation [9].
The importance of using student data to drive improvement in education planning is highlighted. Techniques of extracting knowledge from institution databases such as large arrays of student data are presented along with a case study of using neuro-fuzzy classification to predict and classify students’ academic achievement in an electrical engineering faculty of a Malaysian public university. In an application of machine learning and data mining to student performance data in an undergraduate electrical engineering program is presented. Data from learning management system and other available sources are used to predict several outcomes for individuals such as when a student is beginning to have trouble with the material or if factors outside of the classroom are affecting their success. The results are useful to academic advisors, to determine class schedules that promote success in the program and to students, to take a proactive approach to their learning [10].
As a continuation of the research of applying LA to analyze the data at program level, this works applies educational data analytics to quantitatively analyze the relationship between the academic programs’ majors and educational objectives in engineering discipline.
Methodology
In this section, the methodology that is followed in this research is described. It is a specific version of the general procedure used in knowledge discovery from data. As demonstrated in (Figure 2), it involves raw data collection, data selection, data pre-processing, correlations measuring and correlations evaluation. (Figure 2)

Figure 2: Research Methodology
A. Raw data collection
In this step, the raw data is collected from a suitable data source. As the objective of this research is to measure the relationship between PMs and PEOs, Program Self Study Report (SSR) is a suitable source from which raw data of PMs and their corresponding PEOs can be extracted. In case of ABET-accredited engineering programs, the PEOs data can be extracted from subsection B of the second criterion (Program Educational objectives) of SSRs. The PMsPEOs dataset of this research has been extracted from 215 SSRs of Engineering programs, each of which has been accredited by ABET-EAC, between 2000 and 2018. (Figure 3) shows the distribution of these reports over the years. (Figure 3)

Figure 3: Self-study reports distribution over the years
The extracted PMs and PEOs data have been consolidated into table and (Table 1) shows examples from PMsPEOs dataset. (Table 1). Moreover, Table 2 shows the main statistical aspects of the PMs-PEOs dataset. (Table 2)
| PM | PEO |
|---|---|
| Civil | Practice the disciplines oftransportation, environmental, structural, water resources, and geotechnicalengineering, and/or related fields. |
| Chemical | Engage in higher education, research,and development. |
| Industrial | Pursue continuing education andprofessional licensure |
| Civil | Act in a responsible, professional,and ethical manner |
Table 1: Examples from PMs-PEOs Dataset.
| Statistical Aspect | Value |
|---|---|
| No. of PEOs | 937 |
| No. of PMs | 14 |
| Max. No. of PEOs in a program | 17 |
| Min. No. of PEOs in a program | 2 |
| Avg. No. of PEOs in a program | 4.39 |
Table 2: Statistical Aspects of PMs-PEOs Dataset.
B. Data pre-processing
In this step, the extracted PMs-PEOs data is pre-processed through cleaning, annotation and projection, to obtain consistent data. The data cleaning involves substantial verification and validation of the content, attempts to remove spurious or duplicated objectives. The annotation involves replacing each PEO text with labels representing the graduate’s attributes expressed in its text. For this purpose, a set of PEOs labels is identified. Typical PEOs cover the followings attributes: technical skills, professional, ethical, communication aspects, management and leadership, lifelong learning and continuous education, advanced and graduate studies pursuing, and other aspects. Based on PEOs wordings of a number of engineering programs, the following set of PEOs labels, shown in (Table 3), have been identified. The identified PEOs labels set is then used to annotate data instances with a single or multiple PEOs, and then each multi-label data instance is projected into single-label data instances. (Table 3)
| No | PEOsCategory | PEOLabel |
|---|---|---|
| 1 | Life-long Learning | LL |
| 2 | Communication | C |
| 3 | Leadership | LL |
| 4 | Teaming | T |
| 5 | Ethical Conduct | EC |
| 6 | Professionalism | P |
| 7 | Social and Community | SC |
| 8 | Career Success | CS |
| 9 | Technical Competency | TC |
| 10 | Knowledge Competency | KC |
| 11 | Graduate Studies | GS |
| 12 | Others | O |
Table 3: PEOs Label Set.
The annotation of the PMs-PEOs dataset using the PEOs labels has been accomplished by three annotators who initially annotated the data set individually using the PEOs label set. The three annotators then met to resolve the conflicting cases of PEOs annotation. Table 4 shows examples of the dataset after PEOs annotation. (Table 4)
| PM | PEOs |
|---|---|
| Civil | TC |
| Chemical | LL GS |
| Industrial | LL P |
| Civil | EC |
Table 4: PExamples from PMs-PEOs Dataset.
In the data projection step, each multi-label data instance is broken down into single-label data instances, where each one is annotated with a single PEO of those in the original data instance. The results of this step are an enlarged dataset with 1494 single-label data instances. Fig. 4 and Fig. 5 shows the distribution of PMs and PEOs respectively. (Figure 4 and 5)

Figure 4: PMs Distribution

Figure 5: PEOs Distribution
C. PMs-PEOs relationship measuring
In this step, data correlation measures, namely Pointwise Mutual Information (PMI), Correlation Coefficient (CC) and Odds Ratio (OR), are applied. Each of these measures is a function of the following four dependency tuples:
• (x,y): Co-presence of x and y.
• (x,ȳ): The presence of x in the absence of y.
• (x̄,y): The absence of x in the presence of y.
• (x̄,): co-absence of x and y.
The frequencies of the four tuples in the collection are denoted by A; B; C and D respectively. The first and last tuples represent the positive dependence between x and y, while the other two represent the negative dependence.
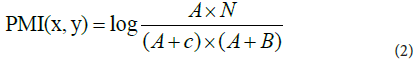
(1) Pointwise mutual information
In information theory, the mutual information of two random variables is a measure of the mutual dependence between the two variables. More specifically, it quantifies the amount of information obtained about one random variable by observing the other random variable. PMI is a particular variant of mutual information. In contrast to mutual information, PMI refers to single event, whereas MI refers to the average of all possible events. It is defined as follows:
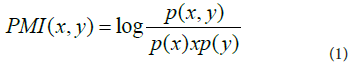
Given the estimation that (x, y) = A/ , p(x) = A+B/ N and p(y) = A+C/N, where N is the size of the dataset, the PMI can be estimated as follows:
(2) Correlation coefficient
Correlation Coefficient (CC) is a statistical measure used to measure a statistical relationship between two variables. A specific form that is Correlation Coefficient (CC) of a variable x with another variable y is defined as follows:
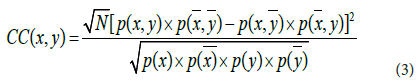
A high value of CC indicates a strong direct correlation, a negative low value indicates a strong inverse correlation, and values near zero indicate little, if any, correlation. Several types of correlation coefficient exist, each with their own definition and own range of usability and characteristics.
(3) Odds ratio
Odds Ratio (OR) is defined as the ratio of the odds of x in the presence of y and the odds of x in the absence of y, or equivalently (due to symmetry), the ratio of the odds of y in the presence of x and the odds of y in the absence of x. its defined as follows:
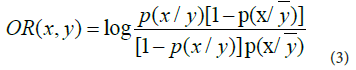
The variables are independent if and only if OR equals zero: The odds of one event are the same in either the presence or absence of the other event. If the OR is greater than 0, then x and y are associated (correlated) in the sense that, compared to the absence of y, the presence of y raises the odds of x, and symmetrically the presence of x raises the odds of y. Conversely, if the OR is less than 0, then x and y are negatively correlated, and the presence of one event reduces the odds of the other event.
Results and Discussion
This section presents and discusses the results of applying the three data correlation measures, implemented in Ms Excel and its Visual Basic for Applications as shown in Tables 5, 6, and 7. The values in these tables reflect the strength of the correlation between each PM and PEOs, where the higher the value the stronger the correlation. They can be positive, negative, zero or undefined. The positive value indicates a positive correlation between a PM and a PEO, in the sense that the existence of one of them increases the likelihood of the other. Similarly, the negative value indicates the negative correlation between a PM and a PEO, in the sense that the existence of one of them decreases the likelihood of the other existence. As for the zero value, they indicate the independence between PM and PEO. The variation among PEOs in their correlations to a particular PM is obvious, where some PEOs are positively correlated, and others are negatively correlated. A general look at the results in the three tables shows that each measure evaluates the correction between a particular PEO and PM differently. This is a direct consequence of the differences among these measures in their methods of correlation measuring. Despite this variation, all three measures are consistent in their evaluation of the type of correlation positive, negative, independence. This can be interpreted by the fact that all these measures are one-sided measures, which means that they evaluate the correlation between two variables based on their presence and do not consider their absence. (Tables 5, 6 and 7)
| PMI \PEO | CS | C | EC | GS | KC | L | LL | P | SC | T | TC |
|---|---|---|---|---|---|---|---|---|---|---|---|
| Aerospace | 0.59 | -0.28 | UnDef | -0.13 | 0.34 | -0.77 | 0.40 | -0.03 | 0.40 | -0.36 | 0.11 |
| Bio-Medical | -0.28 | 0.39 | 0.14 | 0.58 | -0.86 | -0.42 | -0.53 | 0.36 | -0.21 | 0.61 | -0.28 |
| Chemical | -0.06 | -0.06 | 0.02 | 0.40 | 0.28 | 0.45 | -0.39 | -0.50 | 0.34 | -0.42 | 0.16 |
| Civil | 0.01 | -0.02 | -0.03 | -0.12 | -0.61 | -0.50 | 0.20 | 0.14 | 0.29 | -0.25 | 0.08 |
| Communication | -1.15 | 0.52 | -0.40 | UnDef | -0.40 | UnDef | -0.08 | -1.19 | -0.35 | 1.06 | 0.95 |
| Computer | 0.25 | -0.22 | 0.13 | 0.39 | -0.24 | 0.09 | 0.19 | 0.13 | -0.18 | -0.08 | -0.52 |
| Electrical | 0.06 | 0.09 | -0.09 | 0.03 | 0.09 | -0.10 | -0.21 | -0.25 | -0.48 | 0.35 | 0.23 |
| Electronics | -0.25 | -0.58 | 0.50 | 0.03 | -2.09 | 0.93 | 0.24 | 0.94 | 0.29 | -1.21 | -0.99 |
| Gen. Engineering | -0.44 | 0.49 | 0.57 | 0.10 | -0.01 | 0.01 | 0.12 | -0.21 | 0.37 | 0.45 | -0.66 |
| Environmental | 0.24 | -0.09 | -0.01 | 0.91 | 0.57 | -1.58 | -0.10 | 0.01 | 0.04 | -0.13 | -0.92 |
| Industrial | 0.01 | 0.04 | -0.05 | -0.35 | -0.24 | 0.38 | -0.02 | -0.24 | 0.18 | 0.15 | 0.11 |
| Material | UnDef | -0.14 | 0.52 | -0.95 | 0.94 | UnDef | -0.74 | -0.26 | -1.01 | 0.40 | 1.03 |
| Mechanical | -0.04 | 0.09 | -0.12 | -0.47 | 0.46 | 0.31 | -0.01 | -0.22 | -0.23 | -0.09 | 0.18 |
| Metallurgical | 0.03 | -0.88 | -0.86 | UnDef | 0.20 | -0.37 | -0.47 | 1.00 | 1.26 | UnDef | -0.03 |
Table 5: PMs-PEOs correlation - PMI measure.
| PMI \PEO | CS | C | EC | GS | KC | L | LL | P | SC | T | TC |
|---|---|---|---|---|---|---|---|---|---|---|---|
| Aerospace | 1.09 | -0.29 | -1.61 | -0.13 | 0.43 | -0.55 | 0.67 | -0.04 | 0.50 | -0.38 | 0.21 |
| Bio-Medical | -0.48 | 0.63 | 0.21 | 0.95 | -0.90 | -0.43 | -0.80 | 0.77 | -0.27 | 1.10 | -0.57 |
| Chemical | -0.12 | -0.11 | 0.03 | 0.71 | 0.51 | 0.74 | -0.73 | -0.94 | 0.61 | -0.63 | 0.46 |
| Civil | 0.05 | -0.06 | -0.09 | -0.34 | -1.52 | -1.10 | 0.83 | 0.59 | 0.96 | -0.73 | 0.41 |
| Communication | -0.88 | 0.53 | -0.29 | 0.00 | -0.29 | 0.00 | -0.08 | -0.91 | -0.25 | 1.36 | 1.81 |
| Computer | 1.15 | -0.66 | 0.42 | 1.38 | -0.70 | 0.25 | 0.83 | 0.57 | -0.53 | -0.25 | -2.24 |
| Electrical | 0.26 | 0.31 | -0.27 | 0.08 | 0.30 | -0.26 | -0.79 | -0.98 | -1.24 | 1.27 | 1.28 |
| Electronics | -0.47 | -0.75 | 0.90 | 0.04 | -1.67 | 1.69 | 0.51 | 2.69 | 0.48 | -1.29 | -1.76 |
| Gen. Engineering | -0.75 | 0.89 | 1.03 | 0.15 | -0.02 | 0.01 | 0.24 | -0.39 | 0.60 | 0.82 | -1.26 |
| Environmental | 0.50 | -0.14 | -0.02 | 1.79 | 1.03 | -1.21 | -0.19 | 0.02 | 0.06 | -0.20 | -1.62 |
| Industrial | 0.02 | 0.09 | -0.11 | -0.64 | -0.48 | 0.81 | -0.07 | -0.63 | 0.40 | 0.36 | 0.40 |
| Material | 0.00 | -0.15 | 0.66 | -0.70 | 1.39 | 0.00 | -0.78 | -0.34 | -0.74 | 0.51 | 2.54 |
| Mechanical | -0.19 | 0.33 | -0.41 | -1.37 | 1.94 | 1.05 | -0.05 | -0.95 | -0.74 | -0.31 | 1.09 |
| Metallurgical | 0.04 | -0.65 | -0.64 | 0.00 | 0.21 | -0.26 | -0.50 | 1.87 | 1.88 | 0.00 | -0.05 |
Table 6: Tables PMs-PEOs correlation – CC measure.
| PMI \PEO | CS | C | EC | GS | KC | L | LL | P | SC | T | TC |
|---|---|---|---|---|---|---|---|---|---|---|---|
| Aerospace | 0.71 | -0.35 | UnDef | -0.14 | 0.38 | -0.86 | 0.48 | -0.03 | 0.44 | -0.40 | 0.14 |
| Bio-Medical | -0.48 | 0.63 | 0.21 | 0.95 | -0.90 | -0.43 | -0.60 | 0.77 | -0.27 | 1.10 | -0.57 |
| Chemical | -0.07 | -0.07 | 0.02 | 0.45 | 0.32 | 0.51 | -0.46 | -0.58 | 0.38 | -0.47 | 0.21 |
| Civil | 0.02 | -0.02 | -0.04 | -0.15 | -0.74 | -0.60 | 0.26 | 0.19 | 0.37 | -0.31 | 0.11 |
| Communication | -1.27 | 0.57 | -0.43 | UnDef | -0.43 | UnDef | -0.09 | -1.30 | -0.37 | 1.22 | 1.26 |
| Computer | 0.35 | -0.27 | 0.16 | 0.52 | -0.30 | 0.11 | 0.26 | 0.17 | -0.23 | -0.10 | -0.70 |
| Electrical | 0.08 | 0.12 | -0.11 | 0.04 | 0.12 | -0.13 | -0.27 | -0.33 | -0.58 | 0.46 | 0.34 |
| Electronics | -0.29 | -0.64 | 0.57 | 0.03 | -2.22 | 1.07 | 0.28 | 1.19 | 0.33 | -1.31 | -1.16 |
| Gen. Engineering | -0.51 | 0.56 | 0.66 | 0.11 | -0.02 | 0.01 | 0.14 | -0.25 | 0.41 | 0.52 | -0.78 |
| Environmental | 0.28 | -0.11 | -0.02 | 1.05 | 0.66 | -1.67 | -0.12 | 0.01 | 0.05 | -0.15 | -1.08 |
| Industrial | 0.01 | 0.05 | -0.06 | -0.40 | -0.28 | 0.45 | -0.03 | -0.30 | 0.21 | 0.18 | 0.15 |
| Material | UnDef | -0.16 | 0.58 | -1.01 | 1.07 | UnDef | -0.82 | -0.30 | -1.07 | 0.45 | 1.39 |
| Mechanical | -0.06 | 0.12 | -0.16 | -0.60 | 0.65 | 0.42 | -0.01 | -0.29 | -0.30 | -0.12 | 0.27 |
| Metallurgical | 0.04 | -0.94 | -0.86 | UnDef | 0.22 | -0.39 | -0.53 | 1.24 | 1.45 | UnDef | -0.04 |
Table 7: PMs-PEOs correlation – OR measure.
A major limitation of these measures is the lack of a fixed upper bound of correlation values that makes its unknown how close a correlation is to perfect. However, despite the difference in measurement mechanisms and scales of the three measures, they are virtually consistent in measuring the PMs-PEOs relationship. Nonetheless, to quantitatively evaluate the degree of consistency between the three measures, the agreement analysis between them can be applied. Basically, there are two methods to analyze the agreement. The first method applies simple correlation such as Peason’s correlation to measure the correlation between the obtained correlations tables of the three measures after flattening them into vectors. The second method is based on ranking the obtained correlations table of the three measures and then computes the agreement between them. In this work, measuring the agreement based on the ranking is adopted; therefore, a ranking procedure of the data in Tables 5, 6, and 7 is performed as shown in Tables 8, 9, 10, respectively.
| PMI \PEO | CS | C | EC | GS | KC | L | LL | P | SC | T | TC |
|---|---|---|---|---|---|---|---|---|---|---|---|
| Aerospace | 1 | 8 | 11 | 7 | 4 | 10 | 2 | 6 | 2 | 9 | 5 |
| Bio-Medical | 7 | 3 | 5 | 2 | 11 | 9 | 10 | 4 | 6 | 1 | 7 |
| Chemical | 7 | 7 | 6 | 2 | 4 | 1 | 9 | 11 | 3 | 10 | 5 |
| Civil | 5 | 6 | 7 | 8 | 11 | 10 | 2 | 3 | 1 | 9 | 4 |
| Communication | 8 | 3 | 6 | 10 | 6 | 10 | 4 | 9 | 5 | 1 | 2 |
| Computer | 2 | 9 | 4 | 1 | 10 | 6 | 3 | 4 | 8 | 7 | 11 |
| Electrical | 5 | 3 | 7 | 6 | 3 | 8 | 9 | 10 | 11 | 1 | 2 |
| Electronics | 7 | 8 | 3 | 6 | 11 | 2 | 5 | 1 | 4 | 10 | 9 |
| Gen. Engineering | 10 | 2 | 1 | 6 | 8 | 7 | 5 | 9 | 4 | 3 | 11 |
| Environmental | 3 | 7 | 6 | 1 | 2 | 11 | 8 | 5 | 4 | 9 | 10 |
| Industrial | 6 | 5 | 8 | 11 | 9 | 1 | 7 | 9 | 2 | 3 | 4 |
| Material | 10 | 5 | 3 | 8 | 2 | 10 | 7 | 6 | 9 | 4 | 1 |
| Mechanical | 6 | 4 | 8 | 11 | 1 | 2 | 5 | 9 | 10 | 7 | 3 |
| Metallurgical | 4 | 9 | 8 | 10 | 3 | 6 | 7 | 2 | 1 | 10 | 5 |
Table 8: PMs-PEOs correlation – PMI Ranking
| PMI \ PEO | CS | C | EC | GS | KC | L | LL | P | SC | T | TC |
|---|---|---|---|---|---|---|---|---|---|---|---|
| Aerospace | 1 | 8 | 11 | 7 | 4 | 10 | 2 | 6 | 2 | 9 | 5 |
| Bio-Medical | 7 | 3 | 5 | 2 | 11 | 9 | 10 | 4 | 6 | 1 | 7 |
| Chemical | 7 | 7 | 6 | 2 | 4 | 1 | 9 | 11 | 3 | 10 | 5 |
| Civil | 5 | 6 | 7 | 8 | 11 | 10 | 2 | 3 | 1 | 9 | 4 |
| Communication | 8 | 3 | 6 | 10 | 6 | 10 | 4 | 9 | 5 | 1 | 2 |
| Computer | 2 | 9 | 4 | 1 | 10 | 6 | 3 | 4 | 8 | 7 | 11 |
| Electrical | 5 | 3 | 7 | 6 | 3 | 8 | 9 | 10 | 11 | 1 | 2 |
| Electronics | 7 | 8 | 3 | 6 | 11 | 2 | 5 | 1 | 4 | 10 | 9 |
| Gen. Engineering | 10 | 2 | 1 | 6 | 8 | 7 | 5 | 9 | 4 | 3 | 11 |
| Environmental | 3 | 7 | 6 | 1 | 2 | 11 | 8 | 5 | 4 | 9 | 10 |
| Industrial | 6 | 5 | 8 | 11 | 9 | 1 | 7 | 9 | 2 | 3 | 4 |
| Material | 10 | 5 | 3 | 8 | 2 | 10 | 7 | 6 | 9 | 4 | 1 |
| Mechanical | 6 | 4 | 8 | 11 | 1 | 2 | 5 | 9 | 10 | 7 | 3 |
| Metallurgical | 4 | 9 | 8 | 10 | 3 | 6 | 7 | 2 | 1 | 10 | 5 |
Table 9: PMs-PEOs correlation – CC Ranking
| PMI \ PEO | CS | C | EC | GS | KC | L | LL | P | SC | T | TC |
|---|---|---|---|---|---|---|---|---|---|---|---|
| Aerospace | 1 | 8 | 11 | 7 | 4 | 10 | 2 | 6 | 2 | 9 | 5 |
| Bio-Medical | 7 | 3 | 5 | 2 | 11 | 9 | 10 | 4 | 6 | 1 | 7 |
| Chemical | 7 | 7 | 6 | 2 | 4 | 1 | 9 | 11 | 3 | 10 | 5 |
| Civil | 5 | 6 | 7 | 8 | 11 | 10 | 2 | 3 | 1 | 9 | 4 |
| Communication | 8 | 3 | 6 | 10 | 6 | 10 | 4 | 9 | 5 | 1 | 2 |
| Computer | 2 | 9 | 4 | 1 | 10 | 6 | 3 | 4 | 8 | 7 | 11 |
| Electrical | 5 | 3 | 7 | 6 | 3 | 8 | 9 | 10 | 11 | 1 | 2 |
| Electronics | 7 | 8 | 3 | 6 | 11 | 2 | 5 | 1 | 4 | 10 | 9 |
| Gen. Engineering | 10 | 2 | 1 | 6 | 8 | 7 | 5 | 9 | 4 | 3 | 11 |
| Environmental | 3 | 7 | 6 | 1 | 2 | 11 | 8 | 5 | 4 | 9 | 10 |
| Industrial | 6 | 5 | 8 | 11 | 9 | 1 | 7 | 9 | 2 | 3 | 4 |
| Material | 10 | 5 | 3 | 8 | 2 | 10 | 7 | 6 | 9 | 4 | 1 |
| Mechanical | 6 | 4 | 8 | 11 | 1 | 2 | 5 | 9 | 10 | 7 | 3 |
| Metallurgical | 4 | 9 | 8 | 10 | 3 | 6 | 7 | 2 | 1 | 10 | 5 |
Table 10: PMs-PEOs correlation – OR Ranking.
Then the agreement between the ranked tables is computed. Table 11 shows the mutual agreement between every pair of the three measures and the agreement between the three measures in their measuring of PMs-PEOs correlations. Obviously, PMI shows full agreement with OR in ranking PEOs of 9 engineering majors; CC shows full agreement with OR in ranking PEOs of 5 engineering majors. Interestingly, the three measures show full agreement in ranking PEOs of 2 engineering majors (Civil and General Engineering). In addition, Table 11 shows also the average agreement (last row) between every pair of the three measures and the average agreement between the three measures. It the highest between PMI and OR and the lowest between PMI and CC. (Table 11)
|
PMI&CC | PMI&OR | CC&OR | PMI&CC&ROR |
|---|---|---|---|---|
| Aerospace | 0.91 | 0.91 | 1.00 | 0.91 |
| Bio-Medical | 0.55 | 0.55 | 1.00 | 0.55 |
| Chemical | 0.73 | 1.00 | 0.73 | 0.73 |
| Civil | 1.00 | 1.00 | 1.00 | 1.00 |
| Communication | 0.09 | 0.82 | 0.27 | 0.09 |
| Computer | 0.91 | 0.91 | 1.00 | 0.91 |
| Electrical | 0.55 | 1.00 | 0.55 | 0.55 |
| Electronics | 0.55 | 1.00 | 0.55 | 0.55 |
| General Engineering | 1.00 | 1.00 | 1.00 | 1.00 |
| Environmental | 0.82 | 1.00 | 0.82 | 0.82 |
| Industrial | 0.73 | 0.91 | 0.82 | 0.73 |
| Material | 0.36 | 1.00 | 0.36 | 0.36 |
| Mechanical | 0.64 | 1.00 | 0.64 | 0.64 |
| Metallurgical | 0.36 | 1.00 | 0.36 | 0.36 |
| Average | 0.66 | 0.94 | 0.72 | 0.66 |
Table 11: Agreement among the three measures.
Finally, Table 8 contains the ranked PEOs within PMs. It reflects the strength of correlation between each PM and the PEOs set. Obviously, each PM has a different pattern of ranking PEOs set. These results are useful to engineering programs developer and reviewers. Moreover, the results open the door for many questions on the causality behind these correlations. (Table 12)
| 1st | 2nd | 3rd | 4th | 5th | 6th | 7th | 8th | 9th | 10th | 11th | |
|---|---|---|---|---|---|---|---|---|---|---|---|
| Aerospace | CS | LL | SC | KC | TC | P | GS | C | T | L | EC |
| Bio-Medical | T | GS | P | C | EC | SC | L | CS | TC | LL | KC |
| Chemical | L | GS | SC | KC | TC | EC | CS | C | LL | T | P |
| Civil | SC | LL | P | TC | CS | C | EC | GS | T | L | KC |
| Communication | TC | T | C | LL | SC | EC | KC | CS | P | L | GS |
| Computer | GS | CS | LL | P | EC | L | T | SC | C | KC | TC |
| Electrical | T | TC | C | KC | CS | GS | EC | L | LL | P | SC |
| Electronics | P | L | EC | SC | LL | GS | CS | C | TC | T | KC |
| General Engineering | EC | C | T | SC | LL | GS | L | KC | P | CS | TC |
| Environmental | GS | KC | CS | SC | P | EC | C | LL | T | TC | L |
| Industrial | L | SC | T | TC | C | CS | LL | EC | KC | P | GS |
| Material | TC | KC | EC | T | C | P | LL | GS | SC | L | CS |
| Mechanical | KC | L | TC | C | LL | CS | T | EC | P | SC | GS |
| Metallurgical | SC | P | KC | CS | TC | L | LL | EC | C | T | GS |
Table 12: Ranked PEOs within PMs
Conclusion
The relationship between the programs’ major and its educational objectives are investigated in this study. Three data correlation measures, PMI, CC and OR, are applied to a dataset of 14 PMs and 11 PEOs extracted from 215 engineering academic programs. The obtained results show remarkable consistency among the three measures in their evaluation of the PMs-PEOs correlations. The obtained results also show that due to the distinctive nature of PMs, the PEOs set are correlated to each PM differently. While the above results do not lend themselves easily to intuitive interpretation, they still represent useful knowledge to academicians to better understand and design their programs. Moreover, the obtained quantitative results open questions for more investigation on the causality of the relationship between PMs and PEOs.
References
- Church KW, Hanks P (1990) Word association norms, mutual information, and lexicography Computational Linguistics 16: 22-29.
- Buniyamin N, Mat UB, Arshad PM (2015) Educational data mining for prediction and classification of engineering students achievement ICEED 11: 18-25.
- Osman A, Yahya AA, Kamal B (2018) A benchmark collection for mapping program educational objectives to ABET student outcomes: Accreditation SDMA 753: 46-60.
- Siemens G (2013) Learning analytics: The emergence of a discipline ABS 57: 1380-1400.
- Pelanek R (2019) Measuring similarity of educational items: An overview IEEE Trans Learn Technol 13: 354-366.
- Khan MI, Mourad SM, Zahid WM (2014) Developing and qualifying civil engineering programs for ABET accreditation J. King Saud Univ. Eng. Sci28: 1-11.
- Abbadeni N, Ghoneim A, Alghamdi A (2013) Program educational objectives definition and assessment for quality and accreditation IJEP3: 1-15
- Mendez G, Ochoa X, Chiluiza K, Chiluiza Wever BD (2014) Curriculum design analysis: A data-drivenperspective, Learning Analytics,1: 84-119.
- Bouslimani Y, Durand G, Belacel N (2016) Educational data mining approach for engineering graduate attributes analysis CEEA 11: 8-12
- Sharabiani A, Karim, Anooshiravan S, Atanaso A (2014) An enhanced bayesian network model for prediction of students' academic performance in engineering programs EDUCON 10: 1-5