Spanish
  Chinese
  Russian
  German
  French
  Japanese
  Portuguese
  Hindi
Hindi Research Article, J Appl Bioinforma Comput Biol Vol: 9 Issue: 6
A Long Short-Term Memory Deep Learning Network for MRI Based Alzheimer’s Disease Dementia Classification
Sneha Mirulalini Gnanasegar1, Balu Bhasuran2 and Jeyakumar Natarajan1*
1Data Mining and Text Mining Laboratory, Department of Bioinformatics, Bharathiar University, Coimbatore, Tamilnadu, India
2DRDO-BU Center for Life Sciences, Bharathiar University Campus, Coimbatore, Tamilnadu, India
*Corresponding Author: Jeyakumar Natarajan
Data Mining and Text Mining Laboratory, Department of Bioinformatics, Bharathiar University, Coimbatore, Tamilnadu, India
E-mail: n.jeyakumar@yahoo.co.in
Received: October 07, 2020 Accepted: December 14, 2020 Published: December 21, 2020
Citation: Gnanasegar SM, Bhasuran B, Natarajan J (2020) A Long Short-Term Memory Deep Learning Network for MRI Based Alzheimer’s Disease Dementia Classification. J Appl Bioinforma Comput Biol 9:6. doi: 10.37532/jabcb.2020.9(6).187
Abstract
MRI data has been widely used for early detection and diagnosis of Alzheimer’s disease. This work outlines a deep learning based Long Short-Term Memory (LSTM) algorithm combined with Boruta algorithm-based feature selection approach was used to classify the Alzheimer disease MRI dataset as demented or non-demented. The wrapper based all relevant algorithm Boruta is used to select the important features from MRI data set. LSTM is a type of recurrent neural network with layered architecture to classify the datasets. The advantage of using LSTM is that it creates memory components that are for both short and long terms compared to traditional RNNs. The feature selection approach identified measures such as CDR (Clinical Dementia Rating) and MMSE (Mini mental status Examination) as the top ranking features in the Open Access Series of Imaging Studies (OASIS) MRI data set. The evaluation of LSTMbased methodology with Boruta feature selection using OASIS MRI and Alzheimer’s MRI dataset suggest that proposed methodology was able to achieve an accuracy of 94% on test dataset, exhibiting a significant increase compare to the other state-of-the-art systems.
Keywords: Deep Learning; Classification; Dementia; LSTM, Boruta; OASIS MRI data
Introduction
Dementia a neurodegenerative disorder leading to a decline in the neuronal dysfunction, permanent brain damage and death has higher possibilities of multimorbidity [1]. Anxiety, stress, stroke, insomnia, depression, post-stroke lifestyle, chest infection, urinary tract infection, falls, vital organ damage, chronic illness and wrong medications or overdoses are proven factors of comorbidities. Possible causes are Hypoxia, Oxidative stress, Insomnia, Chronic illness, Electrolyte disorder caused by vital organ ailments, cerebrovascular diseases like stroke, traumatic brain injury (TBI), mild cognitive impairment (MCI), genetic defects, ant cholinergic drug abuse, etc [2]. With huge volume of data deposited in different databases over the internet, machine learning apart from other fields has highly excelled in using this data for knowledge discovery in modern medical diagnostics and other clinical proceedings. Though clinical diagnosis has a memory test, neurological, gait and neuropsychological examinations there are a lag in early diagnosis leading to an immediate promising approach for early diagnosis.
Initially machine learning based classification approaches were proposed by various researchers for this early diagnosis task. Choi et al. used the OASIS pre-processed dataset and the problem statement was to predict AD early using Logistic Regression, Support Vector Machine, Decision tree Classifier, Random forest Classifier, and Adaboost [3]. Moradi et al. developed a novel biomarker using semi- supervised learning for MCI to AD conversion with low-density separation method followed by Logistic Regression for feature selection was performed on the MRI data [4]. Biomarker for MRI was constructed separately using Random forest Algorithm. The performance evaluation was done by 2 nested cross-validation loops with10-fold for each loop. Zhang et al. proposed a novel system to detect AD based on Eigen brains construction. Maximum interclass variance followed by eigen brains generation and Welch’s test to get important eigen brains. The Polynomial, Linear, and Radial basis function SVM kernel classifiers were used. This work had the combination of different classifiers of which the polynomial kernel had 92.36% accuracy [5]. Sorensen et al. used ensemble SVM bagging without replacement. LIBSVM was used for SVM training and classification with 3 inner cross-validation folds. Number of SVMs in the ensemble was 25 [6]. The study showed that the ensemble was better than the single SVM classification.
In current modern medicine, deep learning is used in the medical diagnosis [7], health informatics [8], biomedicine [9] and Magnetic resonance analysis [10]. The deep learning methods are more useful when compared to conventional machine learning approaches as they can easily learn from raw data since they have multiple hidden layers. Dementia can be detected using various parameters such as the content of questions, percentage of nouns and verbs in the utterance, rate of voice, intonation and articulation [11]. Automatic language- based assessment using a deep learning approach to detect aphasia and dementia has been proposed by Zhu [12]. Young et al. from University of California has developed SuStaln (Subtype and Stage Inference), an algorithm where the focus is on regular MRI images of the respective patients and a detailed study to create an algorithm that can detect and differentiate the mild cognitive impairment from the demented [13].
Amoroso et al. used random forest for feature selection with 5-fold cross-validations and DNN (Deep Neural Networks) for classification in which the DNN showed the highest accuracy. In their model classification was done using 100, 10-fold cross-validation along with a mixed cohort approach reported overall accuracy of DNN as 53.7% and 50.9% for the fuzzy model [14]. Jerry et al. specifically used Open Access Series of Imaging Studies (OASIS) data set with TensorFlow
1.8.0 and Python 3 to apply machine learning algorithms such as neighborhood classification, perceptions, decision trees, deep neural networks and support vector clustering. Accuracy of each algorithm was found by measuring the mean accuracy. The deep neural network with TensorFlow after training had 68.889% accuracy followed by the accuracy of 63.830% for perceptron, and the Neighborhood classification 60.563% respectively [15]. Further studies have used biomarkers in the MRI to diagnose AD in different stages. Early detection uses deep learning to identify if MCI patients down the lane in a few years could have probabilities to become demented.
Inspired by the recent focusing on deep learning techniques, the present study used Long Short-Term Memory (LSTM) algorithm which is a time series, Recurrent Neural Network (RNN) combined with Boruta algorithm based feature selection for the generation of a classification model using OASIS MRI data and classified as demented or non-demented. The open source machine learning platform TensorFlow [16] was used to build our classification model.
Material and Methods
MRI Data
The dataset used in this study is a preprocessed data obtained from OASIS an open-access series of imaging studies available as MRI and Alzheimer’s from Kaggle repository [17]. The Open Access Series of Imaging Studies (OASIS) project focused on collecting and freely distributing MRI data sets of the brain to the scientific community for facilitating further analysis and discoveries (OASIS) [18]. The OASIS MRI dataset consist of various demographic, clinical, and derived imaging measures such as Gender, Age, Years of education (EDUC), Socioeconomic status(SES), Mini-Mental State Examination score (MMSE), Clinical Dementia Rating(CDR), Estimated Total Intracranial Volume (eTIV), Normalized Whole-brain Volume (nWBV) and Atlas scaling factor (ASF) [2,18]. Schematic architecture of the proposed work is depicted in Figure 1 given below.

Figure 1: Schematic Architecture of the Deep Learning based classification approach.
Data Pre-processing
The MRI data set comes with lot of missing and null values.To understand the variable relations co relation and dispersion matrix were generated. The aim is to understand the variable dependency in a non standardized data. In order to reduce the noise in the data we followed a set of pre processing steps such as data normalization as follows. The missing values found in the data set are assigned as 0. The demented value in the data set is labeled as 1, non-demented is labeled as 0 and the converted is labeled as 0.5. The MRI Id from the data set is also converted to float to overcome the basic problem of string to float data conversion in TensorFlow.
Feature Selection
Feature selection or variable selection is an important step in building a robust learning model. The core focus is to build a classification or prediction model with most relevant and uncorrelated features that are adequately reflecting all the characteristics of the data [19]. Feature selection enables to reduce the unwanted noise, correlation and biases in data there by finding a best set of relevant features for a machine learning model. Identification of all the features that are contributing in some level to a classification task is called all relevant feature selection approach [20]. The aim of this approach is to understand the mechanism of features relation to the classification problem. Since the MRI data set comes with various features covering demographic, clinical, and derived imaging measures, we used Boruta algorithm to find the most relevant features for the MRI dataset.
Boruta is a wrapper approach built using random forest classification approach in the R package [21]. Boruta is developed by adding randomness to the system and the relevant features are generated through a comparison of importance between original and random attributes. This ensemble nature gave an added advantage of finding relevant features. The algorithm starts with weight initialization using random forest, replication of descriptive variables followed by an iterative procedure in which least relevant features are converted into contrast variables using permutation. Finally threshold level will be increased and procedure will be repeated until consistency. The current study used the Boruta feature selection available in the R package [22].
LSTM Model
Long short-term memory (LSTM) is one the most popular recurrent neural network (RNN) architecture which was introduced to resolve the major draw backs of traditional RNNs called vanishing and exploding gradient problems [23]. In a traditional RNN a hidden vector is used for the sequential history summarization and a hidden state is shared across time. This feedback connection provides a short- term memory using activation function. This design is inadequate for long term memory, generally called as vanishing gradient problem. LSTM was introduced by Hochreiter and Schmidhuber to solve this issue by replacing the hidden vector with gated memory blocks [24]. This memory blocks in principle are capable of storing information for a long time, enabling LSTM for idle candidate for a variety of learning tasks.
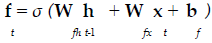
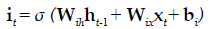
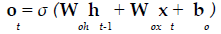
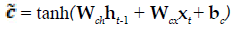
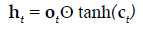
The present study employed LSTM for building a classification model using MRI dataset to identify demented or non demented subjects. As previously mentioned the integration of adaptive gates enables LSTM for long term memory. The gating mechanism retains information of the previous state as well as the extracted features of the current state. In order to do so a set of components are assembled in to a special architecture [25]. The components are an input gate, forget gate, memory gate and output gate. The formalization of these gates in to LSTM architecture is depicted in the following equations 1-6 [26].
 (1)
(1)
 (2)
(2)
 (3)
(3)
 (4)
(4)
 (5)
(5)
 (6)
(6)
In the above mentioned equations, ft is the forget gate, it is the input gate, ot is the output gate and ht is the hidden state. W denotes the weight matrix, x denoted the current input and b denotes the bias respectively. The gates ft, it and ot follows a standard RNN architecture with sigmoid activation function rather than the tanh. The sigmoid activation function restricts the value of output in between 0 and 1. ct is the memory cell which uses a tanh activation function for computing the weight. From equation 4 we can find that the ct-1, previous memory is combined with the memory cell update ct along with information from forget gate ft and input gate it. Finally using equation 6 ht (new hidden state) is computed by using output gate ot with tanh activation of new memory cell ct. It is also worthy to mention that the generation of new memory cell ct enables LSTM to solve the vanishing gradient problem.
Comparison
Most of the generated ML models using MRI data set are reported in Kaggle platform repository [27-30]. Hyunseokc, created various machine learning models using MRI data set and compared with other systems in the Kaggle repository [28]. The ML models created using MRI data set are Logistic Regression (imputation), Logistic Regression (dropna), SVM, Decision Tree, Random Forest and AdaBoost [28]. The models reported an accuracy ranging from 75% to 85%. Andrew, used TensorFlow and Decision Tree using scikit learn to create classification models and reported 91% and 86% respectively [29]. Ruslan, created multiple classification models using Random Forest and Gradient Boosting Machine and reported accuracy of 88% and 91% respectively in the Kaggle repository [30].
Result
Features and Characteristics of the MRI Dataset
The MRI dataset used in the current study reflects a total of 373 imaging sessions of 150 subjects between the age of 60 and 96. For each subject multiple MRI scans (3 to 4) were obtained to collect the various measures. According to scan result and disease progression the dataset finally reported a total of 146 sessions as demented, 190 as non-demented and 37 as converted. Full list of measures (features) and description of the MRI dataset is given in Table 1 and characteristic of the dataset is given in Table 2.
| Feature | Explanation |
|---|---|
| Age | Patient Age |
| Gender | Gender (M or F) |
| Educ | Education |
| Visit | Patient visits |
| Group | Demented/Non demented/Converted |
| Hand | Subjects hand |
| MR Delay | No. of days in between visits |
| MMSE | Mini Mental Status Examination |
| CDR | Clinical Dementia Rating |
| eTIV | Estimated Total Intracranial volume |
| nWBV | Normalized Whole Brain Volume |
| ASF | Atlas scaling Factor |
| SES | Socio economic Status |
Table 1: MRI data set features.
| Characteristic | Value |
|---|---|
| Imaging session | 373 |
| Subjects | 150 |
| Age | 60-96 |
| Scans | 3-4 |
| Demented | 146 |
| Non- Demented | 146 |
| Converted | 37 |
Table 2: Characteristics of MRI Dataset.
Feature Selection
Boruta feature selection method based on random forest algorithm ranked Clinical Dementia Rating (CDR) and Mini Mental Status Examination (MMSE) are the most important features followed by nWBV, MR Delay, SES, eTIV, and ASF repectively. The least important features according to Boruta is hand and no of visits. A detailed representation of Boruta based feature selection is depicted in Figure 2 given below.

Figure 2: Boruta based feature selection.
In order to represent the correlation between features a heat map has been generated which is depicted as Figure 3. From the heat map we can identify that MRI delay and no of visits clearly coincides with a score of 0.92. This correlation can be interpreted as, if the patient visiting a doctor is delayed then MRI is delayed which shows derail in identification or studying the patient. The next correlating features are the brain volume and neuropsychological tests the MMSE standing with the value 0.34. The following correlation is the feature ASF with SES and sTIV with Educ with a score of 0.26. The subsequent association is the nWBV with ASF and age with MR delay, visit and finally the Educ with MMSE.

Figure 3: Heat map representing the correlation of features.
Though all the features seem to resemble each other and associate, there are certain conditions where there is no strong correlation between certain features. The initial features that have no strong association are the ASF with eTIV followed by the fact that the SES has nothing to do with Educ. Though CDR and MMSE are important features in the dementia diagnosis, they both are non correlated to each other. Similarly, age has no correlation with the brain volume as young brains also tend to lose their volume due to certain factors or due to even MCI. Neither does the brain volume correlates with CDR and eTIV.
Figure 4 represents the graphical representation of MRI data set features correlation to dementia. The graph that represents age (Figure 4(a)) shows that the disorder is spread through and not localized on one particular category. It shows that individual in the age group 90 and above do not have dementia but those in the 70s do have this disorder, while in certain individuals in their 90 they have dementia and those in the early 70s and 60s do not have them. ASF in Figure 4(b) shows results that have variation among patients. Followed by is the MMSE in Figure 4(c) where the demented patients showed a sharp decline in the score and sometimes sustained in the normal ranges as mentioned in the Folstein test but still demented. It is also worthy to be mention that, the non-demented range was maintained perfectly except for a few patients who showed MCI scores but ended up being non-demented.

Figure 4: Graphical representation of features.
The CDR also supportively shows the same results as MMSE scores. The eTIV is slightly higher and sometimes lower and is shows fluctuating in Figure 4(d). The nWBV obviously explains the reason behind dementia. In Fig 4 (e) the shrunken volume of the brain can be witnessed in the demented and the normal volume of the brain is shown in red stating normal brain.
To summaries, the correlation between features studied using heat maps exhibited the maximum correlation of 0.92 between the number of visits and MRI delay whereas the nWBV and MMSE had the second maximum correlation score 0.34 which proves that the reduction in brain volume leads to brain atrophy loss of normal brain function that mechanically reduced MMSE scores, while the least relevant features are the education and CDR having a score of 0.99. In accordance with the results shown in Boruta, the most important feature is the CDR followed by MMSE. Using the normalized data, graphs for each feature with respect to the subject id was generated that showed a link between each variable with respect to its feature. This graph suggests that despite the standard values that are being given for classifying demented and non-demented, there are certain cases that break this rule and this can be clearly seen in the graphs in Figure 4(a-f).
LSTM Classification Model
The MRI dataset used in the current study reflects a total of 373 imaging sessions of 150 subjects between the age of 60 and 96. The current study generated a model to classify the data as demented or non-demented based on various features such as MMSE, CDR, eTIv etc. The characteristics and data type of specific features of MRI dataset is listed in Table 1 and 2. A deep learning LSTM model using TensorFlow was constructed and the MRI data were split into 80/10/10 for the train, validate and test the model respectively. With the number of batches being set to 50 and the iteration set up to 100, our training set takes up respective batches for specific iteration/ epoch and validates it to give the respective result. Further to test the trained and validated data, the prediction was undertaken. The prediction is done to mainly study if the model is valid to use to diagnose dementia earlier. The present study has a score of 97% in validation and 94% in testing it displays zero over fitting and hence a good model to predict dementia early diagnosis.
Performance Comparison
Previous studies as given in table 3 shows that the classification accuracy stands with promising scores when different classifiers and algorithms are used. In the present study, the LSTM algorithm is used to create the ML-based MRI dataset classification model. The model prediction showed Accuracy of 97% in validation and 94% in testing. Since the data is proved to be trained perfectly without any over fitting, the present model can be used to predict the future MRI images for checking whether it is from demented or a non-demented patient.
| Study | Data set | Methodology | Result(%) |
|---|---|---|---|
| Zhang et al | OASIS | ICV+EigenBrain+WTT+SVM | 91.47 |
| (Ardekani et al ) | ICV+EigenBrain+WTT+RBF-KSVM | 86.71 | |
| ICV+EigenBrain+WTT+Pol-KSVM | 92.36 | ||
| Ardekani et al | OASIS | α = 0.05 | |
| (Marcus et al) | Circularity CIR w.r.to Age,eTIV | 78.9 | |
| ANCOVA | |||
| Levene’s test | |||
| Hyunseok Choi et al | OASIS (Kaggle) (Marcus et al) | 75 | |
| Logistic Regression (w/ imputation) | 81.6 | ||
| Logistic Regression (w/ dropna) | 81.6 | ||
| Support Vector Machine | 84.2 | ||
| Decision Tree Classifier | 84.2 | ||
| Random Forest Classifier | |||
| AdaBoost | |||
| Jerry et al | OASIS(Kaggle Kernel) | Neighbourhood classifier | 60.56 |
| Decision Trees | 54.92 | ||
| SVC | 58.53 | ||
| DNN with Tensorflow | 68.88 | ||
| Perceptron | 63.83 | ||
| Andrew | OASIS (Kaggle Kernel) | Tensorflow | 91 |
| Ruslan | OASIS (Kaggle Kernel) | Decision Tree | 86 |
| Random Forest | 88 | ||
| Gradient Boosting Machine | 91 | ||
| Our Study | OASIS (Kaggle Kernel) | LSTM + Boruta feature selection | 94 |
Table 3: Performance comparison with existing methods.
Table 3 shows the comparison of various works done in different approaches to diagnosing dementia. Zhang et al. used Maximum interclass variance followed by eigen brains generation and Welch’s test to get important eigen brains. The Polynomial, Linear, and Radial basis function SVM kernel classifiers were used. Zhang et al. used Polynomial kernel SVM approach to build a classifier with a accuracy of 92.36%. Hyunseokchoi, reported a variety of classifiers for MRI data set classification such as Logistic Regression, Decision Tree, Random Forest, Neighborhood and AdaBoost classifies with accuracy ranging between 75% to 84.2%. Andrew, used just TensorFlow and scikit-learn to create a classifier and reported a score of 91% in Kaggle kernel. In Jerry et al. work accuracy of each algorithm was found by measuring the mean accuracy. The deep neural network with TensorFlow after training had 68.889% accuracy followed by the accuracy of 63.830% for perceptron, and the Neighborhood classification 60.563% respectively. Ruslankl used gradient boosting machine to get a score of 91%. Our present study used the same data, the MRI dataset for classification using Boruta based feature selection and Deep learning architecture LSTM exhibits an accuracy of 94%.
Conclusions
In this study, we have presented a Boruta based feature selection with Long Short-Term Memory (LSTM) cell-based model to classify the different classes of subjects as demented and non-demented specifically for Alzheimer’s disease using OASIS MRI dataset. We used Boruta, a wrapper based all relevant feature selection algorithm and identified CDR and MMSE measures of dementia as the important features of MRI dataset. The LSTM based classification model exhibited a state of the accuracy of 94%. The advantage of our proposed model is that it perfectly overcomes over fitting problem. The future enhancement of the current study includes the identification of more relevant features and its correlations to generate advanced deep learning based classification and prediction models using architectures and techniques like transformer and attention mechanisms.
Abbreviations
Traumatic brain injury (TBI), Mild cognitive impairment (MCI), Deep Neural Networks (DNN), An open-Access Series of Imaging Studies (OASIS), Long Short-Term Memory (LSTM), Recurrent Neural Network (RNN), Mini mental status Examination (MMSE),Clinical Dementia Rating (CDR), Estimated Total Intracranial volume (eTIV), Normalized Whole Brain Volume (nWBV), Atlas scaling Factor(ASF).
Funding
There was no funding received for this work.
Conflict of interest
The authors declare that they have no competing interest.
References
- Suzuki K (2017) Overview of deep learning in medical imaging. Radiological physics and technology 10: 257-273.
- Marcus DS, Wang, TH, Parker J, Csernansky, JG, Morris JC, Buckner R (2007) Open Access Series of Imaging Studies (OASIS): cross-sectional MRI data in young, middle aged, nondemented, and demented older adults. J Cogn Neurosci 19: 1498-1507.
- Choi H, Kyuri, Saurin, Detecting Early Alzheimer’s Using MRI Data and Machine Learning Internet. Kaggle. Available from: www.kaggle.com/hyunseokc/detecting-early-alzheimer-s.
- Moradi E, Pepe A, Gaser C, Huttunen H, Tohka J (2015) Alzheimer's Disease Neuroimaging Initiative. Machine learning framework for early MRI-based Alzheimer's conversion prediction in MCI subjects. Neuroimage 104: 398-412.
- Zhang Y, Dong Z, Phillips P, Wang S, Ji G, Yang J, et al. (2015) Detection of subjects and brain regions related to Alzheimer's disease using 3D MRI scans based on eigenbrain and machine learning. Front. Comput. Neurosci 9: 66.
- Sørensen L, Nielsen M, Alzheimer's Disease Neuroimaging Initiative (2018) Ensemble support vector machine classification of dementia using structural MRI and mini-mental state examination. Journal of neuroscience methods 302: 66-74.
- Mamoshina P, Vieira A, Putin E, Zhavoronkov A (2016) Applications of deep learning in biomedicine. Mol. Pharmaceutics 13(5): 1445-1454.
- Ravì D, Won C, Deligianni F, Berthelot M, Andreu-Pere, et al. (2016) Deep learning for health informatics. IEEE journal of biomedical and health informatics 21: 4-21.
- Liu J, Pan Y, Li M, Chen Z, Tang L, Lu C, et al. (2018) Applications of deep learning to MRI images: A survey. Big Data Mining and Analytics 1: 1-18.
- Lundervold AS, Lundervold A (2019) An overview of deep learning in medical imaging focusing on MRI. Zeitschrift für Medizinische Physik 29: 102-127.
- Borson S, Frank L, Bayley PJ, Boustani M, Dean M, et al. (2013) Improving dementia care: the role of screening and detection of cognitive impairment. Alzheimers Dement 9:151-159.
- Zhu Z, Novikova J, Rudzicz, F (2018) Isolating effects of age with fair representation learning when assessing dementia. arXiv preprint arXiv:1807.07217.
- Young, AL, Marinescu RV, Oxtoby NP, Bocchetta M, Yong K (2018) Uncovering the heterogeneity and temporal complexity of neurodegenerative diseases with Subtype and Stage Inference. Nat commun 9: 1-16.
- Amoroso N, Diacono D, Fanizzi A, La Rocca M, Monaco A, Lombardi A, et al. (2018) Deep learning reveals Alzheimer's disease onset in MCI subjects: results from an international challenge. J NEUROSCI METH 302: 3-9.
- Jerry Guo, Austin Ho, Wonyl Choi, Dr. Marianne Bezaire (2020) Predicting Alzheimer’s Using Biological and Physical Factors with Machine Learning. Curr Alzheimer Res 17:428-437.
- Abadi M, Barham P, Chen J, Chen Z, Davis A, et al. (2016) Tensorflow: A system for large-scale machine learning. In 12th {USENIX} symposium on operating systems design and implementation ({OSDI} 16:265-283.
- Isabella C, Christian S (2018) Machine-learning neuroimaging challenge for automated diagnosis of mild cognitive impairment: Lessons learnt. J Neuro Sci Methods 302:10-13.
- Marcus DS, Fotenos AF, Csernansky JG, Morris JC, Buckner R L (2010) Open access series of imaging studies: longitudinal MRI data in nondemented and demented older adults. J cogn neurosci 22: 2677-2684.
- Rudnicki WR, Kierczak M, Koronacki J, Komorowski J (2006) A statistical method for determining importance of variables in an information system. In International Conference on Rough Sets and Current Trends in Computing. Springer, Berlin, Heidelberg 557-566.
- Rudnicki WR, Wrzesień M, Paja W (2015) All relevant feature selection methods and applications. In ‘Feature selection for data and pattern recognition’.(Eds U Stańczyk, L Jain) Studies in Computational Intelligence 584.
- Kursa, MB, Jankowski A, Rudnicki WR (2010) Boruta–a system for feature selection. Fundamenta Informaticae 101:271-285.
- Kursa M, Rudnicki W (2010) Feature Selection with the Boruta Package. J Stat Softw36: 1–13.
- Gers FA, Schmidhuber J, Cummins F (1999) Learning to forget: Continual prediction with LSTM.
- Hochreiter S, Schmidhuber J (1997) Long short-term memory. Neural computation 9:1735-1780.
- Gers FA, Schraudolph NN, Schmidhuber J (2002) Learning precise timing with LSTM recurrent networks. Journal of machine learning research 3:115-143.
- Gers FA, Schmidhuber E (2001) LSTM recurrent networks learn simple context-free and context-sensitive languages. IEEE Transactions on Neural Networks 12: 1333-1340.
- Ardekani BA, Bachman AH, Figarsky K, Sidtis JJ (2014) Corpus callosum shape changes in early Alzheimer’s disease: an MRI study using the OASIS brain database. Brain Structure and Function 219: 343-352.
- Hyunseokchoi, Kyuri, Saurin. Detecting Early Alzheimer’s Using MRI Data and Machine Learning [Internet]. Kaggle. Available from: www.kaggle.com/hyunseokc/detecting-early-alzheimer-s.
- Andrew, Predict Alzheimer’s disease using Sci-kit Learn and Tensorflw [Internet]. Kaggle. Available from: www.kaggle.com/andrew32bit/predict-alzheimer-disease-sl-and-tf.
- Ruslan Klymentiev (2018) Dementia prediction with tree based models [Internet]. Kaggle. Available from: www.kaggle.com/ruslankl/dementia-prediction-w-tree-based-models.